Transcription
AJCP / Original ArticleBlood Flow Cytometry in Sézary SyndromeNew Insights on Prognostic Relevance andImmunophenotypic Changes During Follow-upCME/SAMFrom the 1Dermatologic Clinic, Department of Medical Sciences, and 2Department of Public Health and Pediatrics, University of Torino, Torino, Italy.Key Words: Sézary syndrome; CTCL; CD26; Flow cytometry; Hypermethylation; Immunophenotypic changesAm J Clin Pathol January 2015;143:57-69DOI: 10.1309/AJCP1NA3YCHCDEIGABSTRACTObjectives: Sézary syndrome (SS) is characterized byerythroderma, generalized lymphadenopathy, and thepresence of circulating atypical lymphocytes, which aredifficult to identify by morphologic data.Methods: We revised our series of 107 patients in an attemptto better define the phenotypic aberrancies in blood atdiagnosis and the immunophenotypic stability over timedetected by flow cytometry. Polymerase chain reactionassay was also used to study CD26/dipeptidyl peptidase IV(DPPIV) gene methylation.Results: The most common aberrancies were representedby the lack of CD26 (96/107) or CD38 (101/107) expressionand the presence of a “dim” CD3, CD4, or CD2 population.There was a high variability in CD7 expression. In total,31% of the patients had phenotypical heterogeneity in CD26and CD7 expression at diagnosis. The phenotype was stableover time in 73 of 95 patients with available follow-up data,while 22 of 95 patients developed changes in CD26, CD7, orCD2 expression. CD4 CD26– SS showed hypermethylationof the CpG islands for the promoter region of CD26/DPPIV.Multivariate analysis showed that CD26 expression is afavorable prognostic factor (hazard ratio, 2.94; P .045).Conclusions: We confirm the relevance of CD26 negativityin SS diagnosis and monitoring. Nevertheless, the presenceof rare CD26 cases suggests that a multiparameter flowcytometry approach should be used. Changes in methylationprofile could account for phenotypical heterogeneity. American Society for Clinical PathologyUpon completion of this activity you will be able to: list the flow cytometric abnormalities that are typically seen inperipheral blood lymphocytes from patients with Sézary syndrome(SS). describe features that differ between mycosis fungoides and SS. describe the pattern of peripheral blood lymphocyte flow cytometricimmunoreactivity that is associated with a favorable survival in SS.The ASCP is accredited by the Accreditation Council for ContinuingMedical Education to provide continuing medical education for physicians.The ASCP designates this journal-based CME activity for a maximum of1 AMA PRA Category 1 Credit per article. Physicians should claim onlythe credit commensurate with the extent of their participation in the activity. This activity qualifies as an American Board of Pathology Maintenanceof Certification Part II Self-Assessment Module.The authors of this article and the planning committee members and staffhave no relevant financial relationships with commercial interests to disclose.Questions appear on p 150. Exam is located at www.ascp.org/ajcpcme.Sézary syndrome (SS), characterized by erythroderma,generalized adenopathies, and peripheral blood involvement,is considered the leukemic variant within the spectrum ofcutaneous T-cell lymphomas (CTCLs).1 Blood involvementis a constitutive SS feature and is included in the diagnosticcriteria of the International Society for CutaneousLymphomas (ISCL) and the European Organization ofResearch and Treatment of Cancer (EORTC).2,3 The correctmorphologic identification of Sézary cells (SCs) can bedifficult and presents a high interobserver variability,making SS a suitable model for a flow cytometric study,which is more sensitive and accurate for both diagnosticpurposes and tumor burden monitoring during follow-up.4-7Circulating SCs display a postthymic T (CD3 , CD5 ,CD28 , TCRαβ ) helper (CD4 CD8–), “central memory”(CD45RO , CCR7 , CD27 )8,9 phenotype, with a peculiarskin-homing tendency due to the presence of the cutaneouslymphocyte antigen10 and chemokine receptors CCR4 andAm J Clin Pathol 2015;143:57-69DOI: 10.1309/AJCP1NA3YCHCDEIGDownloaded from /1/57/1761236 by guest on 10 September 2018Mauro Novelli, MSc,1 Paolo Fava, MD,1 Cristina Sarda, MD,1 Renata Ponti, MSc,1Simona Osella-Abate, MSc,1 Paola Savoia, MD,1 Massimiliano Bergallo, MSc,2Francesco Lisa, MSc,1 Maria Teresa Fierro, MD,1 and Pietro Quaglino, MD157
Novelli et al / Flow Cytometry Immunophenotyping in Sézary SyndromeMaterials and MethodsPatientsFlow cytometry was used to screen blood samples from805 primary cutaneous or secondary T-cell lymphomasfrom October 1985 to December 2012 at the DermatologicClinic of Turin University. Initial diagnosis was establishedaccording to ISCL/EORTC criteria,1,2 using a combinationof clinical, histologic, and immunohistochemical findings.All patients had a skin examination, morphologic analysisof blood smears, flow cytometric immunophenotyping, andTCR gene rearrangement analysis performed by polymerase58Am J Clin Pathol 2015;143:57-69DOI: 10.1309/AJCP1NA3YCHCDEIGchain reaction (PCR) or GeneScan electrophoresis analysis(Applied Biosystems, Weiterstadt, Germany).29,30 Wefound the presence of phenotypically atypical circulatingT lymphocytes in 168 (20.9%) of 805 cases. Amongthese, the most frequent disease was SS (107/168 [63.7%])followed by MF (38/168 [22.6%]), other peripheral T-celllymphomas (11/168 [6.5%]), and T-cell prolymphocyticleukemia (12/168 [7.1%]). Molecular analysis was done onarchival samples in cases diagnosed before 1995. The studywas performed according to the principles of good clinicalpractice and the Declaration of Helsinki principles. Allpatients gave their written informed consent for diagnosticprocedures; ethical approval for this study was obtainedfrom the ethical committee of the “Azienda OspedalieraCittà della Salute e della Scienza di Torino.”Flow CytometryOur archives contain 2,434 flow cytometry standard(FCS) files collected since 1985 using FACSCan (software,CONSORT 30 and FACScan Research), FACSCalibur(software, CellQuest), and, since 2009, FACSCanto IIcytometer (BD Biosciences, San Jose, CA), equipped withthree lasers: blue (488 nm), red (633 nm), and violet (405nm). Repeated immunophenotypic studies (minimum ofthree blood samples) during follow-up were available in95 of 107 patients with SS. Currently, PBLs are analyzedaccording to their immunofluorescence reactivity usinga standard red blood cell lysis method: 20,000 peripherallymphocytes included in a forward angle light scatter vsright-angle light scatter and CD45 gate are acquired andanalyzed by FACSDiva 6.1.2 software (BD Biosciences).Eight-color immunofluorescence analyses are performedsimultaneously using antibodies conjugated to fluoresceinisothiocyanate (FITC), phycoerythrin (PE), peridininchlorophyll protein–Cy5.5, (PerCP-Cy5.5), phycoerythtinCy7 (PE-Cy7), allophycocyanin (APC), allophycocyanin-H7(APC-H7), Horizon V450 (V450), and Horizon V500 (V500).Where it was deemed necessary to recheck carefully thephenotype of older cases, Flow Explorer software (freeware,Ron Hoebe compilation, Academic Medical Center,Department of Cell Biology and Histology, University ofAmsterdam, The Netherlands) was used to locate FCS filesin the archives.Listmode files were retrospectively analyzed based onad hoc templates created on FACSDiva 6.1.2 software (BDBiosciences). The old two-color CONSORT 30 FCS files(ie, CD4/CD7 and CD4/CD26) were reviewed by Infinicytsoftware (Cytognos SL, Salamanca, Spain), on the basisof a CD4 common parameter to obtain the informationthat was not available at the time of the acquisition, asa CD4/CD7/CD26 new combination using “merge andrecalculation” steps. American Society for Clinical PathologyDownloaded from /1/57/1761236 by guest on 10 September 2018CCR10.11,12 SS is regarded as a Th2-dominant disease or,in a subgroup of patients, as a Treg disorder,13,14 opposite tothe Th1 pattern of early mycosis fungoides (MF). The mostfrequent aberrancies are represented by the lack of CD26,15-20CD7,21-23 and CD24 on their surface or by phenotypicallyaberrant populations that express a different amount of cellsurface proteins than do normal T-cell populations (“dim” or“bright”).4,24 Although flow cytometric analysis of the T-cellreceptor (TCR)–Vb chain variable region can also be usedto demonstrate clonality, this method is time-consumingand can identify only around 70% of the cases.25,26 Tumorburden is a major prognostic factor1,27,28 in patients with SSand can be monitored by flow cytometry. The reliability ofthis method is based on the assumption that the phenotyperemains stable over time.Few studies in the literature discuss the phenotypeheterogeneity at diagnosis and its stability during followup,6,23 and most group SS and MF in all disease stages asthe same disease, despite the possibility of their arising fromdifferent functional T-cell subsets.This article reports our retrospective review of serialperipheral blood lymphocyte (PBL) immunophenotypingof 107 patients with SS at diagnosis and during followup aimed at the identification of the most usefuldiagnostic markers. We also investigated the possibilityof a phenotypical heterogeneity of the neoplastic cells atdiagnosis or an instability during follow-up. As CD26surface negativity is the most frequent abnormality in SS, wealso decided to investigate CD26 gene silencing by meansof hypermethylation of its promoter; this is a well-knownfeature of neoplastic cells and plays an important role innormal cell differentiation and development. Indeed, DNAmethylation is an essential mechanism for normal cellulardevelopment, imprinting, X-chromosome inactivation,and maintenance of tissue specificity: hypermethylationrepresses transcription, while hypomethylation can lead toincreased transcription levels.
AJCP / Original ArticleMolecular AnalysisTCR-γ Gene Rearrangement AnalysisPCR was routinely used to detect the presence of a clonalTCR rearrangement. PCR with primers directed against theTCR-γ gene was performed as previously described.28TCRγ-GR was studied on serial blood determinations byGeneScan capillary electrophoresis analysis, as previouslydescribed, in 24 of 107 patients.30DNA Methylation PCR Array for the CD26/DipeptidylPeptidase IV GeneThe Methyl-Profiler qPCR Primer Assay for HumanDPP4 (CpG Island 03780): MePH03780-2 (Qiagen,Valencia, CA) uses the MethylScreen technology (Orion American Society for Clinical PathologyGenomics, St Louis, MO). This method is based on thedetection of the leftover input DNA after cleavage witha methylation-sensitive and/or a methylation-dependentrestriction enzyme. These enzymes will digest unmethylatedand methylated DNA, respectively. The remaining DNA isquantified after digestion by real-time PCR in each individualenzyme reaction, using primers that flank a promoter (gene)region of interest. The relative fractions of hypermethylated,intermediately methylated, and unmethylated DNA aresubsequently determined by comparing the amount in eachdigest with that of a no-enzyme added reaction.Three digestion reactions were prepared, three with eachof the enzymes and one not digested reaction (Mo, Ms, Md,and Msd), according to the Qiagen instructions. The SYBRGreen quantitative PCR array was performed as follows: 95 Cfor 10 minutes, three cycles at 99 C for 30 seconds and 72 Cfor 1 minute, and 40 cycles at 97 C for 15 seconds and 72 Cfor 1 minute. SYBR Green fluorescence from each well duringthe annealing step of each cycle was detected and recorded.EpiTect Methyl PCR Array Ct analysis was performed on anExcel-based data template, available at www.sabiosciences.com/dna methylation data analysis.php.The minimum level of hypermethylation consideredpositive can be set at 10% to 20%. However, this isdependent on the ratio of target vs nontarget cells present inthe sample (ie, normal cells mixed with cancerous cells). Toovercome this threshold problem, we checked methylationon 98%/99.5% CD4 purified cells.Statistical AnalysesStatistical analyses were performed using the STATA12.0 statistical software (StataCorp LP, College Station, TX).Data that were significant according to the KolmogorovSmirnov tests were considered to have a non-Gaussiandistribution and were described by median and range. Thecell percentages were compared between groups using a oneway nonparametric analysis of variance (Kruskal-Wallis)test, followed by Dunn’s multiple-comparison post hoc testfor multiple groups. Data were considered significant whenP .05. Overall survival (OS) was calculated from the dateof SS diagnosis to the date of death or last checkup for allpatients. In the univariate analyses, product limit estimateswere derived using the Kaplan-Meier method, and statisticalcomparisons were carried out by the log-rank Mantel-Coxtest. Univariate/multivariate analyses were carried out toevaluate the influence that different variables had on OS. Inthe univariate/multivariate analysis, sex, B1/B2 blood stage,the presence of dim marker expression on atypical cells, lossof T-cell markers, and CD7 and CD26 expression (positive/mixed vs negative) were dichotomized; age at diagnosis,number of atypical cells, percentage of atypical cells, andCD4/CD8 ratio were continuous.Am J Clin Pathol 2015;143:57-69DOI: 10.1309/AJCP1NA3YCHCDEIG59Downloaded from /1/57/1761236 by guest on 10 September 2018The fluorochrome-conjugated monoclonal antibodiesused against T-cell antigens included anti-CD2 FITC, PE, orPE-Cy7 (clone S5.2); anti-CD3 FITC, PE, or PerCP-Cy5.5(clone SK7); anti-CD4 FITC, PE, or V450 (clone SK3);anti-CD5 FITC or APC (clone L17F12); anti-CD7 FITC orPE (clone 4H9) or anti-CD7 PerCP-Cy5.5 (clone M-T701);anti-CD8 PE or APC-Cy7 (clone SK1); anti-CD26 PE (cloneL272); anti-CD27 FITC or APC (clone M-T271); anti-CD28PE (clone CD28.2); anti-CD38 PE or PE-Cy7 (clone HB-7);anti CD45RA FITC (clone 4KB5); anti-CD45RO PE (cloneUCHL1); anti-CD45 PerCP or V500 (clone HI30); and CD62LAPC (clone DREG-56), all from BD Biosciences, as well asanti-CD26 APC (clone CLB-22C3) from Caltag Laboratories(Burlingame, CA). The negative staining threshold wasestablished by the addition of an isotype-matched controltube. The analysis of the TCR-Vb repertoire was done usinga commercially available kit (IOTest Beta Mark TCR-VβRepertoire Kit; Beckman Coulter, Miami, FL) designedto quantitate 24 different TCR-Vβ specificities coveringapproximately 70% of the normal human TCR-Vβ repertoire.Over the past 2 years, the panel was enhanced by theaddition of anti-KIR3DL2/CD158k PE (clone AZ158k), kindlyprovided by Innate-Pharma (Marseille, France), as well as antiPD1/CD279 PerCP-Cy5.5 (clone EH12.1) and anti-NKP46/CD335 PE (clone 9E2/Nkp46), both from BD Biosciences.Neoplastic T-cell populations were identified on thebasis of patterns of aberrant antigen expression with respectto the normal internal phenotypic populations according todefinitions by Vaughan et al7 and Jamal et al.31 A change inimmunophenotype over time was defined as a gain or loss ofan antigen on atypical cells stable in at least two consecutivesamples. A modification of antigen intensity was acceptedonly when there was a log difference of at least 0.5. Toidentify any shifts in relative fluorescence over time causedby changes in reagents or instruments, we compared levelsof antigen expression with normal internal cell populations.
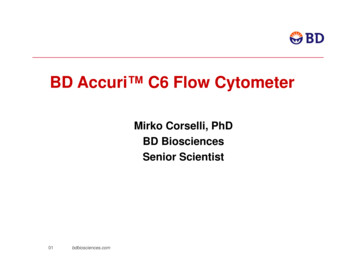
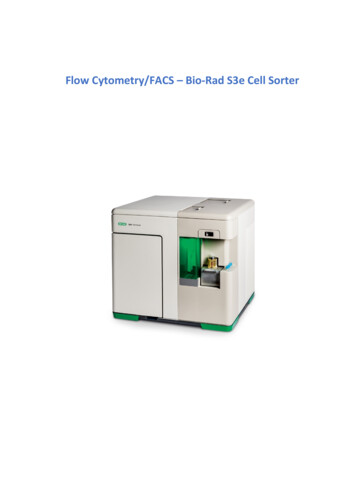
Novelli et al / Flow Cytometry Immunophenotyping in Sézary Syndrome1043103CD26 PE210110010010123010104103102310 10 10TCR-Vβ17 FITCCD26 PE211002101101001012310 10 10TCR-Vβ2 FITC40101041031012310 10 10TCR-Vβ2 FITCCD26 PE21011002101100101001012310 10 10TCR-Vβ5.1 FITC41010012310 10 10TCR-Vβ5.1 FITC104210110010410310010 10 10TCR-Vβ17 FITC101100010 10 10TCR-Vβ2 FITC010 10 10TCR-Vβ5.1 1031044410CD4 APC11042101100104 Figure 1 Six different Sézary syndrome cases in which the atypical Sézary cells population (in red) is identified at baseline by CD4 T-cell receptor (TCR)–Vb positivity (A-F). Different CD26 expression: dot plots show CD26 negativity (A-C) and a CD26 mixed patternwith different amount of CD26 (D-F). CD7 expression in dot plots is negative (A, D), mixed (B, E), and positive (C, F).ResultsPatient CharacteristicsA total of 107 patients with SS (58 males and 49females, median age 69.5 years at diagnosis) were studiedwith a median follow-up of 24.9 months (range, 1.2128.9 months). At diagnosis, all patients had pruriginouserythroderma (two of 107 also displayed skin nodules),diffuse superficial adenopathies, atypical circulating SCs( 1,000 cells/mL), and circulating T-cell clones detectedby TCR-g chain analysis with the use of PCR. An identicalclone was evidenced in all patients tested (n 50), both inblood and skin, by GeneScan analysis. Twelve patients had a60Am J Clin Pathol 2015;143:57-69DOI: 10.1309/AJCP1NA3YCHCDEIGhistory of MF and 20 a long-standing erythroderma that hadbeen misdiagnosed as reactive dermatitis.The median WBC count at diagnosis was 11,220/mL (range, 3,270-61,670/mL). The median percentage andabsolute lymphocyte count were 39% (range, 10%-95.1%)and 4,314/mL (range 1,002-53,036/mL), respectively.Immunophenotypic Findings: Heterogeneity at DiagnosisThe most commonly observed lymphocyte immunophenotypic pattern in patients with SS was CD3 ,CD5 CD4 , CD8–, CD27 , CD28 , and CD45RO ,with a consequent increase in the CD4/CD8 ratio (median,11.19; range, 0.95-990). The most common aberrancy at American Society for Clinical PathologyDownloaded from /1/57/1761236 by guest on 10 September 201810 10 10TCR-Vβ17 FITC410CD4 APC110010C210CD7 PerCP-Cy 5.5CD4 APC10BCD7 PerCP-Cy 5.5410CD7 PerCP-Cy 5.5A
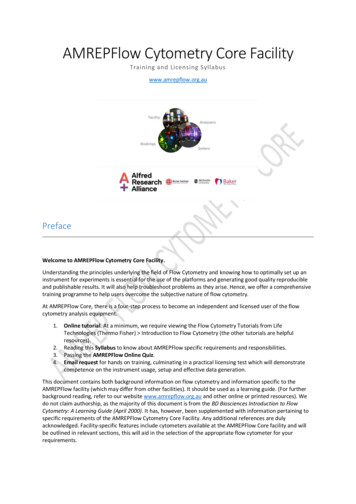
AJCP / Original Article1043103CD26 PE210110010010123010104103102310 10 10TCR-Vβ2 FITCCD26 PE211002101101001012310 10 10TCR-Vβ5.1 FITC40101041031012310 10 10TCR-Vβ5.1 FITCCD26 PE21011002101100101001012310 10 10TCR-Vβ3.1 FITC4101002310 10 10TCR-Vβ3.1 FITCdiagnosis was a lack of CD26 expression Figure 1A , Figure 1B , and Figure 1C (central dot plots) and wasobserved in 96 (89.7%) of 107 cases. While 11 patients(10.3%) showed a “mixed” phenotype with a variable percentage of atypical CD26 SCs Figure 1D , Figure 1E ,and Figure 1F (central dot plots), this was predominant inonly three cases (Figure 1E). In 84 of 107 cases, clonalitywas investigated by means of anti-TCR antibodies: in 50(40%) cases, a clonal population was positively identified.The CD4 CD26– subset in the 96 CD26– patients with SS(median, 66; range, 16-97.50) matched with the atypicalpopulation detected by the analysis of the TCR-Vb chainvariable region and/or by T-marker dim expression (linearregression analysis: R2 0.77). A high variability in CD7expression was documented: 51 (47.7%) patients wereCD7– (Figure 1A,D, dot plots on the right), 26 (24.3%)were CD7 (Figure 1C,F, dot plots on the right), and 30 American Society for Clinical Pathology1210110010410310104010 10 10TCR-Vβ2 FITC101100010 10 10TCR-Vβ5.1 FITC010 10 10TCR-Vβ3.1 1031044410CD4 APC11042101100104(28%) displayed the simultaneous presence of CD7 andCD7– SCs (Figure 1B,E, dot plots on the right). A total of28 (26.2%) of 107 cases had a loss of T-cell markers otherthan CD26 and CD7. The most frequent was a CD2 loss in23 of 28 cases, with four complete Figure 2B (central dotplot) and 19 partial Figure 2A (central dot plot), followedby a CD4 loss in five of 107 cases (complete in two andpartial in three). One case showed a coexistent CD2 andCD4 loss, and another had a CD45RO– CD45RA– phenotype. None of the 107 patients with SS showed either aCD3 or CD5 loss.Either a “dim” or, more rarely, a “bright” populationwas found in 103 (96.3%) of 107 cases. The most frequentlyexpressed “dim” markers were CD3 (82/107 [76.6%]),CD4 (52/107 [48.6%]), CD2 (47/107 [43.9%]), and CD7(21/107 cases, with 20% considering only the positive andmixed cases). Several patients had more than one “dim”Am J Clin Pathol 2015;143:57-69DOI: 10.1309/AJCP1NA3YCHCDEIG61Downloaded from /1/57/1761236 by guest on 10 September 201810 10 10TCR-Vβ2 FITC410CD4 APC110010F210CD7 PerCP-Cy 5.5CD4 APC10ECD7 PerCP-Cy 5.5410CD7 PerCP-Cy 5.5D
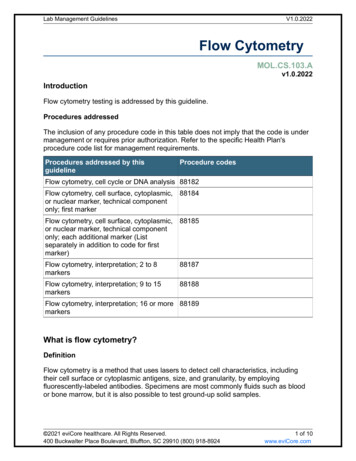
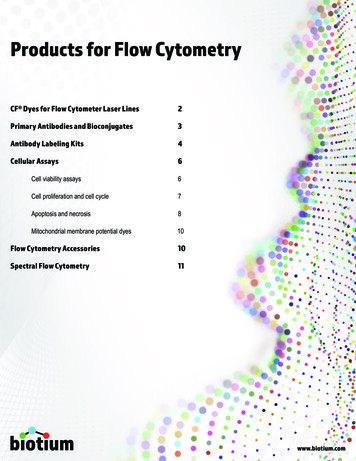
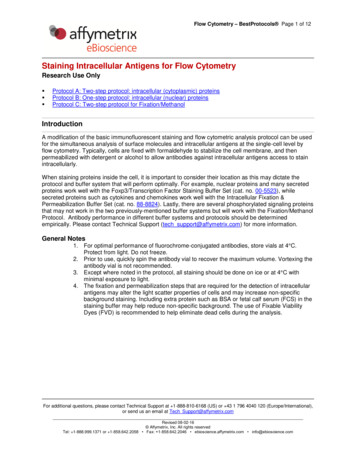
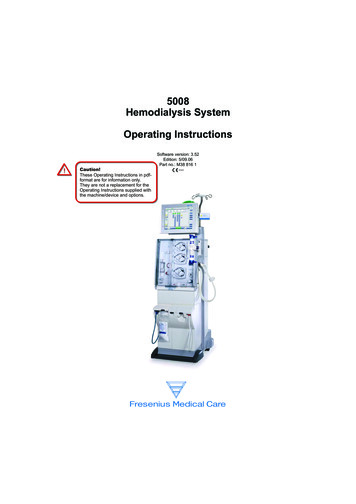
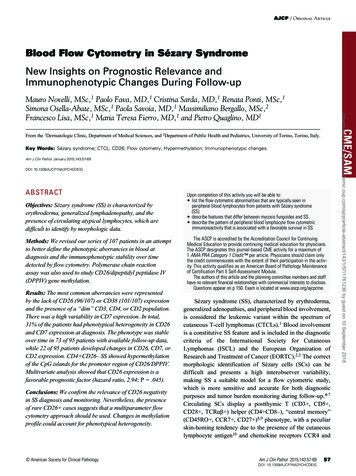
Novelli et al / Flow Cytometry Immunophenotyping in Sézary Syndrome10310CD2 FITCCD26 PE102101100431032101101012341010310CD2 PE-Cy7102101100123410 10 10 10CD3 PerCP-Cy 5.541031010123410 10 10 10TCR-Vβ5.2/5.3 FITC1234010 10 10 10TCR-Vβ5.2/5.3 FITC12343210110210110010010 10 10 10CD3 PerCP-Cy 5.5401001010100123410 10 10 10TCR-Vβ5.2/5.3 FITC10 Figure 2 Aberrancies in CD2 and CD38 expression in two different Sézary syndrome (SS) cases. A, Patient with SS withCD3 dim CD26– phenotype, aberrant mixed CD2– and CD2 dim populations, and CD38 negativity. B, Patient with SS withT-cell receptor (TCR)–Vb 5.2/5.3 CD26– phenotype, CD2 negativity, and CD38 negativity.population (Figure 2A, central dot plot); the most common was CD2dimCD3dim (31 cases [29.0%]; 21/31 wereCD2dimCD3dimCD4dim).CD38 expression was significantly lower (median, 17.5%; range, 1%-94%) than in healthy participants(median, 65%; range, 20%-88%) in all but six patients.The CD4 CD38– population (median, 70.0%; range,5%-97.90%) matched with the CD4 CD26– one (linear correlation 0.86 in CD26– patients with SS) (Figures 2A and2B, dot plot on the right).Beginning in 2010, CD279/PD1, KIR3DL2/CD158k,and NKP46/CD335 were added to our panel and investigated in 17 of 107 patients. CD279/PD1 was constantlydetected on SCs Figure 3A and Figure 3B (second dot plotfrom right), whereas CD158k was expressed in only 40% ofpatients (Figure 3B, second dot plot from left), and NKP46was negative (Figures 3A and 3B, first dot plot from right)in all but one of the patients.Both subsets within the “CD26-mixed” cases belongedto the same TCR-Vb clone, as demonstrated by flow cytometry (Figures 1D, 1E, and 1F, central dot plots) and GeneScananalysis Figure 4 , which clearly identified the presenceof a single neoplastic clone. It was possible to repeat theGeneScan analysis during follow-up in four of 11 patients,confirming the stability of the clone.62Am J Clin Pathol 2015;143:57-69DOI: 10.1309/AJCP1NA3YCHCDEIGNo relevant phenotypical differences were found in the12 patients with a prior MF diagnosis with respect to SSright from the beginning: two of 12 showed immunophenotypic heterogeneity at diagnosis with a CD26 subset, onewas CD7 , two were CD7 mixed, and nine were CD7–.Immunophenotypic Stability During Follow-upA stable phenotype over time was documented in 73(76.8%) of 95 patients with SS with serial determinations(minimum of three samples), in contrast to an unstable oneobserved in 22 (23.2%) of 95. Phenotypic changes concerned a single antigen in 17 cases and two simultaneousantigens in five cases. In detail, 11 (12.1%) patients acquireda CD4 CD26 subset variable from 2% to 86%, and twolost the small CD4 CD26 fraction that had been detectedat diagnosis. Figure 5 shows the variations over time ofthe CD4 CD26 subpopulations according to treatment in apatient; interestingly, Gene Scan analyses performed duringtime showed no molecular changes despite the phenotypical switch observed. Positive or negative changes in CD7expression were observed in nine (8.5%) patients (fourcases from negative to mixed or positive and five casesfrom mixed to negative or positive). Five cases had changesin CD2 expression (four from negative to positive and onefrom positive to negative). No variations in fluorescence American Society for Clinical PathologyDownloaded from /1/57/1761236 by guest on 10 September 201841011010010 10 10 10CD3 PerCP-Cy 5.52100100CD26 PE10010B4CD38 APC410CD38 APCA
AJCP / Original Article3103CD158k PECD26 APC1021011001100101001012310 10 10TCR-Vβ22 FITC4010104103102310 10 10TCR-Vβ22 FITC1010410310310110043CD158k PE102101100210110010100101012310 10CD4 V450104100101210 10CD4 V4503210010410CD26 APC1410412310 10 10TCR-Vβ22 FITC10102101100410104104103103102101100010101210 10CD4 V4503104100123101231010 10 10TCR-Vβ22 FITC421011001001010 10CD4 V4504 Figure 3 A, Patient with Sézary syndrome (SS) patient with high tumor burden: immunophenotype T-cell receptor (TCR)–Vb22 ,CD26–, CD158k–, CD279 , NKP46– (red). B, Patient with SS with low tumor burden: immunophenotype CD4 dim, CD26–,CD158k dim, CD279 , NKP46– (red). Residual normal CD4 lymphocytes are CD26 , CD158k–, CD279 , NKP46– (black).intensity were observed during follow-up, and the “dim”or “bright” CD3 or CD4 populations detected at diagnosisremained stable over time. In 11 of 22 cases, the onset ofa new population was preceded by a treatment-induced,almost complete disappearance of circulating SCs (alemtuzumab in seven patients and fludarabine in four patients).CD26/Dipeptidyl Peptidase IV Gene HypermethylationThe DNA methylation profile of the CpG islands for thepromoter region of CD26/dipeptidyl peptidase IV (DPPIV)on PBLs was examined in 10 patients with SS and fivehealthy donors. Since the results were ambiguous, we decided to repeat the experiment on CD4 purified lymphocytes(five patients with SS and two healthy donors) and reportthe data as follows: all SS cases with a CD26– phenotype(CD4 CD26– population 85%) were hypermethylated,whereas a lower level of hypermethylation was observed(82% hypermethylated and 18% unmethylated) in an SScase with a consistent CD4 CD26 percentage (24%). Allnormal samples were unmethylated Table 1 .Univariate/Multivariate Analyses of Prognostic FactorsFive- and 10-year OS was 31.6% and 15.4%, respectively, and 68 patients died during follow-up. The following parameters detected at diagnosis were considered American Society for Clinical Pathologyfor univariate survival analysis: sex, age, percentage andabsolute number of circulating SCs, CD4/CD8 ratio, B1/B2 blood stage, previous MF diagnosis, marker loss (CD7,CD26, and others), and the presence of “dim” populations Table 2 . The parameters related to tumor burden (ie,percentage and absolute SC number) were both identifiedas having a statistically significant association with poorsurvival, whereas sex and age, previous MF diagnosis, andphenotypic aberrancies related to CD7 Figure 6A and CD2(data not shown) expression at diagnosis had no impact onsurvival. Interestingly, patients characterized by the presence of a variable proportion of CD26 atypical cells atdiagnosis showed a statistically significant higher OS (P .050) Figure 6B . CD26 expression maintained a significantrole (hazard ratio [HR], 2.94; P .045) in the Cox multivariate model when corrected for main EORTC prognostic factors: B1/B2 blood stage (HR, 2.14; P .013) and CD4/CD8ratio (HR, 1.00; P .031) (Table 2).DiscussionCTCLs are a clinically heterogeneous group derivedfrom skin-homing T lymphocytes with different biologicalprofiles and clinical course.32,33 Since a large seriesAm J Clin Pathol 2015;143:57-69DOI: 10.1309/AJCP1NA3YCHCDEIG63Downloaded from /1/57/1761236 by guest on 10 September 2018B21010CD335 (NKP46)4CD335 (NKP46)10CD279 PerCP-Cy5.5410CD279 PerCP-Cy5.5A
Novelli et al / Flow Cytometry Immunophenotyping in Sézary SyndromeACD26 PE180104103210101100010123410BCD26 PE410321010110001012310 10 10TCR-Vβ2 FITC410270300330360263 VIp 00330360390420297 VIγ (5,042) Figure 4 GeneScan identifies a single pathologic clone (filled peak), whereas cytometric analysis shows a continuousspectrum of CD26 expression from positive to negative (case A) and the coexistence of two CD26 and CD26– subsets (caseB), both expressing a single T-cell receptor (TCR)–Vb chain in the same peripheral blood lymphocyte sample.of patients with SS with a median follow-up of 24.9months was available to us, we were able to carry outa retrospective immunophenotypic study to evaluate theefficacy that flow cytometry has in the quantificationof atypical circulating SCs. This method was applied todefine the most frequent aberrancies that had a diagnosticimpact and to investigate the phenotype stability overtime.The most frequent aberrancies observed in more than90% of patients were a defective CD26 expression or amodification of antigen expression intensity (dim or bright),whereas CD7 expression always varied greatly. Since 1987,our group15,34 has focused on the CD26 molecule, underlyingits importance in SS diagnosis and suggesting that a cutoff of30% of the CD4 CD26– population provides a reliable toolwhen differentiating SS from inflammatory erythroderma.13In our experience, the PE-CD26 clone L272 (BD Biosciences)is the most reliable of the antibodies available, in agreementwith the Euroflow Consortium.35 The right choice ofantibody is critical to avoid misinterpretations.5 The use ofan antibody that underestimates the CD26 population couldlead to a consequent increase of the CD4 CD26– subset inboth normal and reactive skin.64Am J Clin Pathol 2015;143:57-69DOI: 10.1309/AJCP1NA3YCHCDEIGCD26/DPPIV, considered a T-cell activation antigen,is a characteristic transmembrane glycoprotein withmultiple biological functions—it acts as a serine protease,receptor, costimulator, and adhesion molecule, and itinduces apoptosis. Herein we discuss the role that the CpGhypermethylation of the CD26 gene promoter regionplays in the loss of the CD26 surface marker, the sameas that observed in adult T-cell leukemia (ATL).36 Tsujiet al36 demonstrated that CD26– ATL cells had faintlydetected transcripts of the gene that were aberrantlymethylated. CpG methylation of various genes may be oneof the most important molecular events in the late sta
Flow Cytometry Our archives contain 2,434 flow cytometry standard (FCS) files collected since 1985 using FACSCan (software, CONSORT 30 and FACScan Research), FACSCalibur (software, CellQuest), and, since 2009, FACSCanto II cytometer (BD Biosciences, San Jose, CA), equipped with three lasers: blue (488 nm), red (633 nm), and violet (405 nm).