Transcription
A 1997 Introduction to T Theoryby Terrence H. Laundry,Welcome to my 1997 update of my T Theory which I discovered during the 1970’s. This Introductioncontains edited past material to give what I hope is the best overview of the time symmetry property whichI believe underlies all market trends. This tool can provide investors a great deal of insight to investmenttrends and I hope the information proves helpful in your own endeavors. Please keep in mind Laundry andCompany materials are provided for educational purposes and of course can not be guaranteed.If you find the material useful and wish to purse our work further please speak with Paula Burke my VicePresident at our toll free number 1-888-228-2995. Our current publications are available for as little as 50per year and many more resources are available at no cost at our web site www.amshar.com Now a bitabout the history of what I call The Theory of Matched Trend Time or just T Theory for short.The History of T TheoryT Theory is a method of analyzing general investment trends using a time symmetry property Idiscovered in the early 1970’s. At that time the time symmetry was christened “The Law of Matched TrendTime” because it basically states the duration over which investors can obtain “superior equity returns”will always be equal to the previous time period in which returns were subnormal. A simpler way to put itis to say the market can only “make a strong run ” as long as it has previously ”rested”. As you mightexpect, the practical purpose of the theory is to anticipate the runs of “superior returns”.This time match property can be shown to be reasonably accurate and reliable historically so I haveproposed as a natural property inherent in market trends but of course we have no real knowledge, soresults can not be guaranteed. The time symmetry is most easily represented by the graphical “T” thus thename T Theory. In all instances the left side of the graphical T spans the market’s “rest period” while theright side spans the “ run period’ where returns should be the greatest.Since its discovery there have been a number of successes which I have referenced for interested readers.During the early years, I became acquainted with Marty Schwartz, who took a very early interest in the Tconcept, and applied his exceptional talents to become one of the greatest stock market traders. Hisexploits, philosophy and comments on my theory were presented in Market Wizards by Jack Schwager1in 1989. To this day I still receive inquires on how to obtain the “secrets to wealth” that Marty discussedin this book. On this point I am sorry to to inform many of you that there are no easy secrets, onlypowerful tools with which you might learn to uncover major opportunities before the masses arrive.Marty and I have often talked over the years about the special advantages conferred on us by our USMarine Corps training. It takes a special state of mind to “sign up” for a short boat trip, in a flimsylanding craft, to a beach completely controlled by hordes who have anticipated your arrival and have set upevery imaginable way to do you in. Buying into major market opportunities presents a similarlydiscouraging picture. You may have good reason to anticipate profits, but if a great opportunity does indeedexist, nearly everyone will be against you, including your friends, and the predominant opinion expressedby your peers, including people you respect, will be that you are embarking on a foolhardy enterprise.I believe that T Theory’s major contribution will be to show you why it will always be difficult to buy atmajor lows, but using its reasoning you may be able to overcome these obstacles. At each and every greatbuying point you must struggle at the “moment of truth” where you face seemingly overwhelmingnegative odds. In T Theory this moment of truth is called “The center post of the T”. It represents thepoint in time where all the bearish negatives of the past have been discounted by the market and is about tobe transformed into an emerging, new bull market.Finding this key juncture is a potentially dangerous occupation, but as with all good Marines, oneeventually remembers during the heat of battle, to keep ones head down, shoot straight when it’s your turn1Jack D. Schwager, Marty Schwartz, Market Wizards , (New York Institute of Finance, Simon & Schuster, 1989), p 263.A 1997 Introduction to T Theory Copyright 1997 by Terry LaundryPage 1
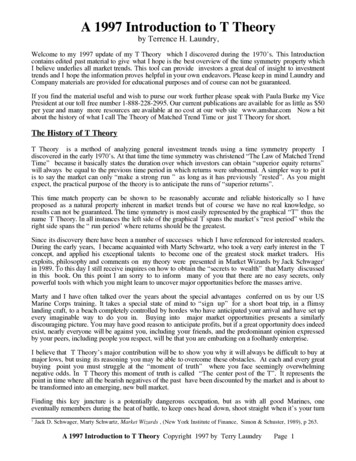
and always be faithful to your core principles in order to keep casualties to a minimum. In this regard it iswise to keep in mind a few basic T concepts:Remember: The center post of a T can simply be viewed as a “Mirror in Time” inwhich the future is seen as an inverted reflection of the recent past. It is essential thatyou understand at the center post low, the pessimism of the recent past will give way tooptimism in the future; the conservatism of the past will give way to speculation in thefuture, and the poor rates of return of the recent past will turn into superior rates ofreturn in the future. If you don’t get this straight you will have great difficulty makingmoney in the equity market.The Early HistoryDuring the early 1970’s I stumbled onto the curious observation that strong market up trends often lastedfor the same number of weeks or months as the prior correction or decline. This was very apparent incertain cyclical stock market indexes such as the Dow Jones Transportation Average, the Value Lineunweighed average of some 1600 stocks, and other cyclical indexes of stock prices back in those days. As Ibuilt up a history of these time symmetry relationships it was clear there were certain periods in which theduration of every cyclical uptrend nearly exactly matched the duration of the prior downtrend. Over theyears, my job of keeping T Theory current in an ever evolving environment is finding straightforwardexamples that illustrate this so called “Theory of Matched Trend Time”. I am continually researchingmethods that can be applied to a practical matter of finding superior equity investment opportunities.Historically my T Theory has evolved through three stages, starting with the Transport chart on the nextpage taken from an early study which was appropriate for its time. Later the same simple principles wereused to establish equity mutual fund projections using the Value Line Unweighed Composite Index as Ihave shown in the next chart. For the modern era I have shifted to the Daily Cumulative A-D line for theNY Exchange as the primary indicator of this presumed “natural” law. It can be seen in the color chartsthat follow . I have also added a brief illustration of the theory as it was applied to very long and very shorttrends to round out this introduction.I should point out that one objection to the T concept over the years is that the Law of Matched Trend Timeis unlikely to be true because it implies the market can only be strong for 50 percent of the time. Manycontend that the market goes up “most of the time”. The reconciliation of this conflict centers around thebroad toppy phases of market trends where a positive rate of return may well develop during a sidewaystrading pattern but the rate of return in such shallow advances is no better than the yield on risk-lessTreasury Bills. For this reason the Law of Matched Trend Time is more accurately stated as: “Superiorrates of return (i.e. better than T-Bill rates) can last only as long as the prior period of inferior returns”.A practical example of the Law’s consequence can be seen in the independent study by Nelson Freeburg2in a Technical Analysis of Stocks and Commodities magazine article covering the period from 1957 to1994. Using interest rate information and relative shorting divergences between the Specialist and thePublic (a contrary opinion indicator), Freeburg showed an optimized mutual fund trading strategy justifiedowning mutual funds 51% of the time over the last 37 years. In fact it can be shown that any long termstudy of investment trends that attempts to make superior rates of returns will move towards a 50/50 splitas the Law suggests in order to capture the best returns while avoiding the potential for losses.The Ts are a great help in picturing how this occurs through the analogy of the mirror reversal Isummarized. To provide a clear picture of how this plays out historically let us review the original Ts Idiscovered in the early days.The Original Dow Jones Transport Ts (1956 to 1976)2Nelson Freeburg, A Mutual Fund Switch System, Technical Analysis of Stocks and Commodities, (Vol. 13 Feb 1995)A 1997 Introduction to T Theory Copyright 1997 by Terry LaundryPage 2
The simple symmetric Ts in the monthly Transportation bar chart below illustrate the way in which theLaw of Matched Trend Time could be used to interpret trends. This chart is taken from my earlypublication and has become somewhat faded with time so I have reproduced the chart’s original 1977 text.Chart Text: The most powerful yet easy to understand example of the Law of Matched Trend Time are the so called DOWJONES TRANSPORTATION Ts shown above. These Ts illustrate the basic principle of Magic T Theory that when themarket has made an important bottom it will rally only as many months as it had previously declined. For example the firstT centered in 1957 states that after a 20 month decline the next advance will last a matching 20 months, terminating at theT’s right end. In time, the next T is formed and the sequence repeats through history. For convenience the small Ts areidentified by letters A to H. At less frequent intervals very much larger Ts appear when successive highs form a declining topspattern as seen in 1962. Such Ts are of the utmost importance since they forecast major stock market sell points (i.e. 1968,1972). Such Ts are identified by the year of the major low at the center of the T.These simplest examples of the T concept illustrate properties of all Ts, including the modern examples,which should be kept in mind. The T concept only requires the time duration of the advance to match theprior decline time; it places no restriction on the magnitude of the rise or the duration of the originaldecline. So for example in the Transport Ts chart the number of months the Transports have declined to alow is pretty much a random number over a very long period of time. It is for this reason that the timesymmetry of the T has been lost in a history of random length declines.However it is my opinion that the real reason the T’s presence has been lost is that investors simply cannot make the connection between the bullish trend and its opposite counterpart, the prior bear market. Thisclosely parallels the “contrary opinion” approach to investing in which one sees opportunities in sold outmarkets only when investor sentiment has turned extremely negative. I have found it helpful to think of theT in contrary opinion terms and it may prove helpful to you as well.From a practical standpoint the big T with its center post Low in 1962 illustrates why investors and traders,particularly those who follow trends from a conventional technical approach so often miss out on theopportunities. For the purposes of illustration consider you might be interested in investing intransportation stocks during 1962. The recent history up to then would have been disappointing with theA 1997 Introduction to T Theory Copyright 1997 by Terry LaundryPage 3
averages tracing out a 75 month descending tops pattern from the 1956 high. A fundamentally orientedinvestor could have seen some merit in this situation because the price cap coupled with earnings growthcould lead to attractive values by 1962. But most people would consider the trend a “loser” and pass upthe opportunity.From the Magic T viewpoint, we would tend to ally ourselves with the value investor in the left side of the Twhere we specifically define any descending tops pattern as a “Cash Buildup Phase”. During this periodwe assume investors are shunning the equity investment and putting their assets into cash alternatives likeTreasury Bills, etc. As a consequence I interpret long cash buildups as potentially more profitable becausemore cash reserves could be developing and, through the Theory of Matched Trend Time, we wouldanticipate the next bull market could last a long time, perhaps becoming greater in magnitude as the cashreserves build steadily higher over time.All this might seem straightforward when you review the Transport T history but in real time investorsoften fail to grasp the fact that restraint of the market’s natural rising trend for a long period of time createstremendous opportunities. In the real world the natural build up is for pessimism, not awareness of cash,and over time it dominates the thinking in a negative way.A second factor that limits profitability for many is the suddenness of the stampede that develops as thenew T gets under way. Often the sharpness of the initial advance, as all that cash buildup tries to get intothe market, is viewed as a reason to get out of an “over bought” situation. The Ts I have presented abovemake it quite clear that once a new bull market has started it is much wiser to be patiently bullish for theequal time projected by the T in order to capture the major profit opportunity. Keeping the full right timespan of these Ts in mind is also important because it helps protect against the sudden appearance of thenew bear market which the chart shows is likely to begin as the Law of Matched Trend Time expires at thefinal top.I leave it you to study all the examples in this study to see for your self how the symmetry of the T canalter your thinking about investments but from my experience it is wise to keep the following in mindgenerally:Remember: The greatest profit opportunities come at the end of the longer cash buildupsand you must manage your affairs to be mentally ready, and financially healthy so as to be100% invested at this key jun
I believe that T Theory’s major contribution will be to show you why it will always be difficult to buy at major lows, but using its reasoning you may be able to overcome these obstacles. At each and every great buying point you must struggle at the “moment of truth” where you face seemingly overwhelming negative odds. In T Theory this moment of truth is called “The center post of the T”. It represents the