Transcription
Lab 2D: Separation of a Mixtureby Paper ChromatographyName:Group Members:Due Date:Block://2019Date:Drop Date:CriteriaObjective: Clearly states the aim of the experiment, written in your own wordsand briefly outlines the related theory.Procedure: correctly references textbook or handout making notes of anychanges.Flow Chart: a visual representation of the procedure, to be completed before thelab!Pre-Lab Questions: displays a critical understanding of the background theory.Data, Results & Calculations: (hand written neatly)Provides results/observations (and diagrams where appropriate) that arepresented in correctly annotated tables and/or graphs. Scientific tables & graphsare numbered (eg Table 1: or Graph 1 ) and include descriptive titles.(Table /10 Questions: #1 /4#2 /2 #3 /2)Follow-up Questions:Correctly identifies and explains the theory relating to the experiment andsupports this with accurate observations, data and/or calculations.Conclusion:Identifies and defines important concepts and principles relevant to theexperiment by relating back to the objective and hypothesis. Be sure to addressthe points listed in the lab handout when answering the conclusion.Presentation:Practical report is presented in the correct format, is written fluently andprovides appropriate section headings and accurate referencing. Tables &graphs have numbered headings. Data & calculations may be hand written,however the remainder of the report is to be word-processed.Safety: (teacher assessed during practical lab work)Arrives to class prepared with pre-lab complete. Demonstrates an organized andsafe approach to experimental work & meticulously executed methodology to ahigh degree of accuracy.Punctuality:Report is submitted in full on the due date. (-1 per day until drop date)Results SummaryStudent 3/3/2/2/3/3/5/5/50/50We will be doing the lab on . In order to be ready to go, you need to complete thefollowing sections of your lab report: Objective Flow Chart Pre-Lab Questions Data & Observations: Draw & set-up Table 1 into your lab notebook (leave lots of space to write andperform calculations).
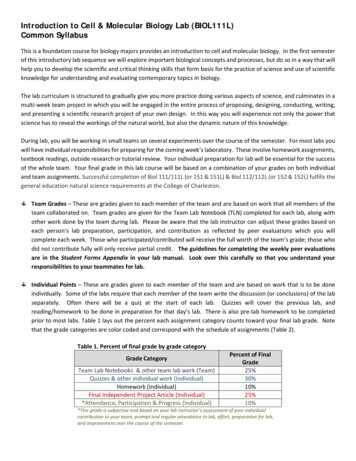
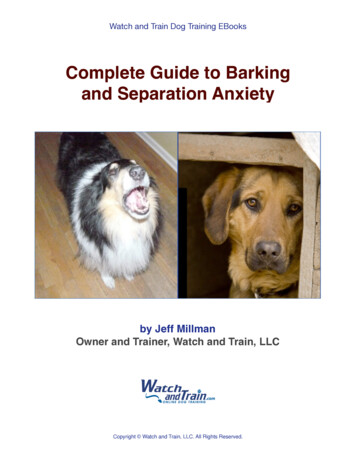
Background Information:Food dyes have been used extensively for more than 100 years. Would you eat maraschino cherries ifthey were their natural color of beige instead of red? In this laboratory experiment you will explore theproperties of artificial food dyes with this chromatography activity.The use of color additives increased dramatically in the United States in the second half of the nineteenthcentury. As the economy became more industrial, fewer people lived on farms, city populations grew, andpeople became more dependent on mass produced foods.Food dyes were initially used to make food more visually appealing to the consumer and, in some cases,to mask poor-quality, inferior, or imitation foods. For example, meat was colored to appear fresh longafter it would have naturally turned brown. Jams and jellies were colored to give the impression of higherfruit content than they actually contained. Some food was colored to look like something else—imitationcrab meat, for example. Many food colorings and additives were later discovered to be harmful or toxic.Food colorants were initialy added to food with little or no health testing. In 1907, the USDA reduced thenumber of synthetic food dyes approved for use from 695 to just seven. Only two of the original dyesfrom 1907 are still accepted for use today. Five others have been added between 1907 and 1971. Onlyseven dyes are approved for use in the United States today. All of the FD&C approved food dyes arecharged, water-soluble organic compounds that bind to natural ionic and polar sites in large foodmolecules, including proteins and carbohydrates.Food dyes can be separated and identified by paper chromatography. Paperchromatography is an example of a more general type of chromatography calledadsorption chromatography. The paper acts as an adsorbent, a solid which iscapable of attracting and binding the components in a mixture (see Figure 1). Themixture to be separated is “spotted” onto the surface of the paper and a solvent isallowed to seep or flow through the paper by capillary action. If one of thecomponents in the mixture is more strongly adsorbed onto the paper thananother, it will move up the paper more slowly than the solvent. Components thatare not strongly adsorbed onto the paper will move up the paper at a faster rate.This “partitioning” of the components of a mixture between the paper and thesolvent separates the components and gives rise to different bands or spots. If the components of themixture are colored, like food dyes or pigments in an ink, the colored bands are easily distinguished.The distance a sample moves along the chromatography paper is compared to the overall distance thesolvent travels—this ratio is called the Rf or rate of flow. In general, food dye molecules that are morehighly charged, that is, have more ionic binding sites and are more polar, will be attracted to the papermore strongly and will have lower Rf values. (Flinn Scientific, 2016)The Wilton Food Company uses FD&C approved food dyes in highly concentrated forms theiricing colour dyes. Table 1 shows a list of icing colours and which FD&C dyes they contain.Table 1: FD&C approved food dyes contained in Wilton Gel Icing ColoursIcing ColourFD&C DyeIcing ColourFD&C DyeIcing ColourFD&C DyeLemon YellowYellow #5PinkRed #3Royal BlueBlue #1Golden YellowYellow #5Red (no-taste)Red #40Kelly GreenYellow #5Yellow #6Yellow #5Red #3Blue #12
Objective: (to be typed and added to formal report)Flow Chart: Summarize the steps that you will follow in the lab. You will find this information on theattached pages, which give the “procedure” for the lab. These steps should be VERY simple, and easy tofollow. You will not be permitted to carry books, and binders to your lab bench. So imagine the lab is notbeside you. You will require THIS FLOW CHART to see what steps will follow.An example flow chart is shown below.Note: your flow chart may include diagrams/pictures; should include measurements & amounts required.Put on safety glassesMeasure 50mL waterThird step here.etc.Pre-lab Questions: (to be answered in full sentences)Carefully read the pre-lab discussion, and the procedure BASED ON Heath Chemistry page 24-29. Thesepages are attached for reference & include supplementary information you may find helpful.1. What is chromatography used for?2. What differences allow substances to be separated using chromatography?3. What two features are shared by all forms of chromatography? In paperchromatography, what comprises these features?4. Why do some components travel further than others during a chromatogram?5. What does Rf stand for? How is it calculated?6. What range is possible for Rf values? What unit does it have?7. Two chemists perform a chromatography procedure on the same substance and get quitedifferent Rf values. How is this possible?8. Would paper chromatography be suitable for separating large amounts of mixtures?Explain.Materials:Apparatus 600 mL beakerLarge filter paper(chromatography paper)25 mL measuringcylinder50 mL beakerReagents Disposable pipetteFunnelPencilRulerscissors Set of Winton FoodDyesEthanolsolution3
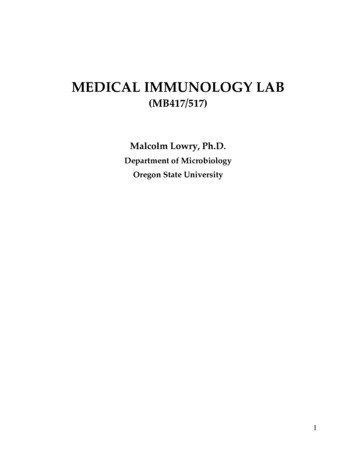
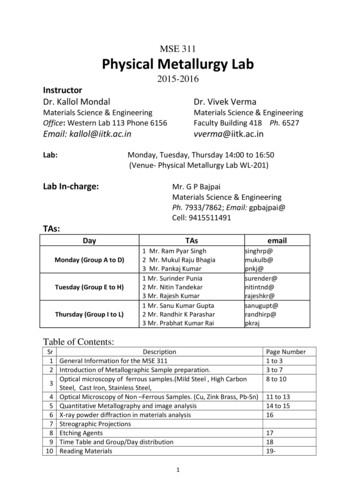
Procedure: This lab is an excerpt from Heath Chemistry, a textbook of laboratory experiments.Information regarding the lab and detailed procedure are provided on the following pages.1. Obtain a circular piece of filter paper. Fold and cut to make an approx 20cm by 12cm piece ofchromatography paper. 1cm from the bottom edge draw a pencil line along the long axis ofthe paper. Starting 1cm from the left side, make pencil marks every 2cm. Label the first sevenspots as shown. Label the last spots as shown. Label the last spots with the unknowns you aregoing to test in the lab.LYGYPRBG(2 x Unknowns)2. Lightly curl the paper by running it over the edge of a table so that the paper can stand up by itself.3. Using a toothpick, place a 1mm spot of the known food dyes on their respective mark. Similarly,spot the remaining 2 marks with your chosen "unknowns" being analyzed.4. Form the chromatography paper into a loose cylinder so that it doesn't touch itself and staple!5. Lower the paper into the beaker, taking care not to allow any contact between the paper and thesides of the beaker.6. Using a 25mL measuring cylinder, measure out 30 mL of ethanol into a 50mL beaker.7. Pipette about 3mm (approx. 25-30 mL) of the developer mixture (ethanol) into the bottom-centreof the 600mL beaker taking care NOT TO TOUCH THE CHROMATOGRAPHY PAPER!8. Cover the beaker loosely with aluminum foil to reduce evaporation of the developer.9. Leave the beaker for approximately 20 minutes as the chromatogram develops.*NOTE* STEPS #10 #11 MUST BE DONE SIMULTANEOUSLY AND AS QUICKLY AS POSSIBLE!10.Remove the chromatogram from the beaker and carefully remove the staples. Lie flat to dry on asheet of paper (be sure to mark with your group names).11.Using pencil, IMMEDIATELY mark specific points on the chromatogram! Mark the top edge of each spot The position of the developer front above the spot If a sample has separated into more than one component, mark the top of eachcomponent.4
12.Make a data table in your notebook using the following headings. For samples that have more thanone component, make a data table entry for each component.Table ce: d1(cm)SoluteDistance: d2(cm)𝑅𝑅𝑓𝑓 ��𝑑𝑑𝑑 𝑜𝑜𝑜𝑜 𝑠𝑠𝑠𝑠𝑠𝑠𝑠𝑠𝑠𝑠𝑠𝑠 𝑑𝑑𝑑𝑑𝑑𝑑𝑑𝑑𝑑𝑑 𝑜𝑜𝑜𝑜 ��𝑠 (𝑐𝑐𝑐𝑐)Rf ownB13.For each sample, measure the distance travelled by the spot (solute) and the distance travelled by thesolvent (ethanol solution). Some samples may have separated into more than one component. In suchcases, measurements are needed for each component. Enter values in the data table.14.For each sample, calculate the ratio of fronts (Rf value) and enter in the table.Safety:NOTE: all data, observations and calculations are to be completed in numbered data tables withappropriate titles.Safety glasses are to be worn at all times, for all experiments!Reagent Disposal: All waste from this lab is to be rinsed down the sink with lots of water. All glasswareused must be washed & rinsed thoroughly in order to be used in following reactions.Clean Up: clean up all materials, wipe lab bench with disinfectant and wash hands well with soap andwater before you leave the lab each day.5
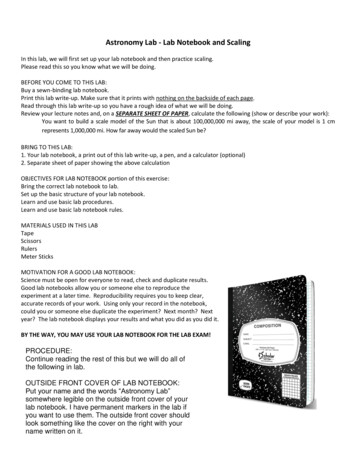
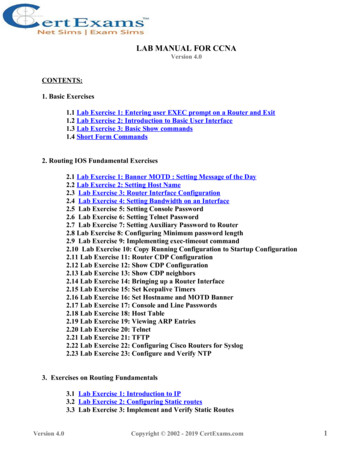
Data, Observations & Calculations:Always give your table a # (example: Table 1) and a descriptive title. Underline the table # and the title.Include: Table #1 - Data for ChromatographyAnswer the following questions in full sentences, giving detailed answers.1. Identify the FD&C food dyes present in each of the 2 unknowns. BE SURE TO: Nameeach clearly & descriptively with the dye and number!2. ls the identity of the unknowns supported by both qualitative & quantitativeobservation? That is, by its appearance & its Rf? Support your answer with your data,observations and calculations.3. In general, how accurate is your analysis? Use table 4 below to compare your resultsto known Rf values for Yellow #5, Yellow #6, Red #3 and Blue #1.Follow Up Q’s1. Identify the dyes that appear on the chromatogram in Figure 2D-5 (Consult Table 4 below for Rf values.) The original sample was orange foodcoloring. (2marks)2. A pharmaceutical chemist runs a chromatography test on a substance andidentifies two of its components by comparing their Rf values againstcertain standards. If the two components have Rf values of 1.0 and 0.41,and the solvent front has travelled 12.0 cm from the sample's origin, whatis the separation distance on the chromatogram? (2marks)3. A chemist performs an Rf calculation, obtains a value of 1.2, and, decidesthat the answer is unacceptable. Why? (1mark)4. In paper chromatography,a. If a molecules is very soluble in the liquid phase, and very nonreactive with the solid phase, how would it migrate? (1mark)b. If a molecules is very insoluble in the liquid phase, and very reactivewith the solid phase, how would it migrate? (1mark)Conclusion:Your conclusion should answer and reflect the objective of your experiment. Briefly summarize yourexperimental results and be sure to discuss any sources of experimental (not human) error.6
Food dyes can be separated and identified by paper chromatography. Paper chromatography is an example of a more general type of chromatography called adsorption chromatography. The paper acts as an adsorbent, a solid which is capable of attracting and binding the components in a mixture (see Figure 1). The