Transcription
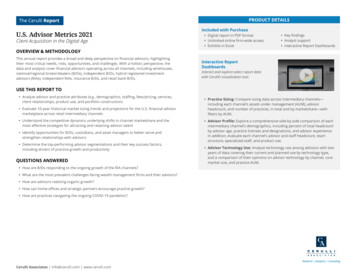
PRODUCT DETAILSU.S. Advisor Metrics 2021Client Acquisition in the Digital AgeIncluded with Purchasey Digital report in PDF formaty Unlimited online firm-wide accessy Exhibits in Excely Key findingsy Analyst supporty Interactive Report DashboardsOVERVIEW & METHODOLOGYThis annual report provides a broad and deep perspective on financial advisors, highlightingtheir most critical needs, risks, opportunities, and challenges. With a holistic perspective, thedata and analysis cover financial advisors operating across all channels, including wirehouses,national/regional broker/dealers (B/Ds), independent B/Ds, hybrid registered investmentadvisors (RIAs), independent RIAs, insurance B/Ds, and retail bank B/Ds.Interactive ReportDashboardsInteract and explore select report datawith Cerulli’s visualization tool.USE THIS REPORT TOy Analyze advisor and practice attributes (e.g., demographics, staffing, fees/pricing, services,client relationships, product use, and portfolio construction)y Evaluate 10-year historical market sizing trends and projections for the U.S. financial advisormarketplace across retail intermediary channelsy Understand the competitive dynamics underlying shifts in channel marketshare and themost effective strategies for attracting and retaining advisor talenty Identify opportunities for B/Ds, custodians, and asset managers to better serve andstrengthen relationships with advisorsy Determine the top-performing advisor segmentations and their key success factors,including drivers of practice growth and productivityQUESTIONS ANSWEREDy How are B/Ds responding to the ongoing growth of the RIA channels?y What are the most prevalent challenges facing wealth management firms and their advisors?y How are advisors realizing organic growth?y How can home offices and strategic partners encourage practice growth?y How are practices navigating the ongoing COVID-19 pandemic?Cerulli Associates info@cerulli.com www.cerulli.comy Practice Sizing: Compare sizing data across intermediary channels—including each channel’s assets under management (AUM), advisorheadcount, and number of practices, in total and by marketshare—withfilters by AUM.y Advisor Profile: Explore a comprehensive side-by-side comparison of eachintermediary channel’s demographics, including percent of total headcountby advisor age, practice licenses and designations, and advisor experience.In addition, evaluate each channel’s advisor and staff headcount, teamstructure, specialized staff, and product use.y Advisor Technology Use: Analyze technology use among advisors with twoyears of data covering their current and planned use by technology type,and a comparison of their opinions on advisor technology by channel, coremarket size, and practice AUM.
Chapter 1Market SizingExhibit 1.04Marketshare of Advisor Headcount and Assets, 2020Sources: Cerulli Associates, Investment Company Institute, Insured Retirement Institute, VARDS, Strategic Insight/SIMFUND, Investment News, Judy Diamond, Department of Labor,PLANSPONSOR, S&P Capital IQ MMD, Financial Planning, Financial Advisor Magazine, Investment Advisor Magazine, and Cerulli Associates, in partnership with the Investments & Wealth Institute,WealthManagement.com, and the Financial Planning Association (FPA )Advisor headcount marketshareAsset % 10.7%13.1%15.1%8.4%7.0%4.1%WirehouseNational andregional B/DIBDHybrid RIAIndependent RIAInsurance B/DRetail bank B/D Although wirehouses employ just 15% of all advisors, they control a disproportionate 34% of advisor-managed assets. Conversely, 19% of advisors areaffiliated with an insurance B/D, but the channel accounts for just 4% of total assets, making them the least productive advisors in the industry. Only 8% of all advisors are in the retail bank B/D channel and in total, they manage 7% of asset marketshare. Bank B/Ds primarily work with massmarket retail clients, employ younger less experienced advisors, and often struggle to promote and cross-pollinate established banking relationships totheir wealth management services.30The Cerulli Report U.S. Advisor Metrics 2021
Table of ContentsTable of Contents: ExpandedMethodology . . . . . . . . . . . . . . . . . . . . . . . . . . . . . . . . . . . . . . . . . . . . . . . . . . . . . . . . . . . . . . . . . . . . . . . . . . . . . . . . . . . . 16Executive Summary . . . . . . . . . . . . . . . . . . . . . . . . . . . . . . . . . . . . . . . . . . . . . . . . . . . . . . . . . . . . . . . . . . . . . . . . . . . . . . 19Report Authors . . . . . . . . . . . . . . . . . . . . . . . . . . . . . . . . . . . . . . . . . . . . . . . . . . . . . . . . . . . . . . . . . . . . . . . . . . . . . . . . . . 22Chapter 1: Market Sizing . . . . . . . . . . . . . . . . . . . . . . . . . . . . . . . . . . . . . . . . . . . . . . . . . . . . . . . . . . . . . . . . . . . . . . . . . . 23Channel SizingExhibit 1.01. Assets by Intermediary Segment, 2015–2020 . . . . . . . . . . . . . . . . . . . . . . . . . . . . . . . . . . . . . . . . . . . . . . . . . . . . . . . . . . . . . . . . . 25Exhibit 1.02 - Part 1. Description of Advisor Channels, 2021 . . . . . . . . . . . . . . . . . . . . . . . . . . . . . . . . . . . . . . . . . . . . . . . . . . . . . . . . . . . . . . . . 26Exhibit 1.02 - Part 2. Description of Advisor Channels, 2021 . . . . . . . . . . . . . . . . . . . . . . . . . . . . . . . . . . . . . . . . . . . . . . . . . . . . . . . . . . . . . . . . 27Exhibit 1.03 - Part 1. Overview of Advisor Channels, 2020 . . . . . . . . . . . . . . . . . . . . . . . . . . . . . . . . . . . . . . . . . . . . . . . . . . . . . . . . . . . . . . . . . . 28Exhibit 1.03 - Part 2. Overview of Advisor Channels, 2020 . . . . . . . . . . . . . . . . . . . . . . . . . . . . . . . . . . . . . . . . . . . . . . . . . . . . . . . . . . . . . . . . . . 29Exhibit 1.04. Marketshare of Advisor Headcount and Assets, 2020 . . . . . . . . . . . . . . . . . . . . . . . . . . . . . . . . . . . . . . . . . . . . . . . . . . . . . . . . . . 30Exhibit 1.05. Advisor Headcount, 2010–2020 . . . . . . . . . . . . . . . . . . . . . . . . . . . . . . . . . . . . . . . . . . . . . . . . . . . . . . . . . . . . . . . . . . . . . . . . . . . . . 31Exhibit 1.06. Advisor Headcount Marketshare, 2010–2020 . . . . . . . . . . . . . . . . . . . . . . . . . . . . . . . . . . . . . . . . . . . . . . . . . . . . . . . . . . . . . . . . . 32Exhibit 1.07. Advisor-Managed Assets, 2010–2020 . . . . . . . . . . . . . . . . . . . . . . . . . . . . . . . . . . . . . . . . . . . . . . . . . . . . . . . . . . . . . . . . . . . . . . . . 33Exhibit 1.08. Advisor-Managed Asset Marketshare, 2010–2020 . . . . . . . . . . . . . . . . . . . . . . . . . . . . . . . . . . . . . . . . . . . . . . . . . . . . . . . . . . . . . 34Exhibit 1.09. Advisor Productivity, 2010–2020 . . . . . . . . . . . . . . . . . . . . . . . . . . . . . . . . . . . . . . . . . . . . . . . . . . . . . . . . . . . . . . . . . . . . . . . . . . . . 35Exhibit 1.10. Advisor Productivity Index (PX), 2010–2020 . . . . . . . . . . . . . . . . . . . . . . . . . . . . . . . . . . . . . . . . . . . . . . . . . . . . . . . . . . . . . . . . . . . 36Channel ProjectionsExhibit 1.11. Projected Advisor Headcount, 2020–2025E . . . . . . . . . . . . . . . . . . . . . . . . . . . . . . . . . . . . . . . . . . . . . . . . . . . . . . . . . . . . . . . . . . . 37Exhibit 1.12. Projected Advisor Headcount Marketshare, 2020–2025E . . . . . . . . . . . . . . . . . . . . . . . . . . . . . . . . . . . . . . . . . . . . . . . . . . . . . . . 38Exhibit 1.13. Projected Asset Marketshare, 2020–2025E . . . . . . . . . . . . . . . . . . . . . . . . . . . . . . . . . . . . . . . . . . . . . . . . . . . . . . . . . . . . . . . . . . . 39Practice SizingExhibit 1.14. Number of Practices, 2015–2020 . . . . . . . . . . . . . . . . . . . . . . . . . . . . . . . . . . . . . . . . . . . . . . . . . . . . . . . . . . . . . . . . . . . . . . . . . . . . 40Exhibit 1.15. Number of Advisors per Practice, 2015–2020 . . . . . . . . . . . . . . . . . . . . . . . . . . . . . . . . . . . . . . . . . . . . . . . . . . . . . . . . . . . . . . . . . 41Exhibit 1.16 - Part 1. Practice Sizing by Practice AUM, 2020 . . . . . . . . . . . . . . . . . . . . . . . . . . . . . . . . . . . . . . . . . . . . . . . . . . . . . . . . . . . . . . . . . 42Exhibit 1.16 - Part 2. Practice Sizing by Practice AUM Databank, 2020 . . . . . . . . . . . . . . . . . . . . . . . . . . . . . . . . . . . . . . . . . . . . . . . . . . . . . . . . 43Exhibit 1.17 - Part 1. Practice Sizing by Channel, 2020 . . . . . . . . . . . . . . . . . . . . . . . . . . . . . . . . . . . . . . . . . . . . . . . . . . . . . . . . . . . . . . . . . . . . . 449The Cerulli Report U.S. Advisor Metrics 2021
Table of ContentsExhibit 1.17 - Part 2. Practice Sizing by Channel Databank, 2020 . . . . . . . . . . . . . . . . . . . . . . . . . . . . . . . . . . . . . . . . . . . . . . . . . . . . . . . . . . . . 45Exhibit 1.18 - Part 1. Wirehouse Practice Sizing, 2015–2020 . . . . . . . . . . . . . . . . . . . . . . . . . . . . . . . . . . . . . . . . . . . . . . . . . . . . . . . . . . . . . . . . 46Exhibit 1.18 - Part 2. Wirehouse Practice Sizing Databank, 2015–2020 . . . . . . . . . . . . . . . . . . . . . . . . . . . . . . . . . . . . . . . . . . . . . . . . . . . . . . . 47Exhibit 1.19 - Part 1. National and Regional B/D Practice Sizing, 2015–2020 . . . . . . . . . . . . . . . . . . . . . . . . . . . . . . . . . . . . . . . . . . . . . . . . . . . 48Exhibit 1.19 - Part 2. National and Regional B/D Practice Sizing Databank, 2015–2020 . . . . . . . . . . . . . . . . . . . . . . . . . . . . . . . . . . . . . . . . . . 49Exhibit 1.20 - Part 1. IBD Practice Sizing, 2015–2020 . . . . . . . . . . . . . . . . . . . . . . . . . . . . . . . . . . . . . . . . . . . . . . . . . . . . . . . . . . . . . . . . . . . . . . . 50Exhibit 1.20 - Part 2. IBD Practice Sizing Databank, 2015–2020 . . . . . . . . . . . . . . . . . . . . . . . . . . . . . . . . . . . . . . . . . . . . . . . . . . . . . . . . . . . . . . 51Exhibit 1.21 - Part 1. Hybrid RIA Firm Sizing, 2015–2020 . . . . . . . . . . . . . . . . . . . . . . . . . . . . . . . . . . . . . . . . . . . . . . . . . . . . . . . . . . . . . . . . . . . . 52Exhibit 1.21 - Part 2. Hybrid RIA Firm Sizing Databank, 2015–2020 . . . . . . . . . . . . . . . . . . . . . . . . . . . . . . . . . . . . . . . . . . . . . . . . . . . . . . . . . . 53Exhibit 1.22 - Part 1. Independent RIA Firm Sizing, 2015–2020 . . . . . . . . . . . . . . . . . . . . . . . . . . . . . . . . . . . . . . . . . . . . . . . . . . . . . . . . . . . . . . 54Exhibit 1.22 - Part 2. Independent RIA Firm Sizing Databank, 2015–2020 . . . . . . . . . . . . . . . . . . . . . . . . . . . . . . . . . . . . . . . . . . . . . . . . . . . . . 55Exhibit 1.23. Retail Bank B/D Practice Sizing, 2015–2020 . . . . . . . . . . . . . . . . . . . . . . . . . . . . . . . . . . . . . . . . . . . . . . . . . . . . . . . . . . . . . . . . . . . 56Exhibit 1.24. Insurance B/D Practice Sizing, 2015–2020 . . . . . . . . . . . . . . . . . . . . . . . . . . . . . . . . . . . . . . . . . . . . . . . . . . . . . . . . . . . . . . . . . . . . 57Chapter 2: Practice Attributes . . . . . . . . . . . . . . . . . . . . . . . . . . . . . . . . . . . . . . . . . . . . . . . . . . . . . . . . . . . . . . . . . . . . . 58Advisor DemographicsExhibit 2.01. Advisor Demographics Dashboard, 2021 . . . . . . . . . . . . . . . . . . . . . . . . . . . . . . . . . . . . . . . . . . . . . . . . . . . . . . . . . . . . . . . . . . . . . 59Exhibit 2.02 - Part 1. Advisor Age by Channel Databank, 2020 . . . . . . . . . . . . . . . . . . . . . . . . . . . . . . . . . . . . . . . . . . . . . . . . . . . . . . . . . . . . . . 60Exhibit 2.02 - Part 2. Advisor Age by Channel Databank, 2020 . . . . . . . . . . . . . . . . . . . . . . . . . . . . . . . . . . . . . . . . . . . . . . . . . . . . . . . . . . . . . . 61Exhibit 2.03 - Part 1. Advisor Age by Practice AUM Databank, 2020 . . . . . . . . . . . . . . . . . . . . . . . . . . . . . . . . . . . . . . . . . . . . . . . . . . . . . . . . . . 62Exhibit 2.03 - Part 2. Advisor Age by Practice AUM Databank, 2020 . . . . . . . . . . . . . . . . . . . . . . . . . . . . . . . . . . . . . . . . . . . . . . . . . . . . . . . . . . 63Exhibit 2.04 - Part 1. Advisor Experience Databank, 2021 . . . . . . . . . . . . . . . . . . . . . . . . . . . . . . . . . . . . . . . . . . . . . . . . . . . . . . . . . . . . . . . . . . 64Exhibit 2.04 - Part 2. Advisor Experience Databank, 2021 . . . . . . . . . . . . . . . . . . . . . . . . . . . . . . . . . . . . . . . . . . . . . . . . . . . . . . . . . . . . . . . . . . 65Exhibit 2.05 - Part 1. Advisor Tenure Databank, 2021 . . . . . . . . . . . . . . . . . . . . . . . . . . . . . . . . . . . . . . . . . . . . . . . . . . . . . . . . . . . . . . . . . . . . . . 66Exhibit 2.05 - Part 2. Advisor Tenure Databank, 2021 . . . . . . . . . . . . . . . . . . . . . . . . . . . . . . . . . . . . . . . . . . . . . . . . . . . . . . . . . . . . . . . . . . . . . . 67Exhibit 2.06. Advisor Gender, 2020 . . . . . . . . . . . . . . . . . . . . . . . . . . . . . . . . . . . . . . . . . . . . . . . . . . . . . . . . . . . . . . . . . . . . . . . . . . . . . . . . . . . . . 68Exhibit 2.07. Advisor Gender Databank, 2020 . . . . . . . . . . . . . . . . . . . . . . . . . . . . . . . . . . . . . . . . . . . . . . . . . . . . . . . . . . . . . . . . . . . . . . . . . . . . 69Exhibit 2.08. Advisor Race and Ethnicity, 2020 . . . . . . . . . . . . . . . . . . . . . . . . . . . . . . . . . . . . . . . . . . . . . . . . . . . . . . . . . . . . . . . . . . . . . . . . . . . . 70Exhibit 2.09. Advisor Race and Ethnicity Databank, 2020 . . . . . . . . . . . . . . . . . . . . . . . . . . . . . . . . . . . . . . . . . . . . . . . . . . . . . . . . . . . . . . . . . . . 71Exhibit 2.10. Practice Licenses and Designations, 2021 . . . . . . . . . . . . . . . . . . . . . . . . . . . . . . . . . . . . . . . . . . . . . . . . . . . . . . . . . . . . . . . . . . . . 72Exhibit 2.11 - Part 1. Practice Licenses and Designations Databank, 2021 . . . . . . . . . . . . . . . . . . . . . . . . . . . . . . . . . . . . . . . . . . . . . . . . . . . . 73Exhibit 2.11 - Part 2. Practice Licenses and Designations Databank, 2021 . . . . . . . . . . . . . . . . . . . . . . . . . . . . . . . . . . . . . . . . . . . . . . . . . . . . 7410The Cerulli Report U.S. Advisor Metrics 2021
Table of ContentsProductivityExhibit 2.12. Time Allocation, 2021 . . . . . . . . . . . . . . . . . . . . . . . . . . . . . . . . . . . . . . . . . . . . . . . . . . . . . . . . . . . . . . . . . . . . . . . . . . . . . . . . . . . . . 75Exhibit 2.13. Time Allocation Databank, 2021 . . . . . . . . . . . . . . . . . . . . . . . . . . . . . . . . . . . . . . . . . . . . . . . . . . . . . . . . . . . . . . . . . . . . . . . . . . . . 76Exhibit 2.14. Advisor Productivity Challenges, 2021 . . . . . . . . . . . . . . . . . . . . . . . . . . . . . . . . . . . . . . . . . . . . . . . . . . . . . . . . . . . . . . . . . . . . . . . 77Exhibit 2.15. Practice Management Support Dashboard, 2021 . . . . . . . . . . . . . . . . . . . . . . . . . . . . . . . . . . . . . . . . . . . . . . . . . . . . . . . . . . . . . . 78TechnologyExhibit 2.16. Advisor Technology Use, 2021 . . . . . . . . . . . . . . . . . . . . . . . . . . . . . . . . . . . . . . . . . . . . . . . . . . . . . . . . . . . . . . . . . . . . . . . . . . . . . . 79Exhibit 2.17 - Part 1. Advisor Technology Use Databank, 2021 . . . . . . . . . . . . . . . . . . . . . . . . . . . . . . . . . . . . . . . . . . . . . . . . . . . . . . . . . . . . . . 80Exhibit 2.17 - Part 2. Advisor Technology Use Databank, 2021 . . . . . . . . . . . . . . . . . . . . . . . . . . . . . . . . . . . . . . . . . . . . . . . . . . . . . . . . . . . . . . 81Exhibit 2.18. Opinions on Advisor Technology, 2021 . . . . . . . . . . . . . . . . . . . . . . . . . . . . . . . . . . . . . . . . . . . . . . . . . . . . . . . . . . . . . . . . . . . . . . . 82Exhibit 2.19. Opinions on Advisor Technology Databank, 2021 . . . . . . . . . . . . . . . . . . . . . . . . . . . . . . . . . . . . . . . . . . . . . . . . . . . . . . . . . . . . . 83Exhibit 2.20. Advisor Technology Challenges, 2021 . . . . . . . . . . . . . . . . . . . . . . . . . . . . . . . . . . . . . . . . . . . . . . . . . . . . . . . . . . . . . . . . . . . . . . . . 84Exhibit 2.21. Advisor Technology Challenges Databank, 2021 . . . . . . . . . . . . . . . . . . . . . . . . . . . . . . . . . . . . . . . . . . . . . . . . . . . . . . . . . . . . . . . 85TeamsExhibit 2.22. Advisor and Staff Headcount Dashboard, 2021 . . . . . . . . . . . . . . . . . . . . . . . . . . . . . . . . . . . . . . . . . . . . . . . . . . . . . . . . . . . . . . . 86Exhibit 2.23 - Part 1. Advisor and Staff Headcount Databank, 2021 . . . . . . . . . . . . . . . . . . . . . . . . . . . . . . . . . . . . . . . . . . . . . . . . . . . . . . . . . . 87Exhibit 2.23 - Part 2. Advisor and Staff Headcount Databank, 2021 . . . . . . . . . . . . . . . . . . . . . . . . . . . . . . . . . . . . . . . . . . . . . . . . . . . . . . . . . . 88Exhibit 2.23 - Part 3. Advisor and Staff Headcount Databank, 2021 . . . . . . . . . . . . . . . . . . . . . . . . . . . . . . . . . . . . . . . . . . . . . . . . . . . . . . . . . . 89Exhibit 2.24. Teaming Dashboard, 2021 . . . . . . . . . . . . . . . . . . . . . . . . . . . . . . . . . . . . . . . . . . . . . . . . . . . . . . . . . . . . . . . . . . . . . . . . . . . . . . . . . 90Exhibit 2.25 - Part 1. Team Structure Databank, 2021 . . . . . . . . . . . . . . . . . . . . . . . . . . . . . . . . . . . . . . . . . . . . . . . . . . . . . . . . . . . . . . . . . . . . . . 91Exhibit 2.25 - Part 2. Specialized Staff Databank, 2021 . . . . . . . . . . . . . . . . . . . . . . . . . . . . . . . . . . . . . . . . . . . . . . . . . . . . . . . . . . . . . . . . . . . . . 92Exhibit 2.26. Human Capital Challenges, 2021 . . . . . . . . . . . . . . . . . . . . . . . . . . . . . . . . . . . . . . . . . . . . . . . . . . . . . . . . . . . . . . . . . . . . . . . . . . . . 93Chapter 3: Service Offerings . . . . . . . . . . . . . . . . . . . . . . . . . . . . . . . . . . . . . . . . . . . . . . . . . . . . . . . . . . . . . . . . . . . . . . 94Services OverviewExhibit 3.01. Number of Services Offered, 2021 . . . . . . . . . . . . . . . . . . . . . . . . . . . . . . . . . . . . . . . . . . . . . . . . . . . . . . . . . . . . . . . . . . . . . . . . . . 95Exhibit 3.02. Financial Planning Services, 2021 . . . . . . . . . . . . . . . . . . . . . . . . . . . . . . . . . . . . . . . . . . . . . . . . . . . . . . . . . . . . . . . . . . . . . . . . . . . 96Exhibit 3.03. Financial Planning Services Databank, 2021 . . . . . . . . . . . . . . . . . . . . . . . . . . . . . . . . . . . . . . . . . . . . . . . . . . . . . . . . . . . . . . . . . . 97Exhibit 3.04. Advanced Planning Services, 2021 . . . . . . . . . . . . . . . . . . . . . . . . . . . . . . . . . . . . . . . . . . . . . . . . . . . . . . . . . . . . . . . . . . . . . . . . . . . 98Exhibit 3.05. Advanced Planning Services Databank, 2021 . . . . . . . . . . . . . . . . . . . . . . . . . . . . . . . . . . . . . . . . . . . . . . . . . . . . . . . . . . . . . . . . . 99Exhibit 3.06. Digital Advice Strategies, 2021 . . . . . . . . . . . . . . . . . . . . . . . . . . . . . . . . . . . . . . . . . . . . . . . . . . . . . . . . . . . . . . . . . . . . . . . . . . . . 100Practice TypeExhibit 3.07. Practice Type Overview, 2020 . . . . . . . . . . . . . . . . . . . . . . . . . . . . . . . . . . . . . . . . . . . . . . . . . . . . . . . . . . . . . . . . . . . . . . . . . . . . . 10111The Cerulli Report U.S. Advisor Metrics 2021
Table of ContentsExhibit 3.08. Practice Type Sizing, 2020 . . . . . . . . . . . . . . . . . . . . . . . . . . . . . . . . . . . . . . . . . . . . . . . . . . . . . . . . . . . . . . . . . . . . . . . . . . . . . . . . 102Exhibit 3.09. Practice Type Sizing Databank, 2020 . . . . . . . . . . . . . . . . . . . . . . . . . . . . . . . . . . . . . . . . . . . . . . . . . . . . . . . . . . . . . . . . . . . . . . . 103Exhibit 3.10. Perceived vs. Actual Practice Type, 2020 . . . . . . . . . . . . . . . . . . . . . . . . . . . . . . . . . . . . . . . . . . . . . . . . . . . . . . . . . . . . . . . . . . . 104Financial PlanningExhibit 3.11. Financial Planning Clients, 2021 vs. 2023E . . . . . . . . . . . . . . . . . . . . . . . . . . . . . . . . . . . . . . . . . . . . . . . . . . . . . . . . . . . . . . . . . . 105Exhibit 3.12. Financial Planning Clients Databank, 2021 vs. 2023E . . . . . . . . . . . . . . . . . . . . . . . . . . . . . . . . . . . . . . . . . . . . . . . . . . . . . . . . . 106Retirement PlansExhibit 3.13. DC-Focused Advisor Headcount and Marketshare, 2020 . . . . . . . . . . . . . . . . . . . . . . . . . . . . . . . . . . . . . . . . . . . . . . . . . . . . . . 107Exhibit 3.14. Retirement Specialist Advisors: Plan Participant Questions, 2021 . . . . . . . . . . . . . . . . . . . . . . . . . . . . . . . . . . . . . . . . . . . . . . 108Exhibit 3.15. Retirement Specialist Advisors: Perspectives on IRA Rollovers from DC Plans, 2021 . . . . . . . . . . . . . . . . . . . . . . . . . . . . . . 109Exhibit 3.16. 401(k) Plan Participants: Factors Considered in IRA Rollover Decision, 2021 . . . . . . . . . . . . . . . . . . . . . . . . . . . . . . . . . . . . . 110InstitutionalExhibit 3.17. Advisors with Institutional Clients, 2021 . . . . . . . . . . . . . . . . . . . . . . . . . . . . . . . . . . . . . . . . . . . . . . . . . . . . . . . . . . . . . . . . . . . . 111Exhibit 3.18. Advisors with Institutional Clients Databank, 2021 . . . . . . . . . . . . . . . . . . . . . . . . . . . . . . . . . . . . . . . . . . . . . . . . . . . . . . . . . . . 112Chapter 4: Client Relationships . . . . . . . . . . . . . . . . . . . . . . . . . . . . . . . . . . . . . . . . . . . . . . . . . . . . . . . . . . . . . . . . . . . 113Advisor Client ProfileExhibit 4.01. Household and Asset Distribution, 2020E . . . . . . . . . . . . . . . . . . . . . . . . . . . . . . . . . . . . . . . . . . . . . . . . . . . . . . . . . . . . . . . . . . 114Exhibit 4.02. Core Market, 2021 . . . . . . . . . . . . . . . . . . . . . . . . . . . . . . . . . . . . . . . . . . . . . . . . . . . . . . . . . . . . . . . . . . . . . . . . . . . . . . . . . . . . . . 115Exhibit 4.03. Core Market Databank, 2021 . . . . . . . . . . . . . . . . . . . . . . . . . . . . . . . . . . . . . . . . . . . . . . . . . . . . . . . . . . . . . . . . . . . . . . . . . . . . . 116Exhibit 4.04. Client Age, 2021 . . . . . . . . . . . . . . . . . . . . . . . . . . . . . . . . . . . . . . . . . . . . . . . . . . . . . . . . . . . . . . . . . . . . . . . . . . . . . . . . . . . . . . . . 117Exhibit 4.05. Client Age Databank, 2021 . . . . . . . . . . . . . . . . . . . . . . . . . . . . . . . . . . . . . . . . . . . . . . . . . . . . . . . . . . . . . . . . . . . . . . . . . . . . . . . 118Exhibit 4.06. Women Primary Client Contacts, 2021 . . . . . . . . . . . . . . . . . . . . . . . . . . . . . . . . . . . . . . . . . . . . . . . . . . . . . . . . . . . . . . . . . . . . . 119Exhibit 4.07. Women Primary Client Contacts Databank, 2021 . . . . . . . . . . . . . . . . . . . . . . . . . . . . . . . . . . . . . . . . . . . . . . . . . . . . . . . . . . . . 120Client RelationshipsExhibit 4.08. Frequency of Client Touchpoints, 2021 . . . . . . . . . . . . . . . . . . . . . . . . . . . . . . . . . . . . . . . . . . . . . . . . . . . . . . . . . . . . . . . . . . . . . 121Exhibit 4.09 - Part 1. Frequency of Client Touchpoints Databank, 2021 . . . . . . . . . . . . . . . . . . . . . . . . . . . . . . . . . . . . . . . . . . . . . . . . . . . . . 122Exhibit 4.09 - Part 2. Frequency of Client Touchpoints Databank, 2021 . . . . . . . . . . . . . . . . . . . . . . . . . . . . . . . . . . . . . . . . . . . . . . . . . . . . . 123Exhibit 4.09 - Part 3. Frequency of Client Touchpoints Databank, 2021 . . . . . . . . . . . . . . . . . . . . . . . . . . . . . . . . . . . . . . . . . . . . . . . . . . . . . 124Exhibit 4.10. Client Coverage Ratios, 2021 . . . . . . . . . . . . . . . . . . . . . . . . . . . . . . . . . . . . . . . . . . . . . . . . . . . . . . . . . . . . . . . . . . . . . . . . . . . . . 125Exhibit 4.11 - Part 1. Client Coverage Ratios Databank, 2021 . . . . . . . . . . . . . . . . . . . . . . . . . . . . . . . . . . . . . . . . . . . . . . . . . . . . . . . . . . . . . 126Exhibit 4.11 - Part 2. Client Coverage Ratios Databank, 2021 . . . . . . . . . . . . . . . . . . . . . . . . . . . . . . . . . . . . . . . . . . . . . . . . . . . . . . . . . . . . . 127Exhibit 4.12. Investor Satisfaction Dashboard, 2Q 2021 . . . . . . . . . . . . . . . . . . . . . . . . . . . . . . . . . . . . . . . . . . . . . . . . . . . . . . . . . . . . . . . . . . 12812The Cerulli Report U.S. Advisor Metrics 2021
Table of ContentsBusiness DevelopmentExhibit 4.13. Average Growth/Loss per Advisor, 2021 . . . . . . . . . . . . . . . . . . . . . . . . . . . . . . . . . . . . . . . . . . . . . . . . . . . . . . . . . . . . . . . . . . . . 129Exhibit 4.14. Average Growth/Loss per Advisor Dashboard, 2021 . . . . . . . . . . . . . . . . . . . . . . . . . . . . . . . . . . . . . . . . . . . . . . . . . . . . . . . . . 130Exhibit 4.15. Inflows vs. Outflows Dashboard, 2021 . . . . . . . . . . . . . . . . . . . . . . . . . . . . . . . . . . . . . . . . . . . . . . . . . . . . . . . . . . . . . . . . . . . . . 131Exhibit 4.16 - Part 1. Inflows vs. Outflows Dashboard Databank, 2021 . . . . . . . . . . . . . . . . . . . . . . . . . . . . . . . . . . . . . . . . . . . . . . . . . . . . . 132Exhibit 4.16 - Part 2. Inflows vs. Outflows Dashboard Databank, 2021 . . . . . . . . . . . . . . . . . . . . . . . . . . . . . . . . . . . . . . . . . . . . . . . . . . . . . 133Exhibit 4.17. Sources of New Clients, 2021 . . . . . . . . . . . . . . . . . . . . . . . . . . . . . . . . . . . . . . . . . . . . . . . . . . . . . . . . . . . . . . . . . . . . . . . . . . . . . 134Exhibit 4.18. Business Development Strategies Dashboard, 2021 . . . . . . . . . . . . . . . . . . . . . . . . . . . . . . . . . . . . . . . . . . . . . . . . . . . . . . . . . 135Exhibit 4.19. Strategic Alliances, 2021 . . . . . . . . . . . . . . . . . . . . . . . . . . . . . . . . . . . . . . . . . . . . . . . . . . . . . . . . . . . . . . . . . . . . . . . . . . . . . . . . . 136Chapter 5: Fees and Pricing . . . . . . . . . . . . . . . . . . . . . . . . . . . . . . . . . . . . . . . . . . . . . . . . . . . . . . . . . . . . . . . . . . . . . . 137Compensation Structure and Fee LevelsExhibit 5.01. Advisor Compensation, 2021 vs. 2023E . . . . . . . . . . . . . . . . . . . . . . . . . . . . . . . . . . . . . . . . . . . . . . . . . . . . . . . . . . . . . . . . . . . . 138Exhibit 5.02. Advisor Compensation Databank, 2021 vs. 2023E . . . . . . . . . . . . . . . . . . . . . . . . . . . . . . . . . . . . . . . . . . . . . . . . . . . . . . . . . . . 139Exhibit 5.03. Advisory Fee Dashboard, 2021 vs. 2023E . . . . . . . . . . . . . . . . . . . . . . . . . . . . . . . . . . . . . . . . . . . . . . . . . . . . . . . . . . . . . . . . . . . 140Exhibit 5.04 - Part 1. Fee vs. Commission Mix Databank, 2021 vs. 2023E . . . . . . . . . . . . . . . . . . . . . . . . . . . . . . . . . . . . . . . . . . . . . . . . . . . 141Exhibit 5.04 - Part 2. AUM-Based Advisory Fees Databank, 2021 . . . . . . . . . . . . . . . . . . . . . . . . . . . . . . . . . . . . . . . . . . . . . . . . . . . . . . . . . . 142Exhibit 5.04 - Part 3. AUM-Based Advisory Fees by Managed Account Type Databank, 2021 . . . . . . . . . . . . . . . . . . . . . . . . . . . . . . . . . . . 143Exhibit 5.05. Anticipated AUM-Based Advisory Fee Changes, 2023E . . . . . . . . . . . . . . . . . . . . . . . . . . . . . . . . . . . . . . . . . . . . . . . . . . . . . . . 144Nontraditional FeesExhibit 5.06. Non-Traditional Fees, 2021 . . . . . . . . . . . . . . . . . . . . . . . . . . . . . . . . . . . . . . . . . . . . . . . . . . . . . . . . . . . . . . . . . . . . . . . . . . . . . . . 145Exhibit 5.07. Non-Traditional Fees Databank, 2021 . . . . . . . . . . . . . . . . . . . . . . . . . . . . . . . . . . . . . . . . . . . . . . . . . . . . . . . . . . . . . . . . . . . . . . 146Exhibit 5.08. Financial Planning Fees Dashboard, 2021 . . . . . . . . . . . . . . . . . . . . . . . . . . . . . . . . . . . . . . . . . . . . . . . . . . . . . . . . . . . . . . . . . . 147Investor PerspectiveExhibit 5.09. Investor Willingness to Pay for Advice, 2Q 2021 . . . . . . . . . . . . . . . . . . . . . . . . . . . . . . . . . . . . . . . . . . . . . . . . . . . . . . . . . . . . . 148Exhibit 5.10. Investor Willingness to Pay for Advice Databank, 2Q 2021 . . . . . . . . . . . . . . . . . . . . . . . . . . . . . . . . . . . . . . . . . . . . . . . . . . . . 149Exhibit 5.11. Investor-Reported Fee Structure, 2011–2Q 2021 . . . . . . . . . . . . . . . . . . . . . . . . . . . . . . . . . . . . . . . . . . . . . . . . . . . . . . . . . . . . 150Exhibit 5.12. Investor-Reported Fe
U.S. Advisor Metrics 2021 Client Acquisition in the Digital Age PRODUCT DETAILS y Key findings . PLANSPONSOR, S&P Capital IQ MMD, Financial Planning, Financial Advisor Magazine, Investment Advisor Magazine, and Cerulli Associates, in partnership with the Investments & Wealth Institute,