Transcription
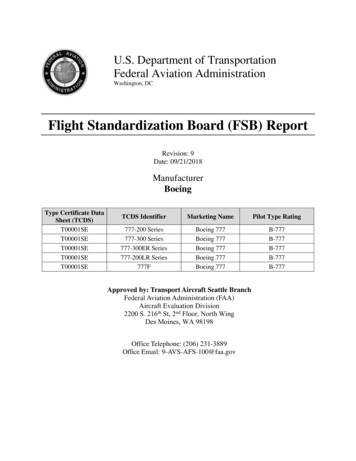
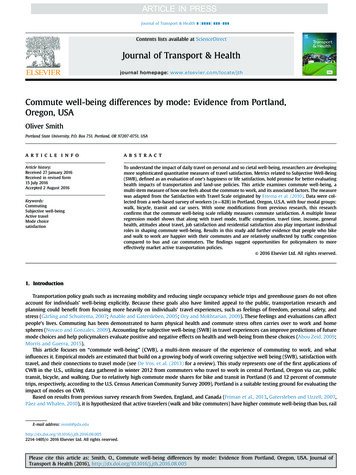
Journal of Transport & Health ( ) – Contents lists available at ScienceDirectJournal of Transport & Healthjournal homepage: www.elsevier.com/locate/jthCommute well-being differences by mode: Evidence from Portland,Oregon, USAOliver SmithPortland State University, P.O. Box 751, Portland, OR 97207-0751, USAart ic l e i nf oa b s t r a c tArticle history:Received 27 January 2016Received in revised form15 July 2016Accepted 2 August 2016To understand the impact of daily travel on personal and so cietal well-being, researchers are developingmore sophisticated quantitative measures of travel satisfaction. Metrics related to Subjective Well-Being(SWB), defined as an evaluation of one's happiness or life satisfaction, hold promise for better evaluatinghealth impacts of transportation and land-use policies. This article examines commute well-being, amulti-item measure of how one feels about the commute to work, and its associated factors. The measurewas adapted from the Satisfaction with Travel Scale originated by Ettema et al. (2010). Data were collected from a web-based survey of workers (n ¼828) in Portland, Oregon, U.S.A. with four modal groups:walk, bicycle, transit and car users. With some modifications from previous research, this researchconfirms that the commute well-being scale reliably measures commute satisfaction. A multiple linearregression model shows that along with travel mode, traffic congestion, travel time, income, generalhealth, attitudes about travel, job satisfaction and residential satisfaction also play important individualroles in shaping commute well-being. Results in this study add further evidence that people who bikeand walk to work are happier with their commutes and are relatively unaffected by traffic congestioncompared to bus and car commuters. The findings suggest opportunities for policymakers to moreeffectively market active transportation policies.& 2016 Elsevier Ltd. All rights reserved.Keywords:CommutingSubjective well-beingActive travelMode choicesatisfaction1. IntroductionTransportation policy goals such as increasing mobility and reducing single occupancy vehicle trips and greenhouse gases do not oftenaccount for individuals’ well-being explicitly. Because these goals also have limited appeal to the public, transportation research andplanning could benefit from focusing more heavily on individuals’ travel experiences, such as feelings of freedom, personal safety, andstress (Gärling and Schuitema, 2007; Anable and Gatersleben, 2005; Ory and Mokhtarian, 2009). These feelings and evaluations can affectpeople's lives. Commuting has been demonstrated to harm physical health and commute stress often carries over to work and homespheres (Novaco and Gonzales, 2009). Accounting for subjective well-being (SWB) in travel experiences can improve predictions of futuremode choices and help policymakers evaluate positive and negative effects on health and well-being from these choices (Abou Zeid, 2009;Morris and Guerra, 2015).This article focuses on “commute well-being” (CWB), a multi-item measure of the experience of commuting to work, and whatinfluences it. Empirical models are estimated that build on a growing body of work covering subjective well being (SWB), satisfaction withtravel, and their connections to travel mode (see De Vos, et al. (2013) for a review). This study represents one of the first applications ofCWB in the U.S., utilizing data gathered in winter 2012 from commuters who travel to work in central Portland, Oregon via car, publictransit, bicycle, and walking. Due to relatively high commute mode shares for bike and transit in Portland (6 and 12 percent of commutetrips, respectively, according to the U.S. Census American Community Survey 2009), Portland is a suitable testing ground for evaluating theimpact of modes on CWB.Based on results from previous survey research from Sweden, England, and Canada (Friman et al., 2013, Gatersleben and Uzzell, 2007,Páez and Whalen, 2010), it is hypothesized that active travelers (walk and bike commuters) have higher commute well-being than bus, railE-mail address: 08.0052214-1405/& 2016 Elsevier Ltd. All rights reserved.Please cite this article as: Smith, O., Commute well-being differences by mode: Evidence from Portland, Oregon, USA. Journal ofTransport & Health (2016), http://dx.doi.org/10.1016/j.jth.2016.08.005i
O. Smith / Journal of Transport & Health ( ) – 2or car commuters, controlling for other variables (i.e. age, income, gender, education, vehicle availability, job satisfaction, residentiallocation satisfaction, and accessibility). T-tests, ANOVA and multiple linear regression analyses are used to test this hypothesis.Subsequent sections are presented as follows: section two briefly presents the development of SWB/satisfaction with travel research inprevious literature; section three discusses the data and methods used, including modifications of the CWB measure from previousresearch; section four presents a description of the sample, the acceptability of the CWB measure, and findings from model estimationresults, and; section five offers conclusions and practical implications of the findings, noting limitations and suggestions for furtherresearch.2. TheoryLevels of satisfaction and happiness can have important consequences for people's lives. A growing chorus argues that policies shouldfocus on well-being, rather than economic indicators. Nobel-prize winning psychologist Daniel Kahneman (1999) maintains that SWBmeasurements could complement conventional tools for measuring benefits and losses in a variety of domains, and in policy analysis.Transportation planning and policy relies heavily on benefit-cost analysis that have sometimes neglected impacts on people (and naturalsystems) that are difficult to measure or monetize. Dora and Phillips (2000) argues that “Psychosocial variables should become an integralpart of impact assessments. This can only happen once appropriate indicators have been identified and methods developed to measureand analyse them” (p. 29). Measurements of travel well-being could be important indicators for impact assessments. They could alsoprovide a measure of livability, a concern for cities competing to attract investment and improve their communities. There are strong ideasdeveloping about the role of pedestrian, bicycle and transit facilities in making communities more livable. However, a better understanding of this role in actual experiences (and decision-making processes) is needed in order to properly plan future facilities thatenhance livability.The theoretical framework of the relationships between travel and subjective well-being is adapted from Ettema et al. (2010) andsubsequent work by Friman et al. (2013) and De Vos et al. (2013). Their work posits that travel affects well-being, positively and negatively,both through the activities accessed from travel (or not accessed, for some) and the actual travel itself. As mentioned above, people's“travel well-being” is made up of affective (i.e. emotional) and cognitive (i.e. evaluative) components. Their work draws partly on earlierwork from Mokhtarian and Solomon (2001) who found that the experience of travel is sometimes valued positively, contrary to what isassumed in most regional travel demand models.Further work enhanced this theory, noting that people's perceptions of modes affect how much they like travel. (Ory and Mokhtarian,2009, p. 26). For example, some people simply enjoy bicycling more than others. One study found that those who cycle longer distances ontheir commutes have more positive attitudes towards bicycling than those who cycle shorter distances on their commutes (Heinen et al.,2011). Travel liking can affect people's mode choices for other trip purposes besides the commute. Schneider (2011) used a mixed logitmodel to analyze data from people traveling to, from, and within 20 San Francisco Bay Area shopping districts, also found that enjoymentof walking and biking significantly impacts people's choice of walking and bicycling. Additional research is needed to better understandhow specific travel attributes affect travel well-being.This study focuses on only a portion of Ettema et al.’s model, measuring travel well-being from commuting as opposed to other trippurposes. The model integrates the following relationships: Indicators of affective and cognitive dimensions of commute well-being;How sociodemographic characteristics, residential location, commute mode options and choices relate to well-being;How instrumental factors such as travel time, traffic congestion, and bus crowdedness affect commute well-being; andHow attitudes about travel and commuting interact with mode choice to affect commute well-being.The addition of measures of socio-demographics, travel preferences, accessibility, and mode choice offers a way to expand Ettemaet al.’s (2010) conceptual model. To keep the focus on the above relationships, other relationships in the model, such as participation inactivities accessed by travel and its relationships with personal growth, life purpose and life satisfaction are not examined (De Vos et al.,2013). This study focuses on commuting to just one activity - work. The relationship between commute satisfaction and life satisfaction isalso beyond the scope of this article.3. Material and MethodsThe survey instrument was developed during fall 2011. Survey questions were developed independently and borrowed from other researchers. Borrowed measuresincluded questions on travel well-being (Ettema et al., 2011) and attitudes and preferences about travel (Ory and Mokhtarian, 2005).Commute well-being is a composite measure adapted from the Satisfaction with Travel Scale (STS) developed by Ettema et al. (2011) and uses seven questions thatmeasure both affective responses to the commute (i.e. feelings during the commute) and cognitive responses (i.e. evaluations of the commute afterwards). Questions arestructured according to the following statement: “Please select the box that best corresponds to your experience during the [most recent commute] trip. For example, if youwere very tense, select the box for 3. If you were neither tense nor relaxed, select the box for 0. If you were relaxed, select the box for 3.”Several changes were made to the STS scale in Ettema et al. (2011) in order to simplify the measure and reduce respondent burden. Three questions were removed, twoof which (confident/worried and especially alert/tired) did not fit well in other STS studies (Friman et al., 2013; Olsson et al., 2012; De Vos et al., 2015). The wording on fourquestions was slightly changed. One question related to enjoyment was added based on its theorized relevance to well-being and mode choice (Schneider, 2011). Thesechanges were made following pre-testing of the survey instrument. In addition, while Ettema et al. distinguish between two types of affect (positive activation and positivedeactivation) as well as a cognitive evaluation of travel, this study only distinguishes affective from cognitive evaluation items. This was done to simplify the commute wellbeing measure while retaining its two main dimensions: affective and cognitive. These changes correspond with De Vos et al.’s (2015) recommendations.Data was collected via web-based surveys that were completed between January 16 and March 7, 2012. Participating organizations were recruited via phone calls and emails topersonal contacts and employers (often HR managers) in central Portland. In this study, central Portland includes downtown Portland and a roughly one-mile perimeter that includesthe adjacent Lloyd District, Pearl District, Old Town Chinatown, and Central Eastside. Most respondents were recruited via forwarded emails containing information on the study fromcontacts within their organizations. To increase representativeness of the sample, organizations from different sectors were contacted using the Portland Business Alliance directory.More than 50 organizations were contacted, usually through an email (see Appendix C) to office managers. Over 20 organizations from private, non-profit and public sector agenciesPlease cite this article as: Smith, O., Commute well-being differences by mode: Evidence from Portland, Oregon, USA. Journal ofTransport & Health (2016), http://dx.doi.org/10.1016/j.jth.2016.08.005i
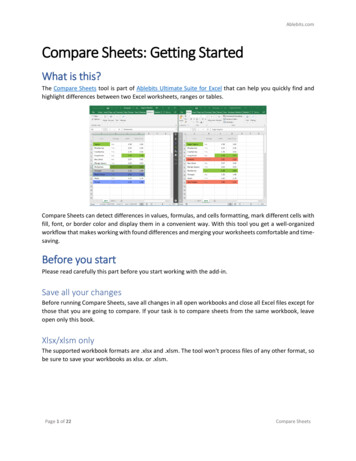
O. Smith / Journal of Transport & Health ( ) – 3(insurance, energy, planning, technology, social service, architecture, arts, government, and accounting) distributed survey information. In addition, bike commuters were recruited byreceiving cards handed out during peak morning commute hours on three bridges leading to central Portland. Eligible participants must have commuted outside of the home to centralPortland at least two days per week. 828 valid responses were collected. The response rate is estimated to be 30%, although only 75% of surveys received were from respondents at aworkplace or intercept site in which a known number of surveys were distributed. A response rate for the entire sample could not be calculated.Respondents’ residential and work locations were geocoded using ArcGIS software. Street network data was drawn from Metro's Regional Land Information System(RLIS) database, which contains detailed layers of information on the Portland region's (including Vancouver, WA) transportation and land-use network. The street networkfor the Portland region was connected the network for the Vancouver region by editing vertices in ArcMap. ArcMap's Network Analyst and Shortest Path function were usedto determine commute distances as well as distances from homes to the nearest bus and light rail stops. The survey asked for self-reported commute times, which wasoperationalized as a variable in the model presented in this paper.The CWB measure was analyzed using confirmatory factor analysis (via a structural equations model). Variance in CWB was analyzed using t-tests, ANOVA tests, and amultiple regression model. SPSS, AMOS and Microsoft Excel software were used to compute the analyses.4. Results and discussion4.1. Respondent profileA sample was obtained that represented three roughly equal groups of transit, bicycle, and car commuters. A small number (3.2%,n ¼26) of respondents walked for their most recent commute. Some of the analysis in this study includes findings related to walkcommutes.Locations of homes are well distributed throughout the Portland metro region. Seventy-one percent of commuters surveyed lived inPortland and 29% lived outside of Portland. Estimated commute distances (in miles) were longest for respondents that commuted by car(M ¼8.6, SD ¼6.7), followed by transit (M ¼7.7, SD ¼5.9), bike (M¼3.8, SD¼ 1.7), and walk commutes (M ¼1.4, SD ¼1.3). While approximately 80% of bicycle commutes were less than 5 miles long, car and transit were the dominant modes for longer commutes.The demographic profile of the sample is somewhat different than of the population of commuters to Portland based on CensusTransportation Planning Products (CTTP) data (2006–2008). This was expected because the study focuses on commuters to centralPortland, a primarily white-collar population compared with commuters to all of Portland. Sociodemographic data for respondents issummarized in Table 1. Data for commuters to central Portland was unavailable.The majority of respondents fall into the 25–44 year age group, while the age distribution is more spread out for the population ofcommuters in Portland. Bike commuters aged 25–44 are particularly overrepresented but there are relatively few bike commuters at least60 years old (1.1%) in the sample compared to Census data for this group (7.2%). Household incomes of survey participants are somewhathigher than incomes of commuters to Portland overall although this is expected since jobs in central Portland provide higher wages thanin other parts of the city.4.2. Acceptability of commute well-being measureThe commute well-being scale shows acceptable internal consistency based on a Cronbach's alpha of 0.87 (Tavakol and Dennick, 2011).To further assess reliability and validity, illustrate the measure's two factor structure and the relative correlations for each question, astructural equation model of commute well-being was performed based on confirmatory factor analysis using AMOS Version 19.0, asshown in Fig. 1. At first, fit statistics indicate a marginally unacceptable fit (χ2(9)¼220.7, CFI¼ 0.923, RMSEA ¼.169) because the CFI isslightly less than the cutoff value of .95 recommended by Hu and Bentler (1999) for a good fitting model. When co-variances betweenerror terms for two pairs of items – (1) Arrival time confidence and Stress and (2) Boredom/enthusiasm and Excitement items are estimated, as suggested by the modification indices, model fit improves substantially (χ2(12) ¼121.7, CFI¼0.963, RMSEA ¼.105). These changesto the model are minor and theoretically plausible because the questions in each pair have similar meanings. Variable loadings changevery little from the modifications.Most of the variables load highly (i.e. greater than .6) on the affective and cognitive constructs. One item, Arrival Time Confidence(assessing “Worried that you would arrive on time to Confident that you would arrive on time”) has a marginally acceptable standardizedloading (λ ¼.47). Since arrival time confidence theoretically represents part of commute well-being and was used successfully in Ettemaet al. (2011) and Friman et al. (2013), this item was retained. The path coefficients between latent variables show that both affective andcognitive components have significant and positive effects on overall commute well-being, as expected.Table 1Sociodemographic description of respondents.Study respondentsAge 25 to 44Age 60 or moreIncome (% less than 35 K)Income (% 75 K or more)Vehicle Availability (1 or more)Gender (% Female)Race/ethnicity (% white)Education (% 4-yr college)Education (% graduate degree)Children (% with children in hh)One-adult, no childrenZipcar memberCTTPNCar n ¼ 257Bike n ¼ 261Transit n¼ 241Walk n ¼26% of total% of 4.9%76.4%–––––Please cite this article as: Smith, O., Commute well-being differences by mode: Evidence from Portland, Oregon, USA. Journal ofTransport & Health (2016), http://dx.doi.org/10.1016/j.jth.2016.08.005i
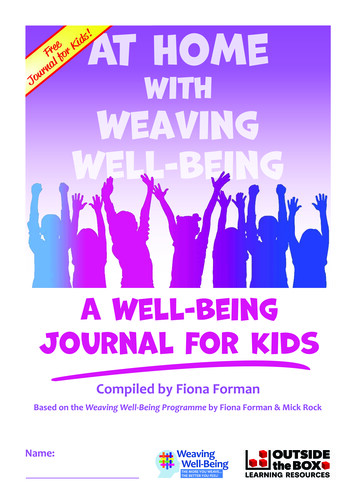
4O. Smith / Journal of Transport & Health ( ) – Based on the theoretical relevance of these items, their use in other studies of commute well-being, and the statistical tests described inthis section, the seven-item, two-factor measure of CWB is deemed to be reliable and valid.To operationalize the CWB measure to compare modes, scores from the seven commute well-being questions were averaged to obtaina CWB score for each respondent. This procedure was used in Ettema et al. (2011), and Friman et al. (2013). The averages were incorporated as the dependent variable in regression models, allowing simpler model testing and reporting of independent variables than inSEM. SEM models were also tested and considered, but the regression results suggested similar effects from the variables under consideration. The sample showed a wide distribution of CWB. Average CWB scores range from 2.6 (indicating low CWB) to 3.0 (indicatinghigh CWB). Mean CWB is 1.01 (S.D. ¼.995) and the distribution of CWB is somewhat skewed to the right (skewness ¼ 0.490), as shown inArrival ec t.74Ease oftripCogni veCWB1.00.75Comparisonto usualFit informa onχ2 121.7 (12)CFI .963RMSEA .105Fig. 1. Confirmatory factor analysis of the commute well-being measure.Fig. 2. Distribution of commute well-being among respondents (N ¼ 828).Please cite this article as: Smith, O., Commute well-being differences by mode: Evidence from Portland, Oregon, USA. Journal ofTransport & Health (2016), http://dx.doi.org/10.1016/j.jth.2016.08.005i
O. Smith / Journal of Transport & Health ( ) – 5Fig. 2, meaning that the sample expresses positive commute experiences overall. Using the guidelines of West et al. (1995), the distribution of CWB does not substantially depart from normality as the Skewness is less than two and Kurtosis (0.193) is less than seven.4.3. Variation in CWB by modeMean CWB among modes used by sample respondents are shown in Table 2. There is a statistically significant difference (p o.001) inCWB between the different modes used, a one-way ANOVA shows. Commuters that bicycle to work have the highest CWB, followed bywalk commuters. T-tests suggest no significant differences between the two groups, although the sample of walkers is small. These resultsare in line with findings from similar research showing high commute satisfaction among active modes (i.e. Abou Zeid and Ben-Akiva,2011, De Vos et al., 2015; Ettema et al., 2011; Friman et al., 2013; Gatersleben and Uzzell, 2007, Páez and Whalen, 2010; St-Louis et al.,2014).Among car commuters, those who carpool to work have higher CWB than those who drive alone, however the difference is notstatistically significant at the .05 level. The standard deviation for those that drive alone is relatively high, indicating high variability inCWB among this group. Travel time and the degree of congestion experienced likely explain much of this variability.Among transit users, express bus (CTRAN) users have higher CWB than local bus (TriMet) users and the differences were significantusing t-tests (p o.05). Express bus users likely use the express services from Vancouver, Washington to downtown Portland and LloydTable 2Commute well-being by mode.ModeMeanNS.D.BicycleWalkExpress busLight railLocal busCarpoolDrive 0013779176828.70.891.05.88.981.011.011.00ANOVASum of squaresdfMSFP-valueBetween groupsWithin ble 3Estimation results of multiple linear regression models on commute well-being with all modes and condensed kBikeLight railBusCTRAN express bus.191.454.512.046 .115.223.075.006.000.663.268.237Trip attributesTravel time 4 40 min (car)Congested (car)Congested (local bus)Crowded transitTo lloyd center by bike .373 1.187 .684 .580 .365.003.000.020.000.094Job and home satisfaction and healthJob – very satisfiedHome – very satisfiedHealth – very good.124.191.182.036.001.002AttitudesTransition usefulUse trip productively (busþ light rail)Use trip productively (car)Only good thing destination (bus þlight rail)Car safer than bike (bike).154.157.122 .103 .103.000.001.007.011.036DemographicsIncome 4 75,000Observations2R.1387620.438.015Please cite this article as: Smith, O., Commute well-being differences by mode: Evidence from Portland, Oregon, USA. Journal ofTransport & Health (2016), http://dx.doi.org/10.1016/j.jth.2016.08.005i
O. Smith / Journal of Transport & Health ( ) – 6Center, both within central Portland. Along with having very few stops, express buses are equipped with more comfortable seating thanlocal buses. Light rail (TriMet MAX) users have higher CWB than local bus users but the difference is not significant at the .05 level.4.4. Multiple linear regression on CWBTo test whether theoretically relevant factors have independent effects on commute well-being when controlling for each other, amultiple linear regression models was tested in which CWB is regressed on the full list of possible explanatory variables, such that:N¼ β þ β Tþ β Mþ β J þ β Sþ β A þ u00000whereN¼ CWB;T ¼trip attribute variables;M¼ mode variablesJ¼job and residential satisfaction variables;S¼sociodemographic variables;A ¼attitudinal variablesu ¼regression error term.All of the independent variables are categorical except the attitudinal variables, which are continuous. The attitudinal variables werealso adjusted to control for the distribution of responses for each attitude. This helped show the strength of agreement for eachrespondent relative to the sample mean. The mean response for each item (for the sample) was calculated and then subtracted from theindividual responses for each attitude. In addition, four of the five attitudinal variables in the model were interacted with variables forspecific modes.Results of the multiple linear regression analysis are provided in Table 3. Unstandardized coefficients and their significance arereported. For the most part, only significant variables (po .05) were included in the estimation. However, all mode coefficients wereincluded, even when non-significant, to provide a full explanation of their relative influence on commute well-being.Results show that even when trip attributes, mode options, job and home satisfaction, health, demographic, and attitudinal variablesare taken into account, both biking and walking to work have positive significant effects (p o0.01) on CWB. This is consistent with manyprevious studies (Abou-Zeid, 2009; De Vos et al., 2015; Ettema et al., 2011; Friman et al., 2013; St-Louis et al., 2014). All other modes haveinsignificant coefficients, presumably because other elements in the model, such as crowding, congestion, and travel time explain asubstantial portion of the variation in CWB among modes.Commute time for car commutes (i.e. car commutes at least 40 min long) has a significant negative effect on CWB (p o0.01) and itsmagnitude is moderate. It was expected that longer transit commutes would also significantly reduce CWB, but this factor is not statistically significant. Other ways of specifying travel time were examined, but only the forty minute “break point” was found to besignificant, and only for car commuters. The findings add some support to findings in other research (e.g. Mokhtarian and Solomon, 2001;Páez and Whalen, 2010; Mokhtarian et al., 2014) that (1) travel time is not always something to be minimized and (2) people “budget”their travel time and will be satisfied as long as their commutes fall within a certain expected amount of time.The magnitudes of the effects of traveling to work by car and bus on highly congested streets on CWB are particularly large and highlysignificant. This finding is in line with previous research (e.g. Anable and Gatersleben, 2005; Novaco and Gonzales, 2009) showing that thedelays, reduced predictability, and stress caused by congestion have a negative effect on well-being.As expected, commuting in crowded public transit vehicles has a highly negative and significant (p o0.001) effect on CWB. While thequestion was subjective – people's conceptions of crowded transit vehicles may differ – having many people on one's bus or light railvehicle clearly seems to reduce CWB.Results show a marginally significant (p o0.1) negative effect for bike commuters to in the workplaces in the NE (Lloyd Center) district.The auto-oriented environment of Lloyd Center, which is flanked by Interstates 5 and 84, may decrease commute well-being for cyclists.Job and residential (including home and neighborhood) satisfaction variables both have positive and significant effects on CWB(p o0.05 and p o0.01, respectively), although the effect is larger and more significant for residential satisfaction. The job satisfaction resultis in line with previous research (Abou Zeid and Ben-Akiva, 2011). The results suggest that people who can optimize their residentiallocation choice with respect to their work location express both high home and commute satisfaction. It is possible that home satisfactionencompasses people's preferences for accessibility to different commute modes, such as a preference for a bike friendly neighborhood.Having very good health has a positive and significant (p o0.005) effect on CWB. For bike commuters, better health may facilitategreater enjoyment of the trip by allowing faster speeds with less discomfort. Bike commuters with relatively poorer health may havegreater discomfort and more frequently be overtaken by other bike commuters, thereby reducing CWB. Greater health may allow carcommuters to more effectively cope with the stresses of commuting. Better health may also increase CWB because the sedentary nature ofthe car allows people to be physically active during non-commute activities, such as running during lunchtime or after work.For all modes, relatively strong agreement with the statement “The trip to/from work is a useful transition between home and work”positively and significantly (p o.001) increases CWB. For bus and car users, relatively strong agreement with the statement “I use my tripto/from work productively” increases CWB moderately based on coefficients for the interaction terms. Similarly, relatively strongagreement with the statement “The only good thing about traveling is arriving at your destination” appears to decrease CWB among busand light rail users. For bicyclists, greater agreement that “Traveling by car is safer overall than riding a bicycle” decreases CWB slightly.These results support findings in other research (Páez and Whalen, 2010) that commuters who believe that the trip is a useful transitionbetween home and work and use the trip productively have more positive views of commuting.Of all the demographic variables examined in this analysis, only income has a significant effect (po .05) on CWB. Income could affectCWB through a number of pathways. Higher incomes tend to reflect greater flexibility to optimize areas of one's life with respect to workPlease cite this article as: Smith, O., Commute well-being differences by mode: Evidence from Portland, Oregon, USA. Journal ofTranspor
Commute well-being differences by mode: Evidence from Portland, Oregon, USA Oliver Smith Portland State University, P.O. Box 751, Portland, OR 97207-0751, USA article info Article history: Received 27 January 2016 Received in revised form 15 July 2016 Accepted 2 August 2016 Keywords: Commuting Subjective well-being Active travel Mode choice .