Transcription
Power and utilitiestransactions andtrendsApril 2021
Robust growth outlook in the economy and resilient confidence is suitable fordealmakingMiles HuqPartnerStrategy and TransactionsErnst & Young LLP“Driven by massiveinvestment plans and arobust policy framework,the US is emerging as a keyinvestment destination andmarket participants willcontinue to reposition theirbusiness for the energytransition of the futureThe capital markets capped off a strong Q1 2021. The continued strong marketconditions were fueled by added confidence in the global economy, which is likely toexpand this year at the fastest pace in at least four decades. According to the IMF, theworld economy is expected to grow 6% in 2021, the most since 1980. Vaccine rolloutand economic stimulus spending are the two drivers for this forecast. The USeconomy is projected to expand 6.4% this year and regain its pre-pandemic size afteran estimated contraction of 3.5% last year. China’s economy is projected to expand8.4% this year¹, up from an earlier forecast of 8.1%.Q1 was marked by blockbuster deal activityThe global P&U deal value more than doubled in Q1 2021 to US 73.3b, the highestvalue in the past three years, from US 33.0b in Q4 2020. There were 13 multibilliondollar deals constituting 76% of the total deal value. The energy transition agenda,along with a sharpening focus on core businesses and reliable returns, droveUS 37.5b of deal activities in renewables and electric T&D. Additionally, the venturecapital funding also increased to US 6.8b, most of which was invested inelectrification such as transport, battery storage and digital technologies. The totaldeal value in the transportation sector was US 4.3b in Q1 2021, which is almost 75%of the total deal value in this sector for all of 2020. Moreover, several major USelectric utilities announced plans to build a network of electric vehicle chargingstations connecting major highways in the South, Midwest, Gulf and Central Plainsregions.Utilities are redrawing their strategic direction while demonstrating deal flexibilityThe US utilities are demonstrating deal flexibility to strengthen their balance sheetsand grow regulated earnings. PPL acquired Narragansett Electric in an asset swap ofits UK electricity distribution business with National Grid in a bid to grow domesticregulated earnings. Exelon Corp. announced plans to split its business into twopublicly traded companies: one comprising its six regulated electric and gas utilities,and the other, which it plans to spin off, comprising its 31 GW competitive generationfleet and customer-facing businesses. DTE Energy also moved ahead with its plan tospin off its non-utility natural gas pipeline, storage and gathering business into a newstand-alone independent, publicly traded company, to be named DT Midstream.Another example of a high-profile business separation was the bankruptcy ofFirstEnergy Corp.’s competitive arm, FirstEnergy Solutions, which will form anindependent firm, Energy Harbor Corp.Another example of deal flexibility was the 19.9% equity stake in Duke Energy Indianaacquired by GIC, a Singapore-based sovereign wealth fund, in a move designed tostrengthen Duke Energy’s balance sheet and boost earnings while leveragingattractive valuations and efficient financing options for growth.US is emerging as the most attractive investment destinationThe Biden administration has taken concrete steps that will create massiveopportunities for investments in low-carbon technologies. The US 2t infrastructureplan provides fertile ground for investments in EV charging, grid infrastructure andrenewables including nascent US offshore wind market — an area that so far has beendominated by European players in the Northeast US.1IMF Projections (Link)Power and utilities transactions and trends Page 1
Table of contentsChapter 1: Global deals summary03Chapter 2: Americas deals summary08Chapter 3: Valuation snapshot13Chapter 4: M&A outlook and investment hotspots16
Global dealssummaryPower and utilities transactions and trends Page 3
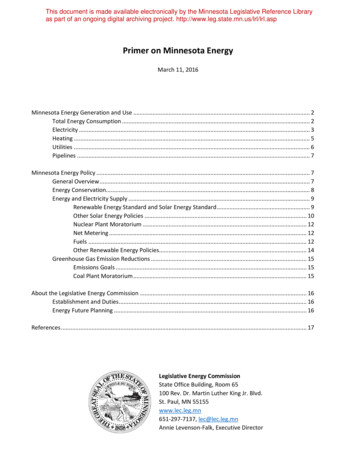
Global deal activity jumps 122% in Q1 2021to reach US 73.3bTotal deal value increased 2.2x to reach US 73.3b from US 33b in Q4 2020 — driven by 13multibillion-dollar deals in Q1 2021.There were US 60.8b investments in integrated and renewable assets driven by energy transitionagenda and a need to minimise risk. The quarter saw a surge in acquisition of energy services assets,with US 5.1b in deals in district heating, battery storage and microgrids.Reinforcing the attractiveness of the US market, PPL acquired The Narragansett Electric Company,the largest T&D and gas distribution company in Rhode Island from National Grid for US 5.17b. Thisdeal was part of the largest transaction of the quarter where PPL sold its UK-based distributionbusiness to National Grid — a deal that formed 53% of the total deal value in Europe, catapulting UK tothe top investment destination in Q1.Global deal valueLargest segmentLargest regionQ1 2021Q1 2020US 73.3bUS 24.1bIntegratedRenewablesUS 37.5bUS 12.2bEuropeAsia-PacificUS 37.2bUS 10.2b197156Total dealsChart 1: Global P&U deal value by segmentChart 2: Global P&U deal value and volume by region(announced asset and corporate-level deals, Q1 2019–Q1 2021)(announced asset and corporate-level deals, Q1 2019–Q1 2021)250602004015010020500Q1Q2Q3Q4Q1Q2Q3Q4Q12019 2019 2019 2019 2020 2020 2020 2020 2021GenerationIntegrated utilityGas utilityVolumeEnergy servicesRenewablesWater and wastewaterSource: EY analysis with data sourced from Mergermarket1Publicly08030070Deal value (US b)300Deal volume (number of deals)Deal value (US 2019 2019 2019 2019 2020 2020 2020 2020 2021AmericasAsia-PacificEuropeAfrica and Middle EastVolumeSource: EY analysis with data sourced from Mergermarketdisclosed investmentsPower and utilities transactions and trends Page 4Deal volume (number of deals)Note: All transaction information is EY analysis with data sourced from Mergermarket
Renewables and structural decarbonizationwill continue to drive dealmaking in the sectorM&A can drive economies of scale from cost efficiencies, strengthen core geography, driveinvestments towards IRP, expand into new technology and operational capabilities as well as portfoliodiversification.Financial position of impacted utilities weakened by adverse weather conditionsUS has been facing some of the worst climate conditions in form of snow storms and wildfires, whichhas created a tremendous financial distress for impacted utilities. Storm Uri that froze Texas andneighboring states shook the financial position of energy companies — including gas utilities that hadto spend billions in purchasing gas and power generation utilities that had to bear the hedging loss.Additionally, IPPs like NRG and Vistra announced substantial earnings losses. Companies like JustEnergy, Innergex Renewables Energy, Algonquin Power & Utilities, Atmos Energy, etc., announcednegative impacts on the financials. Further, shale oil producers, including Diamondback Energy,Cimarex Energy, Occidental Petroleum and Lardo Petroleum, reported impacts on theproduction/output capacity.Investments surge in renewables, with wind attracting the largest chunk in the USBiden administration’s push to decarbonize the US power sector by 2035 will be a catalyst to furtherincrease the share of renewables in the net capacity being added to the US power grids. Windaccounted for 83% of the completed capacity in 2020. US generated 40% of electricity from lowcarbon sources (renewables and nuclear) in 2020 — indicating the increasing resilience of renewableenergy portfolio.Globally, driven by ESG agenda, utilities continued to shift their investments to renewables — RWE andEnBW announced plans to invest US 6b by 2022 and US 4.7b by 2025 in renewables, respectively.During Q1, there were US 710m deals where utilities across the globe acquired renewable energyassets. European utilities also were active in US with EDP Renewables North America acquiring 85%stake in C2 Energy Capital to expand its presence in the distributed generation market.Attractive regulated earnings continue to drive megadealsThe regulated assets continued to attract investments, driven by accelerated coal plant retirements,increasing investments in renewables, storage and natural gas generation. In Q1, there were US 29bdeals where regulated T&D assets were acquired.Investment in new regional transmission networks is increasing to help alleviate transmissionconstraints, aid renewables development and enhance system safety and reliability. Further, the needto address storm hardening, aging infrastructure and continuous grid investments driven byelectrification will drive further investments in regulated assets.New investors increased involvement in the P&U sectorNew investors including private equity, infrastructure funds (US 27b acquisitions) and oil and gas(O&G) companies (US 2.5b) were heavily involved in the P&U sector more than ever and across thespectrum, including convention generation, renewables and emerging tech as well as traditionalregulated acquisitions. Earlier in March, the US set a target to deploy 30 GW of offshore wind by 2030— rising from a small base of current installed capacity and presenting further attractive entry pointsfor European investors, O&G companies and financial sponsors. Offshore wind is an attractive way toget large scale renewable generation into densely populated regions.Power and utilities transactions and trends Page 5
UK emerged as the hotspot of deals drivenby corporate investmentsInvestment activity globally by country, YTD (US b)Investor countryUKUK21.1US0.3USAustralia FranceItalyJapanChina1.62.2NewSouthZealand Singapore Rest ofTotalthe world 01.7Chile1.71.5Rest ofthe world1.51.0Total .6New ZealandJapan10.53.35.30.42.52.51.53.65.64.573.320 Source: EY analysis with data sourced from MergermarketNote: Numbers may not add to total due to rounding.Americas investment flow by country and investor, YTD (US b)InvestorcountryCorporate Financialinvestors investorsUS6.82.0Singapore0.02.1South Korea1.50.0Rest of the torcountryCorporate Financialinvestors investorsAustralia0.02.2US0.00.4Rest of the world0.10.0Total0.12.6Target regionsUSACanadaNote: Numbers may not add to total due to rounding.ChilePower and utilities transactions and trends Page 6
Transportation and battery storageattracted 82% of total venture capital (VC)funding in Q1 2021Chart 3: Global deal value in new technology*(announced deals, Q1 2021)Chart 4: Global deal value and volume in new technology,by region(announced deals, Q1 2021) ( m)384.423.21,741.14,656.4Americas (62)Asia-Pacific (21)Europe (37)Africa & Middle East (3)Region (x) deal volumeSource: EY analysis with data sourced from Pitchbook* Transpo Transportation, Digital digital and analytics, Eff/Man Efficiency and manufacturing, BTM Behind the meter, WTE Waste to energy and biofuelsElectric transport attracted the majority portion of VC investments01The total deal value in the transportation sector was US 4.3b in Q1 2021, which is almost 75% of the totaldeal value in this sector in the entire 2020. The largest deal was the US 2.65b series F investment in RivianAutomotive, a US-based manufacturer of autonomous electric vehicles. Average deal size was the highest inAmericas (US 220.3m) followed by Asia-Pacific (US 113.1m) and Europe (US 32.3m).Investment in hydrogen technology risesAmericas led the investments globally02In Q1 2021, the total values of investment inAmericas touched US 4.7b, led by the US,which contributed more than 96% of the totalVC funding in the region. This investment isalready more by US 1.0b than the totalinvestment in the region in entire 2020.03In Q1 there were 11 deals where investorspumped in US 220.8m, a 6% increase from Q42020, in companies that are working inhydrogen technology with applications inElectric Vehicles industry and large industrialsegment. Americas witnessed five such dealsfollowed by Europe with four deals.Power and utilities transactions and trends Page 7
Americas dealssummaryPower and utilities transactions and trends Page 8
US led the region with US 12.6b investments,a 19.1% increase quarter over quarterThe US and Canada witnessed an increase in total deal values in Q1 2021 compared to Q4 2020,resulting in deal value for Americas, as a whole, to be the highest in the first quarter of an year overthe past three years (2019–21).Utilities continue to redraw their strategic directions in search for accretive value growth poolsthrough spin-offs, stake sells and asset swaps. In a bid to raise low-cost capital, Duke Energy sold a19.9% stake in its subsidiary to GIC. Exelon Corp. announced plans to split its business into twopublicly traded companies. PPL acquired Narragansett Electric as part of asset trade that involveddivesting its UK electricity business to National Grid — a swap that was valued at US 25b.The total deal value of Americas, US 17.9b in Q1, represents a threefold year over year increasefrom Q1 2020. There were five multibillion-dollar deals in Q1 2021 with a combined value of aroundUS 12.4b. The deal value in the region during Q1 2021 was driven by integrated assets (US 6.8b)and generation (US 4.2b) deals.Deal value (US b)20100801560104052000Q1Q2Q3Q4Q1Q2Q3Q4Q12019 2019 2019 2019 2020 2020 2020 2020 2021GenerationIntegrated utilityGas utilityVolumeEnergy servicesRenewablesWater and al volume (number of deals)(announced asset and corporate-level deals, Q1 2019–Q1 2021)Deal value (US b)Chart 6: Americas deal value and volume by investor type(announced asset and corporate-level deals, Q1 2019–Q1 2021)Deal volume (number of deals)Chart 5: Americas deal value and volume by segment0Q1Q2Q3Q4Q1Q2Q3Q4Q12019 2019 2019 2019 2020 2020 2020 2020 2021CorporateFinancialSource: EY analysis with data sourced from MergermarketUtilities acquire assets to boost strong rate regulated earnings01In the largest deal of the quarter, PPL Corporation sold off its UK business to National Grid for US 19.8b andacquired The Narragansett Electric Company in exchange. This strategic repositioning will transform PPL into ahigh-growth, purely US-focused company with a strong balance sheet.Financial investors take lead in dealmaking02Financial investors were involved in 24 deals (total value of US 7.1) in the Americas, including two multibilliondollar deals. Renewables were the preferred segment for investors, with more than 50% of the 13 deals inthis segment. Global private equity (PE) investors snapped assets in US, Canada and Brazil — investing a totalof US 5b.Energy services attract US 4b investments03In the largest deal of the region in the energy services segment, IFM Investors and Ontario Teachers' PensionPlan acquired Enwave Energy Corp., a Canadian district energy service provider. In another interesting deal,SK Holdings, a South Korean company, acquired a 10.2% stake in Plug Power Inc, a US-based alternatetechnology firm, with a view to strengthen its leadership in hydrogen fuel cell market.Power and utilities transactions and trends Page 9
US leads deal activity with 56% of total dealvalue in the Americas 19 2019 2019 2019 2020 2020 2020 2020 2021GenerationEnergy servicesGas utilityVolume31038262412100Q1Q2Q3Q4Q1Q2Q3Q4Q12019 2019 2019 2019 2020 2020 2020 2020 2021GenerationEnergy servicesGas utilityVolumeIntegrated utilityRenewablesWater and wastewaterDeal volume (number of deals)14Deal value (US b)(announced asset and corporate-level deals, Q1 2019–Q1 2021)Deal volume (number of deals)Chart 8: Canada deal value and volume by segment(announced asset and corporate-level deals, Q1 2019–Q1 2021)Deal value (US b)Chart 7: US deal value and volume by segmentIntegrated utilityRenewablesWater and wastewaterNote: There were no disclosed deals in Q2 20 for CanadaChart 9: South America deal value and volume by segment9458407356305254203152101500Q1 2019Q2 2019Q3 2019Q4 2019Q1 2020Q2 2020Q3 2020GenerationEnergy servicesIntegrated utilityGas utilityWater and wastewaterVolumeQ4 2020Q1 2021Deal volume (number of deals)Deal value (US b)(announced asset and corporate-level deals, Q1 2019–Q1 2021)RenewablesSource: EY analysis with data sourced from MergermarketBrazil and Chile were the most attractiveinvestment destinations in South America04There were a total 16 deals in South America inQ1. Eight of these deals were in Brazil, themost attractive market in the region. Six out ofthese eight deals (75%) were domestic dealsand all were in the renewables segment. Thenext most attractive in the region was Chile,with five deals. 60% of the deals (three out offive) were cross-border with Europeancorporates involved in two of them.Investments in the renewable segment alsodominated the deals in Chile.Canada witnesses its highest deal activity05Total deal value in Canada reached US 2.7b inQ1 2020, the highest for the region in the pastnine quarters. Financial investors led theinvestments with US 2.6b, with the only billiondollar deal in the region led by private equityfirms. Planned investments by Canadian utilityholding companies, including Fortis Inc.,Algonquin Power and Utilities, Emera Inc. etc.,to move towards net-zero emissions andcontinue rate base expansion that will continueto keep this market attractive for investors.Power and utilities transactions and trends Page 10
Notable deals in Americas — Q1 BidderDealvalue(US b)Bidder rationaleSegmentUSPPL Corporation5.17Expanding presence in rateregulated high-growthIntegrateddomestic market withfocus on decarbonisationDuke EnergyUS/Indiana, LLC (19.9%Singaporestake)GIC Private Limited2.05Aligns with bidder’sstrategy to acquire highgrowth assets at attractivevaluationsGeneration06 JanuaryPlug power Inc.(10.18% stake)US/SouthKoreaSK Holdings Co., Ltd.Strengthen leadershipposition in hydrogenacross AsiaEnergyservices14 JanuaryAtlantic PowerCorporationUS/USI Squared Capital0.81As part of companies focuson energy, utilities, digital Generationinfrastructure01 MarchNRG Energy, Inc.(4.85GW fossilgenerating assets)US/USArcLight Capital Partners,LLC0.76As part of focus ofinvestments in high-growth Generationenergy assets16 FebruaryPine RunMidstreamUS/USUGI Energy Services, LLC;Stonehenge EnergyResources LP0.21To complement existingportfolio of midstreamassetsRenewables19 JanuaryRWE AG (24% stakein four onshoreUS/UKwind facilities inTexas)Greencoat Capital LLP0.16Aligns with bidder'sstrategy to acquire highgrowth onshore windassetsRenewables13 JanuaryCorning NaturalGas HoldingCorporationUS/USArgo InfrastructurePartners LLC0.13To get admittance to longterm capitalOthers18 JanuaryC2 Energy CapitalLLC (85% Stake)US/USEDP Renewables NorthAmerica LLC0.11To enhance presence indistributed generationmarketsRenewables02 MarchPineapple EnergyLLCUS/USCommunication Systems,Inc.0.08Expand in residential solarand battery storagemarketRenewables09 FebruaryAEP GenerationResources Inc.US/US(48MWHydroelectric Plant)NDIn line with bidder’sstrategy to acquire highgrowth assetsRenewables14 January174 Power Global(50% stake)US/FranceTotal S.E.NDAs part of aim to expandinto renewables marketand achieve 35 GWcapacity globallyRenewables07 JanuaryRecurrent Energy,LLC (144-MWacSolar project)US/USDuke Energy CorporationNDExpansion of renewablesportfolioRenewables01 FebruaryLinden CogenHoldings, LLC (28%Stake)US/ThailandElectricity GeneratingPublic Company LimitedNDExpansion of portfolioGeneration(Gas)25 JanuaryUpper PeninsulaPower CompanyUS/CanadaAxium Infrastructure Inc.NDTo develop new renewableenergy solutionsIntegrated18 MarchThe NarragansettElectric Company28 JanuaryUS/USEagle Creek RenewableEnergy LLC1.5Source: EY analysis with data sourced from MergermarketNote: Numbers may not add to total due to rounding; ND not disclosedPower and utilities transactions and trends Page 11
Notable deals in Americas — Q1 BidderDealvalue(US b)Bidder rationaleSegmentRenewablesSouth America15 MarchEnel Americas SA(10% stake)Chile/ItalyEnel S.p.A.1.47In line with strategy toconsolidate renewableenergy business inCentral and SouthAmerica21 JanuaryLuz del Sur S A(13.49% stake)Peru/ChinaChina Yangtze PowerCo., Ltd.0.56Expand its footprint inSouth AmericaGeneration22 MarchIgua SaneamentoS.A. (45% stake)Brazil/CanadaCanada Pension PlanInvestment Board0.21Geographicaldiversification inemerging marketsWater andWastewater17 MarchAlto Sertao II;Guaimbe SolarComplex (19.9%stake)Brazil/BrazilItau Unibanco HoldingS.A.0.15Expand its renewableportfolioGeneration02 FebruaryEnwave EnergyCorp.Canada/AustraliaIFM Investors; OntarioTeachers' Pension Plan2.19Enhancing the energyservices portfolioEnergyServices06 JanuaryAMP Solar GroupInc.The Carlyle Group0.37Part of strategy to investin solar projects andbattery storagetechnologiesRenewables04 FebruaryPennask WindPower Project;Canada/Shinish Creek Wind CanadaPower ProjectCanadian Power HoldingsInc.0.04Growth and businessexpansion opportunitiesRenewablesCanadaCanada/USSource: EY analysis with data sourced from MergermarketNote: Numbers may not add to total due to rounding.Power and utilities transactions and trends Page 12
Valuation snapshotPower and utilities transactions and trends Page 13
Global valuations and TSR snapshot — Q12021The global markets continued to show strength, with S&P 1200 index returning 5.3% in Q1. The EYGlobal P&U Utilities analysis recorded a total shareholder return (TSR) of 2.9% for Q1 2021. The EYAPAC P&U analysis outperformed the broader market as well as the other regions with a return of8.7% for the quarter. Gas utility sector in the US with TSR of 11.4%, water and wastewater utilities inEurope with TSR of 6.8% and small and medium market capitalization integrated utilities in AsiaPacific with a TSR of 21.8% were the best performing sectors.Renewable utilities in Europe, driven by the continued support, were the highest valued sub-segmentacross all the regions with EV/FY 1 EBITDA of 16.5x. Indicating yet to be severed ties with coal andgas generation, the generation and retail segment in Asia-Pacific was the highest valued in the regionwith EV/FY 1 EBITDA of 11.0x.Return over time — from base dateChart 10: Total shareholder return by region(from 1 January 2021 to 17 March 2021)108.0106.0Indxed n-2131-Jan-2115-Feb-21EY Global P&U index (2.9%)AmericasLarge market capitalizationintegratedMedium and small marketcapitalization integratedGas utilityGeneration and retailRenewablesWater and wastewaterAverage regional analysis17-Mar-21S&P Global 1200 (5.3%)EuropeAsia-PacificQ1 2021 TSR 0.33.20.68.7(2.3)(3.5)(2.2)3.102-Mar-21EV/FY 1 EBITDA(At 31 March 21)Value of TSR more than the regional sector averageValue of TSR less than the regional sector averageSource: EY analysis with data sourced from CapitalIQPower and utilities transactions and trends Page 14EY Global P&UanalysisEY APAC P&UanalysisEY Europe P&UanalysisEY AmericasP&U analysis10.1x9.5x8.9x11.3x
Americas valuations and TSR snapshot —Q1 2021The EY Americas P&U Utilities analysis recorded a total shareholder return (TSR) of 3.1% for Q12021. Gas utility was the best performing subsector in the Americas with a TSR of 11.4% YTD. Waterand wastewater was the highest valued subsector in the Americas with a EV/FY 1 EBITDA of 14.2x,led by American States Water Company with EV/FY 1 EBITDA of 18.0x and American Water WorksCompany, Inc. with EV/FY 1 EBITDA of 17.0x. These assets along with generation and retail had thehighest TSR after renewables, indicating an increasing optimism towards meaningful privatizationopportunities in US municipal water sector.Gas utilities (11.4%) and medium and small market capitalization integrated (6%) offered above marketreturns providing potential M&A opportunities for the investors.Regulated utilities in the US have been historically valued at a premium with better prospects of highand stable future earnings (chart 12) . This is driving diversified utilities to carve out generationassets to de-risk their portfolio and enhance regulated earnings.Return over time — from base dateChart 11: Total shareholder return by segment(from 1 January 2021 to 17 March 2021)125.0120.0Indxed value115.0110.0105.0100.095.090.085.080.0S&P 500 (6.2%)Medium and small market capitalization integrated (6%)Generation and retail (-2.3%)Water and wastewater (-2.2%)Chart 12: 24-month forward PE ratio (x)vs. FY2EPSEV/FY 1 EBITDA(At 31 March 21)Large market capitalizationintegratedMedium and small marketcapitalization integrated11.7x10.4xGeneration and retail8.0xRenewablesWater and wastewaterEY Americas Utilities analysis11.8xFY2 EPS9.8xGas utilityLarge market capitalization integrated (2.6%)Gas utility (11.4%)Renewables (-3.5%)14.2x11.3xValue of TSR or EV/FY 1 EBITDA more than the regional sector 30.0FY2PE ratioValue of TSR or EV/FY 1 EBITDA less than the regional sector averageSource: EY analysis with data sourced from CapitalIQ20.0Diversified/hybrid utilitiesPurely regulated utilitiesNote: Sample contains US utilities for which FY2PE ratios were available.Power and utilities transactions and trends Page 15
M&A outlookand investmenthotspotsPower and utilities transactions and trends Page 16
The P&U sector is ripe with opportunitiesfor dealmaking driven by fundamentalsThe market fundamentals for the P&U sector remains attractive due to the considerable capex spendingneeds to fortify and modernize aging electric, gas and water infrastructure; retire and replace coal plantswith renewable generation; and increase investments to enhance system safety and reliability whilecontinuously enhance gird investments for electrification and clean energy transition.US to witness active inbound deal activityThe US 2t investment plan announced in the US includes US 100b investment in powerinfrastructure and US 174b in EVs. With the US rejoining the Paris Agreement, the path has been setfor increasing investments to create a clean energy economy — a major part of which could go intoacquiring onshore and offshore wind assets. New investors in the P&U sector like large O&G, inboundinvestors and financial sponsors would seek attractive growth opportunities in renewables,transmission and distribution and electrification in the region.Investments to flow in hydrogen driven by need for economies to decarbonizeInvestors are turning their attention to hydrogen as a means to quickly decarbonise the economy — drivenby the expected fall in the technology costs — 85% by 2050 (BloombergNEF estimate).Hydrogen could well replace natural gas as a bridge fuel to a zero-carbon economy.The US government has introduced the “H2@Scale” program that aims at affordable hydrogen production,storage, distribution and consumption in the region. Utilities like Xcel Energy, Arizona Public Service andNextEra Energy are exploring hydrogen as a fuel. Globally, Longi Green Energy Technology Co., the world’slargest solar company by market capitalization, has announced plans to enter into hydrogen market.The unprecedented market conditions due to Storm Uri have exposed vulnerability ofutilitiesAn active 2021 hurricane season in the US could add to the woes of the utilities — conditions that could setthe stage for well capitalized companies and PE firms to step in by absorbing the market, credit andoperational risks while adding value to the vulnerable companies. We expect such conditions to create ripeground for distressed M&A with depressed valuations — an opportunity that could be grabbed by investorswith significant pockets of cash and high risk appetite.Consolidation in small and medium cap utilities to drive deal activity in the sectorThe investor sentiment is upbeat for small and medium capitalization utilities that have witnessed premiumvaluations with 6% total shareholder returns during Q1. There was US 3.7b deals in generation and smalland medium electric utilities. The desire for scale through dealmaking, as smaller companies grapple withthe swelling costs of serving a larger population, upgrading aging infrastructure and investing in cleanerenergy production, will continue to attract consolidation as financial sponsors desire to snap attractiveassets in this subgroup.Market to witness unconventional deal structures as PE firms step in to add valueThe flexible deal structure options presented by large PE firms are becoming an attractive option forutilities to tap a large pool of low-cost capital. Integrated utilities like Duke Energy dipped into the poolby selling off an equity stake in subsidiaries. Special purpose acquisition companies (SPACs) areincreasingly becoming an attractive alternate for private market investors and executives looking formore certain path to public markets. In Q1, ReNew Power, an Indian renewable energy company,entered into a definitive business combination agreement with RMG Acquisition Corp. II to tap the USpublic markets. Need for low-cost capital, especially by private companies undergoing energytransition, would drive more SPAC-led M&A in the coming quarters.Power and utilities transactions and trends Page 17
Power & Utilities contactsMiles M. HuqKen GardnerPartner, Ernst & Young LLP, Strategyand Transactionsmiles.huq@ey.comManaging Director, Ernst & Young LLP,Strategy and Transactionsken.gardner@ey.comBrian A. MartinKaren W. FeltonEnergy Market Se
Global deal activity jumps 122% in Q1 2021 to reach US 73.3b Chart 1: Global P&U deal value by segment (announced asset and corporate-level deals, Q1 2019-Q1 2021) Chart 2: Global P&U deal value and volume by region (announced asset and corporate-level deals, Q1 2019-Q1 2021) Q1 2021 Q1 2020 Global deal value US 73.3b US 24.1b Largest .