Transcription
Water Loss Audit Manualfor Texas Utilitiesby Mark Mathis George Kunkel, P.E. Andrew Chastain HowleyReport 367March 2008Texas Water Development Boardwww.twdb.state.tx.us
Texas Water Development BoardReport 367Water Loss Audit Manualfor Texas UtilitiesbyMark MathisTexas Water Development BoardGeorge Kunkel, P.E.American Water Works AssociationWater Loss Control Committee, Active MemberAndrew Chastain HowleyAmerican Water Works AssociationWater Loss Control Committee, Active MemberMarch 2008
This project was funded in part by the U.S. Bureau of Reclamation’s Water 2025 Challenge Grants for Statesand by the Texas Water Development Board.Cover photo courtesy of City of Austin Water Utility
Texas Water Development BoardJames E. HerringChairman, AmarilloJack HuntVice Chairman, HoustonJoe M. CrutcherMember, PalestineThomas Weir Labatt, IIIMember, San AntonioLewis H. McMahanMember, DallasEdward G. VaughanMember, BoerneJ. Kevin WardExecutive AdministratorThe Texas Water Development Board freely grants permission to copy and distribute its materials. The agencywould appreciate acknowledgment.Published and distributed by theTexas Water Development BoardP.O. Box 13231, Capitol StationAustin, Texas 78711-3231March 2008Second printing, December 2009(Printed on recycled paper)
This page is intentionally blank.
Table of ContentsExecutive Summary.11 Introduction.22 Implementing Water Audits as the Foundation of the Water Loss Control Program.33 Understanding the Water Audit Method.53.1 How Much are Losses Costing the Utility?.53.2 Performance Indicators.74 Validating and Interpreting the Water Audit Data. 104.1 Indicating the Level of Validation. 114.2 Interpreting and Comparing Water Audit Data. 115 Using Bottom-up Activities to Better Validate the Water Audit Data. 135.1 System Input Volume and Consumption. 135.2 Apparent Losses. 135.3 Real Losses. 155.4 Active Leakage Control. 156 Conclusion . 177 References . 188 Acknowledgments. 18List of Figures and TablesFigure 3.1 Water Balance.5Table 3-1 Standard Definitions of the Water Audit Method.6Table 3-2 International Water Association and American Water Works AssociationWater Audit Method—Performance Indicators.9Appendix 1Appendix 1.1Appendix 1.2Appendix 1.3Appendix 1.4Water Audit Worksheet. 21Water Audit Worksheet Instructions. 25Guidance Matrix for Assigning Scores to Components of the Water Audit. 30General Guidelines for Setting a Target Infrastructure Leakage Index. 36Appendix 2Form A Leak Detection and Repair Field Guide. 39Form B Leak Detection Survey Daily Log. 41Form C Leak Repair Summary Report. 43Form D Line Flushing Report. 45Form E Water for Fire Fighting and Training. 47Appendix 2.1 Leak Rates from Holes of Known Sizes. 49Brochures, Services, and Leak Detection Equipment. 50Texas Water Development Board Report 367v
This page is intentionally blank.viTexas Water Development Board Report 367
Executive SummaryIn 2003, the 78th Texas Legislature,Regular Session, enacted House Bill3338 to help conserve the state’s waterresources by reducing water loss occurring in the systems of drinking waterutilities. This statute requires that retailpublic utilities providing water withinTexas file a standardized water auditonce every five years with the TexasWater Development Board (TWDB). Inresponse to the mandates of House Bill3338, TWDB developed a water auditmethodology for utilities that measuresefficiency, encourages water accountability, quantifies water losses, and standardizes water loss reporting across thestate.The water audit worksheet developedby TWDB is comprised of data typically required for a water supply utility toconduct an internal “top-down” wateraudit approach, which is largely a desktop exercise gathering data and information from water consumption and lossreports already commonly compiled bymany water utilities. However, utilitiesseeking to gain further efficiencies canperform additional field auditing tasksin a more comprehensive “bottomup” manner. Bottom-up practices candetermine more precisely where lossesare occurring, thus better validating theaccuracy of the water audit and guidingthe utilities’ strategies for loss controlefforts. To assist water utilities in undertaking their top-down water audit, thismanual provides guidance on the specific data and information that should begathered to assemble a realistic assessment of water loss. The most importantstep in the auditing process is to begin.This standardized approach to auditing water loss provides utilities with areliable means to analyze their waterloss performance. By reducing waterloss, utilities can increase their efficiency, improve their financial status,minimize their need for additional waterresources, and assist long-term watersustainability.Texas Water Development Board Report 3671
1 IntroductionWater is one of our most preciousresources, yet within NorthAmerica only a few states have begunto implement proactive water accountability policies for their utilities. Waterauditing and loss control are emergingas significant conservation measuresbecause as utilities minimize water loss,they increase their efficiency and reducethe need to search for additional watersources. For utilities to effectively identify losses in their systems, they mustfirst employ water auditing as a routinebusiness practice, using a method thathas clearly defined terms and meaningful performance indicators. In recognizing the need for such a reliable method,the Water Loss Control Committee ofthe American Water Works Associationadopted (AWWA, 2003) the methodpublished by the International WaterAssociation’s Water Loss Task Force(Alegre and others, 2000). This methodology not only assists utilities in identifying where their losses are occurring,but also expresses by volume how muchis lost and associates a cost to those losses. It also standardizes the water auditreporting process for water utilities.2The Texas Water Development Board(TWDB) water audit program beginswith an examination of the water utility’s business practices and procedures.It uses the terms from the InternationalWater Association and American WaterWorks Association Water Audit Method(hence referred to as the Water AuditMethod)—system input volume, authorized consumption, real and apparentloss—as well as the performance indicators included in this method. Since allwater is essentially accounted for in thisapproach, the term “unaccounted-for”water is discouraged. The Water AuditWorksheet (Appendix 1.1) is the auditform developed by TWDB, based onthe Water Audit Method. The approachdefined in this manual also asks waterutilities to assess the validity of the datathat they enter into the water audit. Ascale is provided for all components ofwater consumption and loss, assigninglow assessment scores to data that aremere approximations and high assessment scores for components that arederived from well-calibrated meters orother well-substantiated means.Texas Water Development Board Report 367
2 Implementing Water Audits as the Foundationof the Water Loss Control ProgramFor utilities to operate efficiently, theyshould use recommended practicesto monitor and control water and revenue losses. These include active leakage control, as well as metering production flows and customer consumption.Consumption data serve as the basisfor billing and revenue collection formost water utilities, but the data arealso critical to water demand management. Customer billing systems, whichare commonly used to archive customeraccount and consumption data, shouldbe configured so that consumption volumes are not distorted by billing adjustments or inconsistent procedures. Bycorrecting deficiencies in archiving customer consumption in billing systems,utilities can often recover significantuncaptured revenue. Today’s water utilities can also use other advanced technologies, such as automatic meter reading technologies, Advanced MeteringInfrastructure, Supervisory Control andData Acquisition (SCADA) Systems,Geographic Information Systems (GIS),hydraulic modeling, and sophisticatedleak detection technologies, such asleak correlators and leak noise loggers.Many of these technologies help reducereal loss, which saves water resources.By using the above technologies,water utilities can address a variety oflosses; however, the foundation of thewater loss control program is the compilation of the water audit on a routinebasis as a standard business practice.Water utilities should compile a regularwater audit in a fashion similar to howan accounting firm routinely examinesthe finances of a business: by trackingvolumes of water supplied by the waterutility from source to customer, justas accountants track a firm’s financesthroughout its business path. The wateraudit quantifies production flows, cus-tomer consumption, and a number ofdifferent loss volumes and assigns coststo these volumes. Throughout the auditprocess, utilities determine specific areasof water loss, examine deficiencies intheir overall performance, review currentpractices and procedures for developingdata, and calculate the costs of water loss.The Water Audit Worksheet (Appendix1.1) uses a standard set of terms and definitions so that all utilities in the state aremeasuring water loss in the same way.Because many water utilities historicallyused water accounting practices that fellshort in accurately determining wherelosses occurred and how to recover lostrevenues, the water audit provides atool for systematically evaluating thoselosses. The methods included in thismanual follow a standard, best management practice approach advocated by theAmerican Water Works Association, andTWDB encourages all water utilities toimplement this method. Although HouseBill 3338 requires that water utilities filea water audit only once every five years,TWDB recommends that water utilities compile a water audit annually onthe same business year frequency as thefinancial audits that many water utilitiesperform.Water loss programs should beplanned based upon validated wateraudit data. The self-assessment featuredescribed in this publication guideswater utilities in taking steps to firstobtain sufficiently validated data beforemaking important loss control programdecisions on the data produced by thewater audit. An internal top-downwater audit approach is largely a desktop exercise gathering data and information from water consumption and lossreports already commonly compiled bymany utilities. Once a water utility produces this top-down water audit withTexas Water Development Board Report 3673
sufficiently validated data, it can beginbottom-up field auditing activities to better validate the initial data. Bottom-upactivities are longer term in nature andcan be implemented incrementally overperiods of months or years. These activities typically involve some investment,but the projected costs of these activitiescan be objectively weighed against theinherent costs of the losses, as detailedin the validated top-down water audit. Inthe long run, investment in bottom-upactivities will likely save the utility from4costly, ineffective programs that may notprovide a substantial return on investment. Bottom-up practices are discussedin Chapter 5.Utilities should use the Water AuditWorksheet to compile the top-downwater audit. To assist in this process,TWDB has provided a worksheetdesigned as a software application forutilities to download to their computers, so they can continue to use themethodology.Texas Water Development Board Report 367
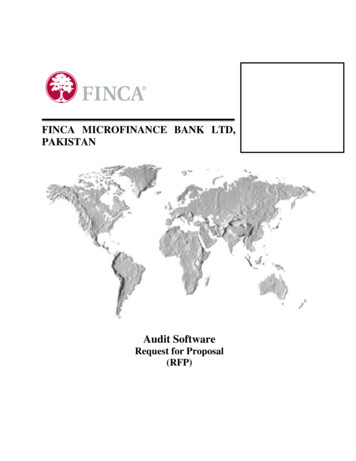
3 Understanding the Water Audit MethodThe Water Audit Method takes theapproach that all water is accounted for and quantified as either a component of beneficial consumption orwasteful loss by measuring (metering)or estimating water quantities. Underthis approach, no water is “unaccountedfor,” and this flawed term and the flawedindicator “unaccounted-for-water percentage” should be avoided. Figure 3.1shows the Water Balance of the WaterAudit Method. All quantities of waterfit into one of the boxes of the waterbalance. The sum of the quantities ofeach column in the water balance is thesame; hence, all quantities balance.Standard terms and definitions thataccompany the components shown inFigure 3.1 are given in Table 3-1, andAuthorizedconsumptionCorrectedinputvolumeTWDB recommends reviewing thesedefinitions before filling out the WaterAudit Worksheet.3.1How Much are LossesCosting the Utility?All losses impart a cost impact to thewater utility and the communities theyserve. By accurately assessing whereand how much water is being lost, utilities can determine how much waterloss is costing. These costs can then becompared to potential investments inloss control activities to determine costbenefit ratios for effective loss reduction. When water utilities reduce losses,they may also improve their financialbottom line. All component volumes ofBilledauthorizedconsumptionBilled metered consumptionUnbilledauthorizedconsumptionUnbilled metered consumptionBilled unmetered consumptionRevenue waterUnbilled unmetered consumptionUnauthorized consumptionApparent lossesCustomer meter under-registeringBilling adjustment and waiversReported leaksWater lossesWholesalewaterimportedNon-revenueWaterReal lossesUnreported lossFigure 3.1. Water BalanceTexas Water Development Board Report 3675
Table 3‑1. Standard Definitions of the Water Audit MethodDefinitionsSystem Input Volume: The total water supplied to the water distribution system, corrected for any error in theproduction meters. It includes the sum total of purchased surface or groundwater, water obtained through theutility’s own wells, water purchased through contracted interconnections with other water suppliers, or waterobtained from other sources. This is the total of all production meter readings for the entire audit year fromall sources. Production Meter Accuracy—All production and bulk purchase volumes should be metered. Meters shouldbe well maintained and calibrated to ensure a high degree of accuracy. For any given water utility, one ormore production meters may incur a degree of inaccuracy due to wear, malfunction, or improper installation. Corrected System Input Volume—The level of production meter accuracy is usually a percentage. To calculate corrected system input volume, divide the system input volume by the percentage of accuracy to achievethe corrected system input volume—the volume actually placed into the distribution system. Since inaccurate meters often under-register, this number will usually be larger than the reported system input volume.Authorized Consumption: This category consists of all water that has been authorized for use by the utilityand its customers. Authorized consumption includes, but is not limited to, water used for residential andcommercial uses, fire fighting, public fountains, golf courses, municipal landscape watering, line flushing, cityoffices, water treatment facility use, dust control, and construction practices. Authorized consumption is all thewater the utility gave permission to a business, individual, or itself to use. It may be billed or unbilled, meteredor unmetered. Billed Metered—Water that is appropriately metered and billed. Billed Unmetered—Estimated water that has been sold but not metered; for example, dust-control trucksand types of businesses using authorized water drawn from fire hydrants or other unmetered uses. Unbilled Metered—Water that is metered but not billed, such as city/government offices, city park irrigation, water treatment facility use, some fire department use, and line flushing. Unbilled Unmetered— Estimated water that is not billed or metered, such as most line flushing (see Form Din Appendix 2). Estimations may also be entered for this category.Installing meters on any of the sources of significant unmetered water represents bottom-up activity to improvethe accuracy of the top-down water audit and better manage these water uses.Water Losses: This is derived by subtracting authorized consumption from corrected system input volume.Water losses exist in two major classifications: apparent losses and real losses. Both are considered types ofwater loss. Apparent loss is valued at the customer retail rate because it had the opportunity to be sold.Real loss, however, is calculated at the variable production cost of water. Apparent Losses—These are “paper” losses that occur when water reaches a customer, but the volume isnot accurately measured and/or recorded due to customer meter inaccuracy, systematic data handling discrepancies, or unauthorized consumption. Apparent loss is water that has been consumed but not paid fordue to error in quantifying the volume of water. These losses cost water utilities revenue and understate thecollective measure of customer consumption in the water utility’s service area. Valued at the customer retail(revenue) rate, these losses are often very cost effective to recover. Real Losses—These are the “physical” losses, largely leakage, from the infrastructure: mains, valves, servicelines, and tank overflows. Leakage occurrences are categorized as “reported” (visible) events or “unreported”(nonvisible—found only by active leak detection) events. Real losses occur prior to reaching customers andeffectively force the water utility to treat and deliver more water than its customer population actually requires. These losses are typically valued at the variable production rate (costs for water treatment, pumping,or bulk water purchase); however, if the utility is experiencing a water shortage, then real losses maybe valued at the customer retail rate because recovered leakage could be viewed as water that can be soldto customers.Revenue Water: Revenue water consists of billed wholesale water exported and billed metered and unmeteredwater. These are usually the primary categories through which the utility can generate revenue.Non-revenue Water: This term is the sum of apparent loss, real loss, and unbilled authorized consumption.Non-revenue water is clearly defined as all water for which no revenue is received.6Texas Water Development Board Report 367
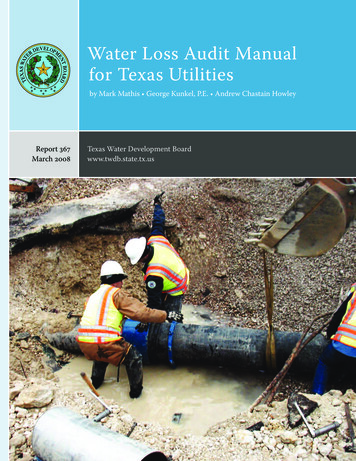
non-revenue water (unbilled authorizedconsumption, apparent loss, and realloss) should be assigned a cost value.1Apparent losses differ from real lossesin the manner in which they occur but,perhaps more dramatically, in the financial impact that they impart to the waterutility. Apparent losses occur when waterhas reached the customer, but by notaccurately recording the consumption,a portion of the revenue is not captured.Apparent losses are, therefore, valued atthe customer retail rate. Water utilitiesoften use rate structures with differentrates for different customer classes, suchas residential and industrial, and for different tiers of water consumption. Forpurposes of simplicity in compiling thewater audit, utilities can use a single,composite rate for all customer classesto determine the cost impact of apparent losses.Real losses cause a portion of thetreated, pressurized water to be lost fromthe distribution system before customeruse. In effect, the utility treats a greatervolume than its customer base requires,hence incurring excess production costs.The cost for real losses is, therefore, typically valued at the variable productioncost and/or the purchase cost of imported bulk water supply. The variable production cost is defined as the cost of rawwater, electricity to treat and distributewater, and chemicals to treat the waterfor the year. One way to calculate thevariable production cost is to divide thesum of the raw water, energy, and chemical costs by the corrected input volume.In cases of water shortage where any realloss reduction results in additional customer sales, then the real losses shouldbe valued at the customer retail rate.1 When compiling the water audit, utilities shoulduse consistent volume units throughout the audit.Often water utilities measure their water supply inone unit (for example, gallons) and their customerconsumption in another unit (for example, cubicfeet). Typically, the customer consumption valuesmust be converted to align with the units ofmeasurement for the water supplied3.2Performance IndicatorsThe water audit method features anumber of performance indicators thatallow water utilities to reliably assesstheir water loss standing and track theirperformance. The performance indicators are designed specifically to track the water utility’s progress on ayear-to-year basis, set performance targets, and benchmark performance with otherwater utilities.The complete list of performanceindicators is shown in Table 3-2. Theindicators are categorized as operationalor financial in nature. The level of detailthey project is also identified as 1) basiclevel indicators, 2) intermediate indicators, and 3) detailed indicators. An arrayof operational performance indicatorsexists—one for apparent losses and fourfor real losses. The operational performance indicators are well suited to evaluate operational efficiency, track progress,and benchmark with other water utilities.Also shown are financial performanceindicators included in the InternationalWater Association and American WaterWorks Association Water Audit Method,including non-revenue water by volumeand non-revenue water by cost.Water utilities can track their performance in controlling apparent losses byusing the apparent loss indicator (Op23),which reflects the volume of apparentlosses quantified in the water audit, normalized by dividing this volume by thenumber of service connections per day.For real losses, the water utility canlikewise track performance using twonormalized indicators of real losses(Op24). Dividing the quantity of reallosses from the water audit by the number of service connections (or miles ofpipe for low density systems) per daygives the Op24 indicator. A secondvariation of this indicator can also becalculated by dividing the result by theTexas Water Development Board Report 3677
average pressure across the system. Theseperformance indicators are good for setting specific leakage reduction targetsand tracking performance.The unavoidable annual real lossesare another performance indicator. Theselosses are a theoretical reference for lowlevel leakage that recognizes even thebest maintained water distribution systems in the world have some leakage.Unavoidable annual real losses are calculated from the equation in Table 3-2 byusing the most influential factors in system leakage: length of piping in the waterdistribution system, number of customerservice connections, and average systempressure. Note that age of the piping isnot an influential factor.The primary performance indicatorused for comparing performance withother water utilities (benchmarking) isthe infrastructure leakage index. Thisindex provides utility managers withthe ability to weigh leakage efficiencyrelative to the ideal low level that mightexist in the water utility (Appendix 1.4).The Water Loss Control Committee ofthe American Water Works Association8also gives guidelines for using the infrastructure leakage index as a preliminaryleakage reduction target-setting tool.The index takes into account system-specific attributes, including thelength of mains, number of customerservice connections, and average pressure; therefore, leakage efficiency can becompared among water utilities in anobjective manner. This avoids a “one sizefits all” approach to target setting. Theinfrastructure leakage index is the ratioof the real loss volume from the wateraudit over the level of unavoidable annualreal losses as calculated for each systemusing the equation shown in Table 3-2(Op25). As a ratio, the lower the valueof the infrastructure leakage index, thecloser the actual level of real losses isto the unavoidable annual real losses.The index represents how efficiently thesystem’s infrastructure upkeep, leakagemanagement, and repair activities areoperating at the current pressure, witha validated low infrastructure leakageindex value implying that the utility isvery efficient.Texas Water Development Board Report 367
Texas Water Development Board Report 3679[gallons/service connection/day/pressure]or[gallons/mile of mains/day/pressure](only if service connection density is 32/mile)UARL (gallons) (5.41Lm 0.15Nc) x P,(Eq. 1) whereLm length of water mains, milesNc number of service connectionsP average pressure in the edOperational:Real lossesOperational:Unavoidable annualreal lossesOperational:Real lossesFi373DetailedFinancial:Non-revenue waterby costValue of non-revenue water as a percentageof the annual cost of running the systemVolume of non-revenue water as% of corrected system input volumeInfrastructure leakage index(dimensionless) Real loss volume/UARLa[gallons/service connection/day]or[gallons/mile of mains/day](only if service connection density is less than 32/mile)* Descriptors assigned to the performance indicators from Alegre and others (2000).aUARL unavoidable annual real lossesFi361BasicFinancial:Non-revenue waterby volumeOp25Op24[gallons/service connection/day]Operational:Real lossesOp231BasicPerformance IndicatorOperational:Apparent lossesCode*Level*FunctionIncorporates different unit costs for non-revenue components. Goodfinancial indicator. These costs include operations, maintenance, andany annually incurred costs for long-term upkeep of the system, suchas repaying capital bonds for infrastructure expansion or improvement.Typical costs include employee salaries and benefits, materials,equipment, insurance, fees, administrative costs, and all other coststhat exist to sustain the drinking water supply. These costs should notinclude any costs to operate wastewater, biosolids, or other systemsoutside of drinking water.Easily calculated from the water balance. Has limited value in high-level,financial terms only. Misleading to use this as a measure of operationalefficiency.Ratio of real loss volume to unavoidable annual real losses). Bestindicator for comparisons between systems.A theoretical reference value representing the technical low limit ofleakage that could be achieved if all of today’s best technology couldbe successfully applied. A key variable in calculating the infrastructureleakage index. The calculation for unavoidable annual real losses is notvalid for systems with less than 3,000 service connections.Easy to calculate this indicator if the infrastructure leakage index is notyet known. Useful for comparisons between systems.Best of the simple “traditional” performance indicators. Useful for targetsetting. Limited use for comparisons between systems.Basic but meaningful performance indicator for apparent losses. Easy tocalculate once apparent losses are quantified.CommentsTable 3‑2. International Water Association and American Water Works Association Water Audit Method—Performa
utilities. This statute requires that retail public utilities providing water within Texas file a standardized water audit once every five years with the Texas Water Development Board (TWDB). In response to the mandates of House Bill 3338, TWDB developed a water audit methodology for utilities that measures efficiency, encourages water account-