Transcription
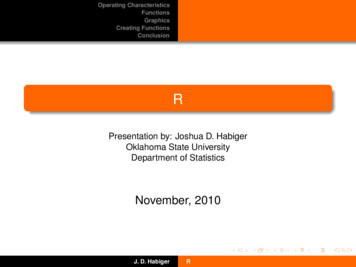
Operating CharacteristicsFunctionsGraphicsCreating FunctionsConclusionRPresentation by: Joshua D. HabigerOklahoma State UniversityDepartment of StatisticsNovember, 2010J. D. HabigerR
Operating CharacteristicsFunctionsGraphicsCreating FunctionsConclusionWhat is R?R is a free, object oriented programming language andsoftware environment for statistical computing andgraphicsJ. D. HabigerR
Operating CharacteristicsFunctionsGraphicsCreating FunctionsConclusionSome HistoryS1978: S project begins atBell Labs- John Chambers et. al1985: Chambers’transition to functions failsGNU1980FSF1983: GNU Manefesto- Richard Stallman- All programs should be free1985: Free SoftwareFoundationS 19901988: S Sofware producedby Statistical Sciences Inc.- Function oriented- Douglas Martin, U. Wash.20001991: Ross Ihaka and RobertGenteman develop R- It mimics S 1996: Ihaka and Gentlemanget GNU General PublicLicense for R- “Copyleft”R2000: R version 1.0Released as a GNU project 20102010: R version 10.0Released as a GNU projectJ. D. HabigerR
Operating CharacteristicsFunctionsGraphicsCreating FunctionsConclusionObjectsClassesData StructureOperating CharacteristicsFunctionsGraphicsCreating FunctionsConclusionJ. D. HabigerR
Operating CharacteristicsFunctionsGraphicsCreating FunctionsConclusionObjectsClassesData StructureStarting RTo run R from the terminal type RJ. D. HabigerR
Operating CharacteristicsFunctionsGraphicsCreating FunctionsConclusionObjectsClassesData StructureR WorkspaceThe R workspace is your current working environment.Contains all user defined objects and some defaultobjectsYou can load a workspace, define some objects, thensave the workspace Data") define some objectsError: unexpected symbol in "define some" pace.RData")J. D. HabigerR
Operating CharacteristicsFunctionsGraphicsCreating FunctionsConclusionObjectsClassesData StructureDefining ObjectsAn object is defined with an “ -” or an “ ”x,y,z,v exist as objects in the workspace x -c(1,2,3)y "y is a character and x is a vector"z -list(x,y,element3 "A list can contain characters")v -matrix(1:10, nrow 5)J. D. HabigerR
Operating CharacteristicsFunctionsGraphicsCreating FunctionsConclusionObjectsClassesData StructureGetting OutputFor most objects, just type the name of the objectSometimes you will need summary(object). morelater x[1] 1 2 3 z[[1]][1] 1 2 3[[2]][1] "y is a character and x is a vector" element3[1] "A list can contain characters"J. D. HabigerR
Operating CharacteristicsFunctionsGraphicsCreating FunctionsConclusionObjectsClassesData StructureGetting elements of an ObjectTwo ways to refer to a “named” element in an object z[[3]] element3[1] "A list can contain characters" z element3[1] "A list can contain characters"For the matrix v you could use v[1,2], v[,1], v[2,].Syntax for referring to elements of an object dependson the objects class.J. D. HabigerR
Operating CharacteristicsFunctionsGraphicsCreating FunctionsConclusionObjectsClassesData StructureClassesAn object belongs to a class.Ex: Numeric, Logical, Character, Vector . class(x)[1] "numeric" is.vector(x)[1] TRUE class(z)[1] "list" class(z[[3]])[1] "character"J. D. HabigerR
Operating CharacteristicsFunctionsGraphicsCreating FunctionsConclusionObjectsClassesData StructureMore on ClassesObjects can be coerced into a different class w -T w[1] TRUE is.logical(w)[1] TRUE as.numeric(w)[1] 1 class(w) -"numeric" is.logical(w)[1] FALSEJ. D. HabigerR
Operating CharacteristicsFunctionsGraphicsCreating FunctionsConclusionObjectsClassesData StructureCoercing ClassesR will attempt to coerce objects into a class for you ifnecessary x T x[1] TRUE x pi[1] 4.141593Uses: Can perform operationson setsRP( 1.96 Z 1.96) I( 1.96 z 1.96)f (z)dz integrate(function(z){(-1.96 z&z 1.96)*dnorm(z)}, lower -Inf, upper Inf)[1] 0.9499932 with absolute error 8.2e-05J. D. HabigerR
Operating CharacteristicsFunctionsGraphicsCreating FunctionsConclusionObjectsClassesData StructureMatrixOperations are performed element-wise unlessotherwise specified x -matrix(c(1,2),ncol 1) x[,1][1,]1[2,]2 y[,1] [,2][1,]11 y* xError in y * x : non-conformable arrays y%*%x[,1][1,]3J. D. HabigerR
Operating CharacteristicsFunctionsGraphicsCreating FunctionsConclusionObjectsClassesData StructureLists and ArraysLists vs. Arrays x -list(T) y -array(T) x 1Error in y 1 : non-numeric argument to binary operator y 1[1] 2J. D. HabigerR
Operating CharacteristicsFunctionsGraphicsCreating FunctionsConclusionObjectsClassesData StructureData FramesData frames useful for statistical modeling data.frame(matrix(1:10,5), X3 c(T,T,F,F,F))X1 X2X31 1 6 TRUE2 2 7 TRUE3 3 8 FALSE4 4 9 FALSE5 5 10 FALSEJ. D. HabigerR
Operating CharacteristicsFunctionsGraphicsCreating FunctionsConclusionWhat are functionsUsing FunctionsOperating CharacteristicsFunctionsGraphicsCreating FunctionsConclusionJ. D. HabigerR
Operating CharacteristicsFunctionsGraphicsCreating FunctionsConclusionWhat are functionsUsing FunctionsWhat are functionsFunctions are objects belonging to the class “function”. function(input)outputInput and output for functions can be any objectJ. D. HabigerR
Operating CharacteristicsFunctionsGraphicsCreating FunctionsConclusionWhat are functionsUsing FunctionsHelpTo find a function: help.search("description")To learn how to use a function: help(function name)help.search("linear model")help(glm)J. D. HabigerR
Operating CharacteristicsFunctionsGraphicsCreating FunctionsConclusionWhat are functionsUsing Functionshelp(glm)glm {stats}R DocumentationFitting Generalized Linear ModelsDescriptionglm is used to fit generalized linear models, specified by giving a symbolic description of the linear predictor and a description of the error distribution.Usageglm(formula, family gaussian, data, weights, subset,na.action, start NULL, etastart, mustart, offset,control list(.), model TRUE, method "glm.fit",x FALSE, y TRUE, contrasts NULL, .).Argumentsformula an object of class "formula" (or one that can be coerced to that class): a symbolic description of the model to be fitted. The details of model specificationare given under ‘Details’.familya description of the error distribution and link function to be used in the model. This can be a character string naming a family function, a family functionor the result of a call to a family function. (See family for details of family functions.)dataan optional data frame, list or environment (or object coercible by as.data.frame to a data frame) containing the variables in the model. If not found indata, the variables are taken from environment(formula), typically the environment from which glm is called.weights an optional vector of ‘prior weights’ to be used in the fitting process. Should be NULL or a numeric vector.ValueJ. D. HabigerR
Operating CharacteristicsFunctionsGraphicsCreating FunctionsConclusionWhat are functionsUsing FunctionsExample: glm model glm(log(y) x*z) modelCall:glm(formula log(y) x * z0.1329Degrees of Freedom: 10 Total (i.e. Null); 7 ResidualNull Deviance:101.6Residual Deviance: 72.47AIC: 61.95J. D. HabigerR
Operating CharacteristicsFunctionsGraphicsCreating FunctionsConclusionWhat are functionsUsing FunctionsMore glm summary(model)Call:glm(formula log(y) x * z)Deviance x1.7335Coefficients:Estimate Std. Error t value Pr( t )(Intercept) -0.482561.38929 -0.3470.739x-0.127411.16377 4941.5650.162(Dispersion parameter for gaussian family taken to be 10.35218)Null deviance: 101.611 on 10 degrees of freedomResidual deviance: 72.465 on 7 degrees of freedomAIC: 61.954Number of Fisher Scoring iterations: 2Try also plot(model), residuals(model),coefficients(model), anova(model).J. D. HabigerR
Operating CharacteristicsFunctionsGraphicsCreating FunctionsConclusionWhat are functionsUsing FunctionsNon Standard FunctionsFunctions for relatively new methodology may not bein the base package.They may exist in another package.Thousands of packagesCan be installed from the file menu for Windows GUI.Some packages come with their own GUI’sRattle: Gnome Cross Platform GUI for Data Mining using RJ. D. HabigerR
Operating CharacteristicsFunctionsGraphicsCreating FunctionsConclusionWhat are functionsUsing FunctionsRattleJ. D. HabigerR
Operating CharacteristicsFunctionsGraphicsCreating FunctionsConclusionWhat are functionsUsing FunctionsOperating CharacteristicsFunctionsGraphicsCreating FunctionsConclusionJ. D. HabigerR
Operating CharacteristicsFunctionsGraphicsCreating FunctionsConclusionBasic Graphics3d graphicsHistograms hist(rnorm(n 100,mean 5,sd 1),main "Histogram of X",xlab "x", color "blue")1050Frequency1520Histogram of X2345xJ. D. HabigerR67
Operating CharacteristicsFunctionsGraphicsCreating FunctionsConclusionBasic Graphics3d 04051032EXPRESSION LEVEL7020 boxplot(.)bwGENE 1bwGENE 2J. D. HabigerbwGENE 3RbwGENE 4bwGENE 5
Operating CharacteristicsFunctionsGraphicsCreating FunctionsConclusionBasic Graphics3d graphicsPlot Function 15510 0rnorm(11, mean ( 5:5) 2)2025 plot(-5:5, rnorm(11,mean (-5:5) 2), pch 1:11,col 1:11,lwd 3) 4 202 5:5J. D. HabigerR4
Operating CharacteristicsFunctionsGraphicsCreating FunctionsConclusionBasic Graphics3d graphicsPlot Function cont. 15510 0rnorm(11, mean ( 5:5) 2)2025 curve(x 2,xlab "",ylab "",add T,lwd 3) 4 202 5:5J. D. HabigerR4
Operating CharacteristicsFunctionsGraphicsCreating FunctionsConclusionBasic Graphics3d graphicsPlot Function cont.Hit return to get a new plot plot(model)Waiting to confirm page changeResiduals vs Leverage 6211 0 110 0.53 Cook's distance 2Std. Pearson resid.0.510.000.050.100.150.20Leverageglm(y x)J. D. HabigerR0.250.30
Operating CharacteristicsFunctionsGraphicsCreating FunctionsConclusionBasic Graphics3d graphicsmultiple plots1.5splitregular0.0discoveries3.0BH FDR method0.050.100.150.20alpha0.80.4discoveriesHolm FWER method0.0par(mfrow phaJ. D. HabigerR0.20
Operating CharacteristicsFunctionsGraphicsCreating FunctionsConclusionBasic Graphics3d graphicsSyntax for 3d PlottingThree main arguments for many 3d plot functions (theexception is scatter plot-type functions)X 0 is vector of length mY 0 is a vector of length nZ 0 (zij ) is an m n matrix x0 -1:5 y0 -1:3 z0 -x%o%y z0[,1] [,2] [,3][1,]123[2,]246[3,]369[4,]4812[5,]51015The pseudo syntax generic3dplot(x x0,y y0,z z0, option1, option2, .)J. D. HabigerR
Operating CharacteristicsFunctionsGraphicsCreating FunctionsConclusionBasic Graphics3d graphicsContour Plot contour(z myZ0, x myX0,y myY0,xlab 0.61.45τ1.550.41.51.651.7 1.0 0.50.01.750.5θJ. D. Habiger1.81.61.551.51.41.751.81.70.21.61.65R1.0
Operating CharacteristicsFunctionsGraphicsCreating FunctionsConclusionBasic Graphics3d graphicsAnother Contour Plot 0.41.40.21.3 1.0 0.50.00.5θJ. D. HabigerR1.0
Operating CharacteristicsFunctionsGraphicsCreating FunctionsConclusionBasic Graphics3d graphicsImage Plot image(.)0.20.4τ0.60.81.0Efficiency 1.0 0.50.00.5θJ. D. HabigerR1.0
Operating CharacteristicsFunctionsGraphicsCreating FunctionsConclusionBasic Graphics3d graphicsPerspective Plot persp(.)Try also persp3d() in the rgl package.Efficiency1.81.7Eff1.61.51.4 1.01.0 0.50.80.0etth0.6a0.40.50.21.0J. D. HabigerRtau
Operating CharacteristicsFunctionsGraphicsCreating FunctionsConclusionThe BasicsMore Complex?Operating CharacteristicsFunctionsGraphicsCreating FunctionsConclusionJ. D. HabigerR
Operating CharacteristicsFunctionsGraphicsCreating FunctionsConclusionThe BasicsMore Complex?Defining a FunctionThe pseudo syntax is myfunction -function(x defaultx, y defaulty,.){output -operations on x,yreturn(output)} mfunction(x,y)outputYou can use any existing objects in a functionObjects created within a function will not remain in theworkspaceJ. D. HabigerR
Operating CharacteristicsFunctionsGraphicsCreating FunctionsConclusionThe BasicsMore Complex?Example with Loopan an 1 an 21 1 2 3 5 8 13 21 34 55 . fibonacci -function(n 100){y -c(1,1)for(i in 1:n){y -c(y,sum(y))y -y[-1]}return(y[2])} fibonacci() fibonacci()[1] 9.273727e 20 fibonacci(1001)/fibonacci(1000)[1] 1.618034 yError: object ’y’ not foundJ. D. HabigerR
Operating CharacteristicsFunctionsGraphicsCreating FunctionsConclusionThe BasicsMore Complex?Another Fibonacci fibonacci2 -function(n 10){y -rep(1,n)for(i in 3:n){y[i] -y[i-1] y[i-2]}return(y)} fibonacci2(11)[-1]/fibonacci(10)[1] 1.000000 2.000000 1.500000 1.666667 1.600000 1.625000 1.615385 1.619048[9] 1.617647 1.618182J. D. HabigerR
Operating CharacteristicsFunctionsGraphicsCreating FunctionsConclusionThe BasicsMore Complex?Plot of Golden Ratio1.01.21.4an an 11.61.82.0Golden Ratio246nJ. D. HabigerR810
Operating CharacteristicsFunctionsGraphicsCreating FunctionsConclusionThe BasicsMore Complex?Example with Roots & IntegrationMy goal: Find value α s.t.Z 1h(α) g(p, α)dp .950whereg(p, α) nXI (L(x, α) p U(x, α)) Pr(X x p)x 0J. D. HabigerR
Operating CharacteristicsFunctionsGraphicsCreating FunctionsConclusionThe BasicsMore Complex?Code for ExampleCode closely mimics what I want to do! U -function(x,alpha){.return(output)} L -function(x,alpha){.return(output)} g -function(p,alpha){return(sum(I(L(0:n,alpha) p&&p U(0:n,alpha))dbinom(0:n,p,n)))} h(alpha) -function(p,alpha){return(integrate(g(p,alpha), lower 0, upper 1))[[1]]} uniroot(h(alpha)-.95, interval c(0,1))[1] .034J. D. HabigerR
Operating CharacteristicsFunctionsGraphicsCreating FunctionsConclusionThe BasicsMore Complex?Optimizationoptim(), constrOptim(), nlm(): most have severalmethods to choose from y -rnorm(50,sd 5,mean 10) l -function(parms){-log(prod(dnorm(y,sd parms[1],mean parms[2])))} optim(c(20,-5),l) par[1] 5.292001 9.462908 value[1] 154.2492 countsfunction gradient61NA convergence[1] 0 messageNULLWarning message:In dnorm(x, mean, sd, log) : NaNs producedJ. D. HabigerR
Operating CharacteristicsFunctionsGraphicsCreating FunctionsConclusionThe BasicsMore Complex?Snags with FunctionsR is not efficient with loopsapply() function helps.C(), .Fortran()Functions like optim(), integrate(), uniroot() requirethat the function to be integrated/optimized/solvedallow for vector inputs and ouputsFirst just try inputting a vector.Otherwisemyfunction -Vectorize(myfunction)J. D. HabigerR
Operating CharacteristicsFunctionsGraphicsCreating FunctionsConclusionLoose EndsRemarksOperating CharacteristicsExisting FunctionsGraphicsCreating FunctionsConclusionJ. D. HabigerR
Operating CharacteristicsFunctionsGraphicsCreating FunctionsConclusionLoose EndsRemarksScriptingUseful functionsgetwd(), setwd(), read.table(), write.table(),read.csv(), write.csv()paste(), strsplit(), cat(), parse().Python()call()J. D. HabigerR
Operating CharacteristicsFunctionsGraphicsCreating FunctionsConclusionLoose EndsRemarksOther Useful Functions/Softwarepdf(), postscript(), dev.off()debug()cbind(), rbind()names(), dim(), colnames(), rownames()solve()Bioconductor (www.bioconductor.org)J. D. HabigerR
Operating CharacteristicsFunctionsGraphicsCreating FunctionsConclusionLoose EndsRemarksRemarksSAS can do anything R can doR can do anything SAS can doBefore you start coding.See if the wheel has been inventedJ. D. HabigerR
Operating CharacteristicsFunctionsGraphicsCreating FunctionsConclusionLoose EndsRemarksReferencesNew R GUI: is this the wave of the future? StatisticalModeling, Causal Inference, and Social Science,2009. Andrew t.org/doc/bib/R-books.htmlSoftware for Data Analysis: Programming with R,John ChambersThese slides available at:http://casa.okstate.edu/cas2/HabigerJ. D. HabigerR
Operating CharacteristicsFunctionsGraphicsCreating FunctionsConclusionLoose EndsRemarksTHANK YOUJ. D. HabigerR
Gentemandevelop R-It mimics S S S R 1980 1990 2000 2010 GNU FSF 2000: R version 1.0 Released as a GNU project 2010: R version 10.0 Released as a GNU project 1983: GNU Manefesto-Richard Stallman-All programs should be free 1985: Free Software Foundation 1996: Ihakaand Gentleman get GNU General Public License for R- Copyleft_ íõôñW Zu