Transcription
European Journal of Science and Theology, October 2014, Vol.10, Suppl.1, 143-148BIG DATA ANALYSISAndrej Trnka*University of Ss. Cyril and Methodius, Faculty of Mass Media Communication, Nám. J. Herdu 2,91701 Trnava, Slovak Republic(Received 16 June 2014, revised 28 July 2014)AbstractThe aim of this paper is to highlight the ever-increasing volume of data and methods ofanalysis. Phenomenon that is gaining prominence is called „Big Data‟. The amount ofdata is increasing over time and obtaining important data can take days. Problems of BigData is mainly concerned with the non-user data (not inputed by the user), but loaded byvarious automated means (e.g. data from security cameras).Keywords: HADOOP, church, volume, velocity, variety1. Introduction to Big DataBig data is data that exceeds the processing capacity of conventionaldatabase systems. The data is too big, moves too fast, or doesn‟t fit the stricturesof your database architectures. To gain value from this data, we must choose analternative way to process it [1].The first definition of Big Data comes from Merv Adrian: “Big dataexceeds the reach of commonly used hardware environments and software toolsto capture, manage, and process it within a tolerable elapsed time for its userpopulation” [2].Another good definition is given by the McKinsey Global Institute: “Bigdata refers to data sets whose size is beyond the ability of typical databasesoftware tools to capture, store, manage and analyse” [3].These definitions imply that what qualifies as big data will change overtime as technology advances. What was historically big data or what is big datatoday won‟t be big data tomorrow. This aspect of the big data definition is thatsome people find unsettling. The preceding definitions also imply that whatconstitutes big data can vary by industry, or even organization, if the tools andtechnologies in place vary greatly in capability [4].We should not be surprised that companies are tracking and analysing ourdata.We rarely hear of theologians talking about what data can tell us aboutfaith needs of parishioners. If big data is being used to guide us in our shoppinghabits, it could also be used to guide people to a deeper commitment to God,*E-mail: andrej.trnka@ucm.sk
Trnka/European Journal of Science and Theology 10 (2014), Suppl.1, 143-148faith life and community [5]. In some churches that can leverage the analyticalinsights from data sets in the community and partner them up with the ongoingtrends in their congregation, the larger data set can help in crafting newministries and developing a strategic vision [Church and “Big” data/].Big data is not a single technology but a combination of old and newtechnologies that helps companies gain actionable insight. Therefore, big data isthe capability to manage a huge volume of disparate data, at the right speed, andwithin the right time frame to allow real-time analysis and reaction. Big data istypically broken down by three characteristics [6]:Volume - how much data,Velocity - how fast that data is processed,Variety - the various types of data.These characteristics are called the three Vs of Big Data and a number ofvendors have added more Vs to their own definitions.Volume is the first thought that comes with big data: the big part. Someexperts consider Petabytes the starting point of big data. As we generate moreand more data, we are sure this starting point will keep growing. However,volume in itself is not a perfect criterion of big data, as we feel that the other twoVs have a more direct impact.Velocity refers to the speed at which the data is being generated or thefrequency with which it is delivered. Think of the stream of data coming fromthe highways‟ sensors in the Los Angeles area, or the video cameras in someairports that scan and process faces in a crowd. There is also the click streamdata of popular e-commerce web sites.Variety is about all the different data and file types that are available. Justthink about the music files in the iTunes store (about 28 million songs and over30 billion downloads), or the movies in Netflix (over 75,000), the articles in theNew York Times web site (more than 13 million starting from 1851), tweets(over 500 million every day), foursquare check-ins with geolocation data (overfive million every day), and then you have all the different log files produced byany system that has a computer embedded. When you combine these three Vs,you will start to get a more complete picture of what Big Data is all about [7].Other authors explain the fourth V as Veracity.Most of Big Data comes from sources outside our control and thereforesuffers from significant correctness or accuracy problems. Veracity representsboth the credibility of the data source as well as the suitability of the data for thetarget audience [8].LinkedIn, Netflix, Facebook, Twitter, Expedia, national and local politicalcampaigns, and dozens of other organizations are all generating enormouseconomic, social, and political value [9].Some examples of Big Data [8, p. 2]:social media text,cell phone locations,channel click information from set-top box,144
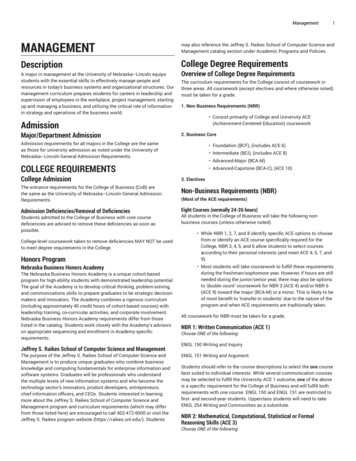
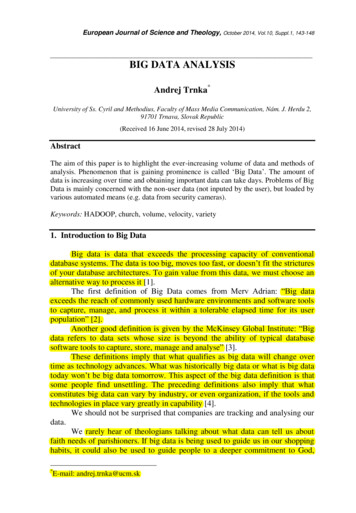
Big Data analysisweb browsing and search,product manuals,communications network events,Call Detail Records (CDRs),Radio Frequency Identification (RFID) tags,maps,traffic patterns,weather data,mainframe logs.2. Architecture for Big DataMany companies already have large amounts of archived data, perhaps inthe form of logs, but not the capacity to process it. Assuming that the volumes ofdata are larger than those conventional relational database infrastructures cancope with, processing options break down broadly into a choice betweenmassively parallel processing architectures – data warehouses or databases suchas Greenplum and Apache Hadoop-based solutions. Typically, data warehousingapproaches involve predetermined schemas, suiting a regular and slowlyevolving dataset. Apache Hadoop, on the other hand, places no conditions on thestructure of the data it can process [1, p. 4].Figure 1. Hadoop with HDFS and MapReduce.Hadoop is a platform for distributing computing problems across anumber of servers. First developed and released as open source by Yahoo, itimplements the MapReduce approach pioneered by Google in compiling itssearch indexes. Hadoop‟s MapReduce involves distributing a dataset amongmultiple servers and operating on the data: the „map‟ stage. The partial resultsare then recombined: the „reduce‟ stage. To store data, Hadoop utilizes its owndistributed filesystem, HDFS, which makes data available to multiple computingnodes. A typical Hadoop usage pattern involves three stages (Figure 1):145
Trnka/European Journal of Science and Theology 10 (2014), Suppl.1, 143-148loading data into HDFS,MapReduce operations, andretrieving results from HDFS.This process is by nature a batch operation, suited for analytical or noninteractive computing tasks. Because of this, Hadoop is not itself a database ordata warehouse solution, but can act as an analytical adjunct to one. One of themost well-known Hadoop users is Facebook, whose model follows this pattern.A MySQL database stores the core data. This is then reflected into Hadoop,where computations occur, such as creating recommendations for you based onyour friends‟ interests. Facebook then transfers the results back into MySQL, foruse in pages served to users [1, p. 5].3. Get results from Big DataThe first question that we need to ask ourselves before we dive into BigData analysis is what problem are we trying to solve? We may not even be sureof what we are looking for. We have lots of data that we think we can getvaluable insight from. And certainly, patterns can emerge from that data beforewe understand why they are there.If we think about it, we must to have an idea of what we‟re interested in.For instance, are we interested in predicting customer behaviour to preventchurn? Do we want to analyse the driving patterns of our customers forinsurance premium purposes? Are we interested in looking at our system logdata to ultimately predict when problems might occur? Regarding the church,big data techniques can be used for storage of large amounts of data, for exampleaudio or video demand, old church indexes (birth, marriage, death) and theirscanned pictures. Big data analysis can be used for advanced search methods inthis unstructured data. The kind of high-level problem is going to drive theanalytics we decide to use. Alternately, if we are not exactly sure of the businessproblem we are trying to solve, maybe we need to look at areas in your businessthat needs improvement. Even an analytics-driven strategy – targeted at the rightarea – can provide useful results with big data [6, p. 142]. Table 1 shows typesof Big Data analysis.Table 1. Big Data analysis.DescriptionSlicing and dicing of data, reporting, simpleBasic analytics for insightvisualizations, basic monitoring.Advanced analytics forMore complex analysis such as predictive modelinginsightand other pattern-matching techniques.Operationalized analyticsAnalytics become part of the business process.Monetized analyticsAnalytics are utilized to directly drive revenue.Analysis TypeBasic analytics can be used to explore your data, if you‟re not sure whatyou have, but you think something is of value. This might include simple146
Big Data analysisvisualizations or simple statistics. Basic analysis is often used when you havelarge amounts of disparate data.Advanced analytics provides algorithms for complex analysis of eitherstructured or unstructured data. It includes sophisticated statistical models,machine learning, neural networks, text analytics and other advanced datamining techniques. Among its many use cases, advanced analytics can bedeployed to find patterns in data, prediction, forecasting, and complex eventprocessing.When we operationalize analytics, we make them part of a businessprocess. For example, statisticians at an insurance company might build a modelthat predicts the likelihood of a claim being fraudulent. The model, along withsome decision rules, could be included in the company‟s claims-processingsystem to flag claims with a high probability of fraud. These claims would besent to an investigation unit for further review. In other cases, the model itselfmight not be as apparent to the end user. For example, a model could be built topredict customers who are good targets for upselling when they call into a callcentres. The call centres agent, while on the phone with the customer, wouldreceive a message on specific additional products to sell to this customer. Theagent might not even know that a predictive model was working behind thescenes to make this recommendation.Monetizing analytics can be used to optimize a business in order to createbetter decisions and drive bottom- and top-line revenue. However, big dataanalytics can also be used to derive revenue above and beyond the insights itprovides just for one own department or company. We might be able toassemble a unique data set that is valuable to other companies, as well. Forexample, credit card providers take the data they assemble to offer value-addedanalytics products. Likewise, with financial institutions. Telecommunicationscompanies are beginning to sell location-based insights to retailers. The idea isthat various sources of data, such as billing data, location data, text messagingdata, or web browsing data can be used together or separately to make inferencesabout customer behaviour patterns that retailers would find useful. As aregulated industry, they must do so in compliance with legislation and privacypolicies [6, p. 143].4. Big Data implementationThere are several ways to store larger amounts of data [10]. There is nosingular method to deploy a business intelligence solution to answer uniquecompany questions, but there is an approach to take advantage of Big Datawhich minimizes risk and increases the likelihood of a successful outcome.Big Data projects are difficult and need know-how and experience to besuccessful. The implementation method of Big Data consists of 8 (or 9) steps[The Server Labs, Implementing Big Data, big-data.html]:1. begin with stakeholders and consider culture,147
Trnka/European Journal of Science and Theology 10 (2014), Suppl.1, 143-1482.3.4.5.6.7.8.9.find data stewards,set clear goals,create the plan,select the right strategy and tools,establish metrics,deploy the technology,make big data little [CRMSearch. The Business Case for Big ion.php],design for Continuous Process Improvement (CPI).5. ConclusionsEighty percent of the world‟s data is unstructured, and most businesses donot even attempt to use this data to their advantage. The trend of Big Data isgenerating new opportunities and new challenges for businesses acrossindustries.The churches have a lot of unstructured data. The data should be stored aanalysed by Big Data techniques and method. This approach is helpful for betteranalyse.Hadoop is scalable platform for ingesting Big Data and preparing it foranalysis. Using Hadoop in Big Data can reduce time to analysis by hours or evendays.References[1] ***, Big Data Now, O‟Reilly Media, Sebastopol, 2012, 3.[2] radatamagazine.com/v11n01/Features/Big-Data.[3] ***, Big Data: The Next Frontier for Innovation, Competition, and Productivity,McKinsey Global Institute, New York, 2011, 1.[4] B. Franks, Taming the Big Data Tidal Wave, New Jersey, John Wiley & Sons, NewYork, 2012, 336.[5] M.D. Gutzler, Dialog: A Journal of Theology, 53(1) (2014) 23-29.[6] J. Hurwitz, A. Nugent, F. Halper and M. Kaufman, Big Data for Dummies, JohnWiley & Sons, New York, 2013, 15.[7] P. Zadrozny and R. Kodali, Big Data Analytics Using Splun, Apress, New York,2013, 353.[8] A. Sathi, Big Data Analytics: Disruptive Technologies for Changing the Game, MCPress, Boise, 2012, 4.[9] K. Davis and D. Patterson, Ethics of Big Data, O‟Reilly Media, city California,2012, 1.[10] R. Halenar, Appl. Mech. Mater., 229-231 (2012) 2125-2129.148
Opajcnuté z knihy Big data for dummies. . By Peter Zadrozny, Raghu Kodali. Celé skopírované z knihy Big Data Analytics . Skopírované z knihy Ethics of Big Data. Okopírované z knihy Big Data Analytics: Disruptive Technologies for Changing the Game, strana 4. Big Data analysis . 145 . web browsing and search,