Transcription
Analytics InsightsEducationAn introduction to Freddie KAgency CMBSFebruary 2022AUTHORSLoy WengYield Book Mortgage Research212-314-1125loy.weng@lseg.comLuke LuYield Book Mortgage Research212-314-1113an.lu@lseg.comOverviewFreddie Mac Multifamily K-deals (Freddie K) is one of the major agency CMBSproducts, with 321 billion outstanding balance as of December 2021. Theunderlying loans are typically 10-year fixed rate or floating rate loans, with a30-year amortization period, backed by multifamily properties. Fixed rate loansusually have a strong call protection and muted prepayment activities, whilefloating rate loans have limited prepayment protection and higher prepaymentspeeds. Freddie K deals include senior tranches guaranteed by Freddie Macand unguaranteed subordinate tranches, which are subject to credit risk.This paperftserussell.com provides an introduction to the Freddie K product, including loancharacteristics, underwriting, and securitization; discusses Freddie K loan performance, prepayment behavior, andprepayment drivers; compares Freddie K with GNPL and FN DUS, the two other major agencyCMBS products; gives a brief summary of Small Balance Loans (SBL), which is anotherfrequently mentioned Freddie Mac multifamily program.An LSEG Business1
ContentsMultifamily fundamentals4Freddie K summary5Freddie K underwriting7Freddie K performance8Securitization9Deal structure11SOFR Transition13Call protection13Freddie K historical prepayment speeds14COVID pandemic impact15Prepayment behavior and drivers16Call protection provision16Property price appreciation17Loan size18DSCR and LTV19Unemployment rate20Comparison with GNPL and FN DUS21Loan term and collateral21Guarantee21Prepayment risk22Credit performance23Freddie SBL Summary23SBL underwriting24Securitization and deal structure25Call protection and prepayment speeds26Conclusion27References28ftserussell.com2
Executive summary Multifamily fundamental has been resilient through the COVID pandemic. Freddie Mac underwrites and approves Freddie K loans in house,contributing to strong credit performance historically. Freddie K fixed rate loans typically have the strongest call protection amongall major agency CMBS products, with lengthy defeasance or yieldmaintenance period, resulting in muted prepayment activities. Freddie K floating rate loans have a relatively weak call protection with lowpercentage penalty points, and hence much higher prepayment speeds. Prepayment and default behavior of Freddie K loans are also found to becorrelated with property price appreciation, unemployment rate, loan size,DSCR, and LTV. Freddie K senior tranches are guaranteed and have stable cash flows, whilethe unguaranteed subordinate tranches can provide high risk-adjusted returnopportunity.ftserussell.com3
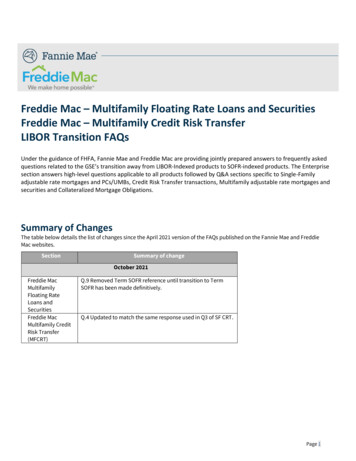
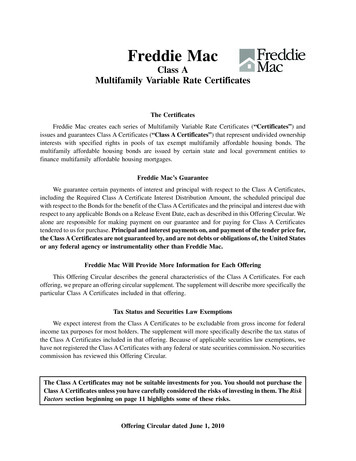
Multifamily fundamentalsWhile some commercial real estate sectors such as Hotel and Retail sufferedduring the pandemic, multifamily has shown strong resilience and significantlyappreciated in the last two years (Exhibit 1). Post Global Financial Crisis (GFC),multifamily supply, especially in the affordable rental segment, has beenrestricted with new construction below the level to keep up with populationgrowth. The COVID pandemic boosted the demand for more living space, aswork-from-home became a new norm. In addition, rapidly rising home pricestilted the affordability scale toward rental (vs purchase).Vacancy rates in multifamily marketsare at record lows, driving rentgrowth to double-digit increase in2021.Coming into 2022, strong job growth and economic recovery post pandemic maycontinue to keep rental demand high and drive up the rental rate.Over the last decade, multifamily has outperformed most other commercial realestate property sectors, with limited cash flow volatility. As a result, agencyCMBS, backed by multifamily loans, has seen tremendous growth during thatperiod.In this paper, we will introduce Freddie K, one of the major agency CMBSproducts, which has attracted investors’ interest with its stellar historical creditperformance.Exhibit 1 – CRE Property Price Appreciation (Since 2019)Property Price Appreication30%25%20%15%10%5%0%MultifamilyAll Property TypesSource: FRED, Yield Book (December 2021).ftserussell.com4
Freddie K summaryWith a mandate to support affordable housing and provide financing liquidity tothe rental market, Freddie Mac issues multifamily loans backed by occupied,income-producing multifamily properties.Since 1993, Freddie Mac has provided 808 billion in financing for approximately100,000 multifamily properties (as of 9/30/21), representing 11.8 millionapartment units [1].Freddie Mac Multifamily K-deals (Freddie K), since its inception in 2009, hasdominated the Freddie Mac multifamily lending program with a total outstandingbalance of about 321 billion.Exhibit 2 shows the profile of new issuance of Freddie K loans in the last threeyears and the outstanding universe as of year-end 2021. The average note rateis 2.8-3.5%, the average DSCR is 2.0x-2.4x, the average LTV is 66-68%, and themedian loan size is 15-18 million for recent new issuances. 75% of theoutstanding loans are paying fixed rate, although floating rate loan issuance hasgained momentum in recent years (Exhibit 3), amounting to 55% of the issuancevolume in 2021. Freddie K loans typically have call protections to preventprepayment. The prevailing call protection provision is a combination of lockoutand defeasance among the outstanding loan universe.Exhibit 2 – Snapshot of Freddie K New Issuance and Outstanding UniverseNew 5321.1Avg Note Rate (%)3.53.02.83.5Avg Loan Term (Months)114116112115Avg Amortization Term (Months)30327627528750596045Avg DSCR2.0x2.4x2.3x1.8xAvg LTV66.567.967.073.0Median Loan Size( M)17.615.717.114.3% Fixed Rate Loans68.863.245.075.0% w./ Lockout Defeasance63.356.342.870.2% w./ Yield Maintenance5.55.24.24.8% w./ Percentage Penalty39.541.656.930.9UPB ( bn)Avg IO Term (Months)Freddie K loans typically have largeloan size, low LTVs ( 70%) and highDSCRs ( 2.0).Source: Freddie Mac, Yield Book (December 2021).ftserussell.com5
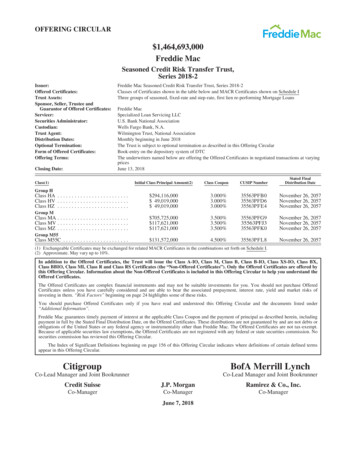
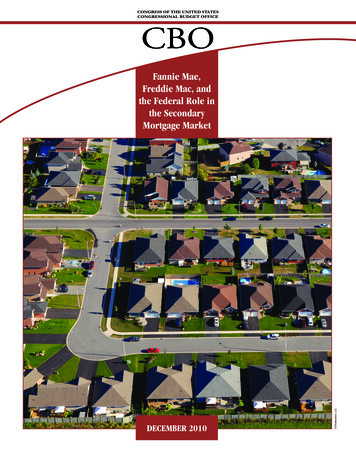
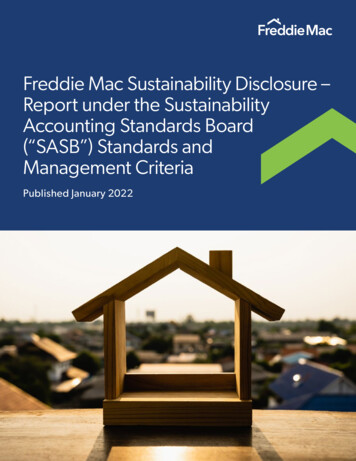
Exhibit 3 – Freddie K issuance by rate type (2009-2021)Fixed RateFloating Rate100%90%80%70%60%50%40%30%20%10%0%2009 2010 2011 2012 2013 2014 2015 2016 2017 2018 2019 2020 2021Source: Freddie Mac (December 2021).Through December 2021, Freddie Mac has issued a total of 458 K deals with 478 billion in combined issuance across 23,020 loans [2].Exhibit 4 shows the steady growth of Freddie K deal issuance over time from2009 to 2021.Exhibit 4 – Freddie K Issuance by Year70The annual issuance volumeexperienced dramatic growth postGFC, but has leveled out since 2018with 2021 issuance 3% higher thanthat of 2020.60Issuance ( bn)504030201002009 2010 2011 2012 2013 2014 2015 2016 2017 2018 2019 2020 2021Source: Freddie Mac (December 2021).ftserussell.com6
Freddie K underwritingFreddie Mac buys loans from a group of approved multifamily lenders (Optigolender network). The top five lenders (CBRE, Berkadia, JLL, Walker & Dunlop,and Berkeley Point Capital) generated more than 60% of the total originationvolume [2].K-Deals are backed by newly acquired mortgages underwritten to Freddie Mac’sunderwriting standards. While the origination and servicing are outsourced to thethird-party lenders/servicers, credit reviews and approvals are completed byFreddie Mac. This disciplined credit practice may have contributed to the strongperformance of Freddie multifamily loans historically.Freddie Mac retains underwritingand credit approval in house formultifamily loans, contributing tostrong credit performance.Eligible borrowers include limited partners, corporations, limited liabilitycompanies, or tenancy in common. If loan size is greater than 5MM, theborrower must be a Single Purpose Entity (SPE). Borrower may be a SingleAsset Entity (SAE) for loan size under 5MM.Eligible property types include multifamily, student housing, senior housing,manufactured housing, cooperative housing and affordable housing.Loan proceeds can be used for acquisition or refinancing. However, no cash-outis allowed for the latter.As part of the underwriting criteria, the required minimum DSCRs for theproperties generally range from 1.25x to 1.40x, and the maximum LTVs rangefrom 65% to 80%, depending on loan terms and amortization schedules. Fullterm IO loans (comparing to amortizing and partial-term IO loans) have tighterLTV/DSCR requirements, and shorter maturity term loans require higher DSCRand lower LTV (Exhibit 5).Exhibit 5 – Underwriting criteria for Freddie K V 5-Year and 7-Year Term1.30x75%1.30x75%1.40x65%7-Year Term1.25x80%1.25x80%1.35x70% 7-Year Term1.25x80%1.25x80%1.35x70%Minimum DSCRs and maximumLTVs are set based on loan termsand IO terms.Source: Freddie Mac (December 2021).Freddie K loans are geographically distributed with top MSAs includingWashington DC, Dallas, Atlanta, Houston, and Denver.ftserussell.com7
Freddie K performanceFreddie K loans historically have a very low 30 day delinquency rate, muchlower than the other two major agency CMBS products – GNMA Project Loans(GNPL) and FN DUS (Exhibit 6). Both GNPL and FN DUS saw spike ofdelinquency rates at the onset of the pandemic, while Freddie K onlyexperienced a minor pick-up in 2020.Exhibit 6 – 30 day Delinquency by Agency CMBS Products30 day delinquency rate -21Jul-21Dec-210GNPLFN DUSFreddie KSource: Freddie Mac and Yield Book (December 2021).Freddie Mac published recently the historical default data for multifamily loans(Exhibit 7). From 2006 to 2021, default rates and loss rates were mostly muted,with the highest default rates seen during GFC (1.59% in 2006 and 1.38% in2008), and the peak loss rate of 42 basis points (bps) in 2006. Since 2014(including the pandemic period), the default rates have been no more than 4bpsand the loss rates have stayed below 1bp. Loan qualities, marked by DSCR andLTV, have also been improving over the last few years.According to the Freddie Mac Multifamily Loan Performance Database (MLPD)[3], which covers Freddie K loans, SBL loans, and whole loans, a total of 102properties were disposed since 1994 (as of 2021 Q3) with total value of 897MM,resulting in a total credit loss of 243MM and an average loss severity of 27%.ftserussell.com8
Exhibit 7 – Freddie Mac Multifamily Loan Performance# of LoansTotal Balance( MM)AvgLTV (%)AvgDSCRAvgWAC (%)UPB 21Q3( 72.023.342,7650.00%0.00%VintageSource: Freddie Mac (December 2021).Freddie K loans have a good track record historically. Some highlights include(as of December 2021) [2] 99.97% of loans current Only 10 loans in special servicing ( 7 bps of outstanding balance) Only 1 loan in REO ( 1 bp of outstanding balance) Historical total incurred loss of 40 million ( 1 bp of total issuance)Freddie K loans have a pristinecredit performance profile.SecuritizationAlmost all multifamily mortgage loans that Freddie Mac purchases are intendedfor securitization. The Freddie K-Series, or K-Deal, is one of the securitizationprograms sponsored by Freddie Mac (or “Freddie”) to securitize multifamily loansand shift some credit risk from the taxpayers to the private sector. For thesecuritization, a number of Freddie K loans (average about 40), with geographic,note rate, and quality diversity, are pooled into a trust that issues multipletranches of various duration and risk profiles. Senior tranches are guaranteed byFreddie Mac, while the subordinate tranches are unguaranteed with credit riskexposure. The K-Deal is an efficient financing vehicle that ensures liquidity andtight spreads for senior tranches (the lion’s share of the deal), while removingftserussell.com9
first loss credit risk. It reduces the overall funding cost and makes the Freddie Kloans more affordable to multifamily borrowers.Exhibit 8 shows the K-Deal issuance volume, average deal size, and averagenumber of loans per deal in the past three years. The annual issuance volumehas been consistently around 60-65 billion, with the average deal size slightlybelow 1 billion.Freddie K-Deal is an efficientfunding vehicle with consistentannual issuance over 60 billion inthe last three years.Exhibit 8 – Snapshot of Freddie K new issuance201920202021Total Issuance ( bil)626264Avg. Deal Size ( M)947981948394340Avg. # of loansSource: Freddie Mac, Yield Book (December 2021).Exhibit 9 shows a complete list of K-series securitization in terms of loan type,number of deals and outstanding balance. K-000 (10-year loans), K-F00(Floating rate loans), and K-700 (7-year loans) are by far the largest three Kseries.Exhibit 9 – K-Series by Collateral TypeK-SeriesCollateral Type# of DealsUPB ( bn)K-00010-year loans139141.37K-F00Floating rate loans12769.71K-7007-year loans5744.37K-15015-year loans2316.67K-5005-year loans1512.70K-S00Senior housing146.89K-W00Workforce housing105.73K-J00Supplemental loans354.85K-C00Non-Standard prepayment terms74.59K-L00Large loans63.85K-G00Green Advantage loans63.36K-XYZSingle-Asset-Single-Borrower loans93.07K-LU0Lease-up loans32.03K-X00Seasoned loans41.34K-SG0Sustainable loans20.58K-P00No-subordination loans50.02Source: Freddie Mac (December 2021).ftserussell.com10
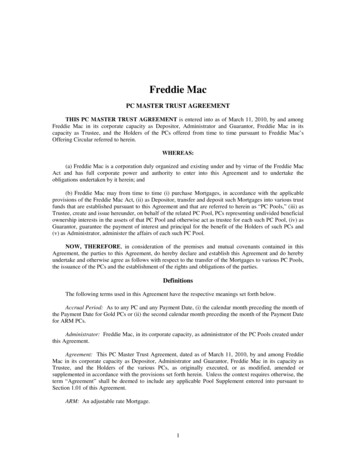
K-F00 series for floating rate loans have been growing rapidly in the past fewyears, and the K-G00 series (Green Advantage loans) and K-SG0 series(Sustainable loans) are the new additions as part of the Freddie Mac ESGinitiative since 2019 (Exhibit 10).Exhibit 10 – Freddie K ESG IssuanceGreenThere has been significant growth ofFreddie Mac ESG issuance in termsof Green and Sustainable loans inrecent years.Sustainable1,400Issuance ( MM)1,2001,000800600400200201920202021Source: Freddie Mac (December 2021).Deal structureK-Deals are differentiated from other agency CMBS securitizations. Theyincorporate features from private-label CMBS market including offering theunguaranteed subordinated classes for credit risk exposure. Another practice ofK-Deals, borrowed from the CMBS market, is the transparency of property-leveland loan-level information before and after securitization. This effectively allowsinvestors to analyze the collateral performance on an ongoing basis.A typical fixed rate K-Deal, as illustrated in Exhibit , has three main types ofclasses/tranches: Senior tranches (A1, A2 and AM) are guaranteed by Freddie Mac for timelyinterest and ultimate principal payment, and rated AAA/AA (with WALsranging from 7 to 10 years). Subordinate tranches (B, C, D) are not guaranteed by Freddie Mac and ratedA, BBB, and NA respectively (with WALs close to 10 years). IO classes (X1, X2A, XAM, X2B, X3) receive excess interest and theprepayment penalties collected by the trustee. X1, X2A, and XAM areguaranteed by Freddie Mac for timely interest payment.ftserussell.com11
Exhibit 11 – A sample fixed rate Freddie K deal (FREMF 2020-K106)Balance( /25/2030YX2A988AAA0.109.472/25/2030YXAM55AA/A NA1.999.913/25/2048NClassesSource: Freddie Mac (December 2021).Among the IO classes, X1 is a WAC IO class supported by excess WAC on topof A1 and A2 tranches, while XAM, also a WAC IO, is supported by AM tranche.X2A and X2B are strip IO classes, backed by A1/A2 and AM/B/C/D tranches,respectively. X3 is supported by D tranche, and thus is subject to credit risk.The principal payment is applied sequentially1 to the principal tranches, startingfrom the senior tranche A1 all the way down to D tranche, while the credit loss isapplied from bottom up from D tranche.Freddie K deal structure resemblesthat of private-label CMBS deals byoffering subordinate credit tranches.The subordinate tranches are assessed based on the pool composition andcollateral quality. Before the pandemic, Freddie K deals typically hadsubordination levels of 14%, 10% and 7.5%, for AM, B, and C tranche,respectively. Since the pandemic in early 2020, the number of subordinatetranches has reduced to one – D tranche only, which is the first loss tranche.Meanwhile, the thickness of the AM tranche has been growing steadily over timefrom 4.5% of the deal before 2020, to 13.5% currently [4], and the subordinationlevel of AM tranche has dropped to 5%. Note that none of the Freddie K seniortranches, including AM, has ever realized any credit losses historically. Even ifthere were a realized loss for AM, it would be reimbursed at the AM’s finaldistribution date along with the full principal payment as per the Freddie Macguarantee.Similar to a private label CMBS deal, a master servicer handles the collection ofprincipal and interest payments. Defaulted loans are handled by the specialservicer. During the default process, the master servicer advances only thescheduled interest payment for the defaulted loan – the scheduled principalpayment due to the amortization and the loan recovery do not get paid to seniorbondholder until the resolution of a defaulted loan by the special servicer.1For floating rate deals, principals are distributed pro rata unless waterfall trigger events occur.ftserussell.com12
K-deal loans are serviced by some major special servicers including CW Capital,Greystone, KeyBank, LNR, PNC Bank, Situs, Torchlight, and Wells Fargo.The investor base of Freddie K-Deals are banks, money managers, insurancecompanies/pension funds, and hedge funds. Banks, insurance companies andpension funds are the major investors in the senior tranches for the high creditratings and stable cash flow, while hedge funds and asset managementcompanies are attracted by the higher yield of the subordinated tranches and IOtranches. Given the minimal default rate of Freddie K loans historically, thesubordinated tranches can potentially realize high loss-adjusted returns.SOFR TransitionThe Secured Overnight Financing Rate (SOFR) is an alternative index to replaceLIBOR, based on the overnight cash lending collateralized by U.S. Treasurysecurities in the repo market. When LIBOR ceases to be published, all LIBORbased loans and bonds will need to convert to an alternative index, which may beSOFR. Newly originated Freddie K floating rate loans and newly issued FreddieK floating rate bonds have been indexed with a 30-day average SOFR.Freddie Mac began to issue the first SOFR indexed bond backed by LIBORbased loans (LIBOR-SOFR) as part of the KF73 floating rate transaction inDecember 2019. KF94 was the last Freddie K floating rate deal to offer a LIBORSOFR bond.By issuing LIBOR-SOFR and SOFRSOFR bonds, Freddie K is wellpositioned in the floating rate indextransition process.In December 2021, KF95 became the first Freddie K deal to offer SOFR indexedbond backed by SOFR-based loans (Class AS, SOFR-SOFR). Note that KF95also offers a LIBOR indexed bond backed by LIBOR-based loans (Class AL,LIBOR-LIBOR).The size of the SOFR tranche has increased from about 20% at the beginning toover 50% in the new floating-rate K deals [5].To facilitate SOFR transition, Freddie Mac also provides a guarantee to cover thebasis mismatch risk in the event SOFR exceeds LIBOR.Call protectionCall protection is one of the main characteristics of Freddie K loans.Fixed rate Freddie K loans have strong call protections in the form of lockout,defeasance (DFS), and yield maintenance. Typically, these loans are protectedby yield maintenance before securitization. After securitization, the protectionusually comes in the form of a hard lockout period (2-year), followed by a lengthydefeasance period, which ends 90 days prior to the maturity date. A small portionof the fixed rate loans ( 10%) have call protection with a lengthy yieldmaintenance period, followed by a short period of percentage penalty (3-month).On the other hand, floating rate Freddie K loans have much weaker callprotection provision involving percentage penalty. The most commonprepayment protection is a 1-year lockout period, followed by a percentagepenalty period (with 1% penalty point) plus a 90-day open period in the end.There are other less common options which have no lockout period, but start withhigher penalty points, e.g., 3%, 5%, or 7%, each declining 1% annually untilreaching 1%.ftserussell.com13
Exhibit 12 shows call protection distribution of Freddie K loans by vintage. Forthe 2021 issuance, “Lockout Penalty” for floating rate loans and “Lockout DFS” for fixed rate loans are the two prevailing call protection provisions.Exhibit 12 – Call Protection Distribution by VintageLockout DFSLockout PenaltyOtherYield Maintenance Penalty100%90%80%70%60%50%40%30%20%10%0%Early vintages are dominated byfixed rate loans with a strong callprotection of lockout, defeasance,and yield maintenance. Floating rateloans are gaining popularity over thetime with weaker call protection oflockout and percentage penalty.2009 2010 2011 2012 2013 2014 2015 2016 2017 2018 2019 2020 2021VintageSource: Freddie Mac, Yield Book (December 2021).Freddie K historical prepayment speedsExhibit 13 shows annual prepay speeds up to 2021 for each vintage as theyseason. Due to strong call protection for fixed rate loans, the prepay speeds ofFreddie K fixed rate loans are largely muted while the speeds are much morepronounced for floating rate loans.For fixed rate loans, lockout periodsare usually followed by lengthydefeasance periods and thus theirprepay speeds stay suppressedeven after lockout periods.Exhibit 13 – Historical Prepayment Speeds for Freddie KFixedRateTypeVintage/ 1.020190.20.420200.4ftserussell.com14
ce: Freddie Mac, Yield Book (December 2021).COVID pandemic impactDuring the COVID pandemic in 2020 with rates dropping to record lows, theprepayment speeds for Freddie K fixed rate loans were barely affected, whilefloating rate loans saw speeds jumping since September 2020 (Exhibit 14).Exhibit 14 – Freddie K Prepay Speeds 2020-2021Record low interest rate environmentthrough the COVID pandemic hadvery limited impact to the prepayspeeds of fixed rate loans due to thestrong call protection provision.Source: Freddie Mac, Yield Book (December 2021).Freddie K loans experienced very low delinquencies during the pandemic, withthe highest 30 day delinquency rate of 0.2% in May 2021, and stayed mostlybelow 10bps for other months in the last two years. There have been only fourloan defaults resolved with loss through the pandemic so far. Besides the strongmultifamily fundamental, government subsidies such as various COVIDstimulus/relief packages as well as Freddie Mac forbearance program during thepandemic may have helped mitigate the impact to credit performance of themultifamily loans.ftserussell.com15
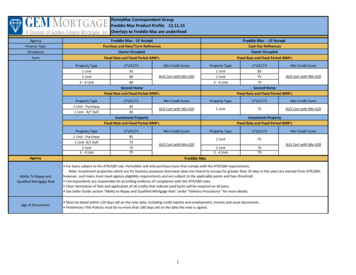
Prepayment behavior and driversThe market pricing convention of 0% CPY (which assumes no prepayment ordefault) for Freddie K is a simplified assumption, which does not capture thedynamics and unique features of the Freddie K loans. It is quite clear that thehistorical prepayment speeds varied over time (often significantly departing from0%, especially for floating rate loans). In the next section, we are going to studythe prepayment behavior and drivers of Freddie K loans.Call protection provisionCall protection provision is thedominant driver for prepaymentbehavior.Lockout and Defeasance ‒ A typical lockout period is two years for fixed rateloans. The speeds are virtually zero during lockout periods. After lockout, fixedrate loans are subject to defeasance, which effectively replicates all future cashflows, resulting in no disruption of the scheduled payments. Defeasance typicallycarries a large premium and high fee, hence prepayment is greatly discouraged.As a result, speeds are almost zero during defeasance periods, and tend to jumpright after the defeasance periods due to pent-up demand (Exhibit 15).Exhibit 15 – Prepayment Speeds of Fixed Rate Loans of 2-yr Lockout / 7.75yr Defeasance / 3-Month Open908070CPR 7781858993971011051091131170Age (in months)Source: Freddie Mac, Yield Book (December 2021).Yield Maintenance (YM) – A relatively small portion of the fixed rate loans( 10%) have yield maintenance as the main prepayment protection. Theprepayment speeds tend to increase as loan seasons and YM penalty amountdecreases, and spike when approaching the end of the yield maintenance period(Exhibit 16).ftserussell.com16
Exhibit 16 – Prepay Speeds of Fixed Rate Loans of 9.5-yr Yield Maintenance/ 3-Month Penalty / 3-Month Open100Defeasance and yield maintenanceare two main call protection featuresfor fixed rate loans, with the formerstronger than the latter.9080CPR 737781858993971011051091131170Age (in months)Source: Freddie Mac, Yield Book (December 2021).Lockout and Penalty ‒ For floating rate loans, there is usually 1-year lockoutperiod followed by a lengthy percentage penalty period with 1% penalty point.Exhibit 17 shows speeds immediately jumped after the lockout, rising to 40-50CPR later on as the low penalty point failed to deter prepay activities.Exhibit 17 – Prepayment Speed of Floating Rate Loans of 1-year Lockout /8.75-year Penalty / 3-Month Open1009080CPR (%)7060504030201002 5 8 11 14 17 20 23 26 29 32 35 38 41 44 47 50 53 56 59 62 65 68 71 74 77 80 83 86 89Age (in months)Source: Freddie Mac, Yield Book (December 2021).Property price appreciationProperty price appreciation also plays a role in driving up the prepaymentspeeds. Exhibit 18 and 19 show the prepayment speeds are higher for largercumulative property price appreciation for both fixed rate and floating rate loans.That said, we should be cautious about a caveat that loan seasoning may alsopotentially lead to higher prepayment speeds and property price appreciation isobviously correlated with the age of the loan.ftserussell.com17
Exhibit 18 – Prepayment Speed by Property Price Appreciation (Fixed RateLoans)Property price appreciation bolstersprepayment.2.5CPR (%)21.510.5039173056Cumulative Property Price Appreciation (%)Source: Freddie Mac, Yield Book (December 2021).Exhibit 19 – Prepayment Speed by Property Price Appreciation (FloatingRate Loans)4540CPR (%)353025201510501461120Cumulative Property Price Appreciation (%)Source: Freddie Mac, Yield Book (December 2021).Loan sizeFor Freddie K fixed rate loans with a yield maintenance as the main callprotection mechanism, the prepayment speeds tend to be negatively correlatedto the loan size (Exhibit 20). While it seems counterintuitive, one possibleexplanation can be that higher loan size results in higher YM penalty in dollaramount, which potentially lowers the prepayment incentive.ftserussell.com18
Exhibit 20 – Prepayment by Loan Size2 (Fixed Rate Loan with YM)LowMedianHigh8070CPR 7781858993971011051091131170Age (in months)Source: Freddie Mac, Yield Book (December 2021).DSCR and LTVNot surprisingly, default (i.e., the involuntary prepayment) is highly correlated toDSCR (Exhibit 21) and LTV (Exhibit 22).Exhibit 21 – MLPD Default By DSCRLower DSCR is associated with ahigher default rate.0.50%% of Default0.40%0.30%0.20%0.10%0.00% 1.2[1.2, 1.5)[1.5, 1.75)[1.75, 2.5) 2.5Source: Freddie Mac, Yield Book (December 2021).2“Low” for loans size below 3.4MM, “Median” for size between 3.4MM and 12.6MM, “High” for the rest.ftserussell.com19
Exhibit 22 – MLPD Default By LTV0.40%Higher LTV corresponds to a higherdefault rate.0.35%% of Default0.30%0.25%0.20%0.15%0.10%0.05%0.00% 40%[40%, 65%) [65%, 70%) [70%, 75%) [75%, 82%) 82%Source: Freddie Mac, Yield Book (December 2021).Unemployment rateUnemployment rate affects the fundamentals of multifamily properties and henceboth prepayment and default. We observed that prepayment speeds for floatingrate loans are negatively correlated to unemployment rate (Exhibit 23).Exhibit 23 – Prepay Speed by Unemployment Rate (Floating Rate Loans)30CPR (%)2520151050 4(4, 6](6, 8] 8Unemployment Rate (%)Source: Freddie Mac, Yield Book (December 2021).ftserussell.com20
Comparison with GNPL and FN DUSFreddie K, GNPL, and FN DUS, are the three major agency CMBS products.Exhibit 24 shows Freddie K and FN DUS loan issuances were generallycomparable in recent years, both are significantly higher than GNPL.Exhibit 24 – Agency CMBS Market SnapshotFreddie KFN DUSGNPL321.37394.93149.462019 Issuance ( bn)61.5462.9517.992020 Issuance ( bn)61.8176.7235.312021 Issuance ( bn)63.5465.0442.9875.891.9100.0UPB ( bn)% of Fixed RateTraditionally Freddie K and FN DUSissuances were close to each other,while GNPL had a much lowerissuance.Source: Ginnie Mae, Fannie Mae, Fred
Freddie Mac Multifamily K-deals (Freddie K) is one of the major agency CMBS products, with 321 billion outstanding balance as of December 2021. The underlying loans are typically 10-year fixed rate or floating rate loans, with a 30-year amortization period, backed by multifamily properties. Fixed rate loans