Transcription
Managing Java ApplicationPerformanceHow to Proactively Discover, Diagnose and Resolve PerformanceIssues in Java ApplicationsA Technical White Paperwww.eginnovations.comTotal Performance Visibility
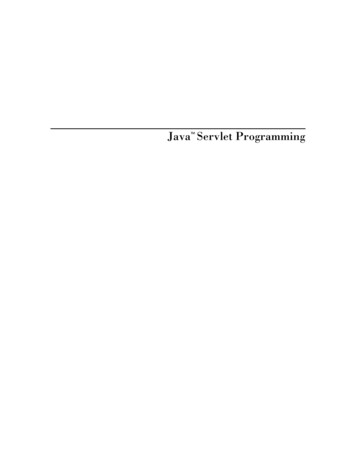
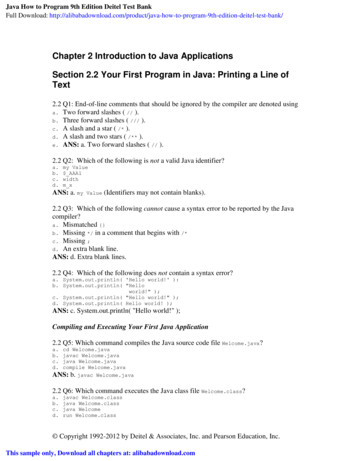
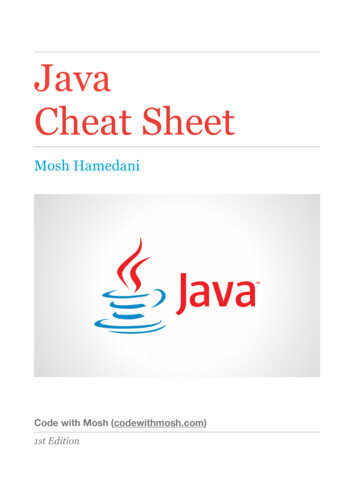
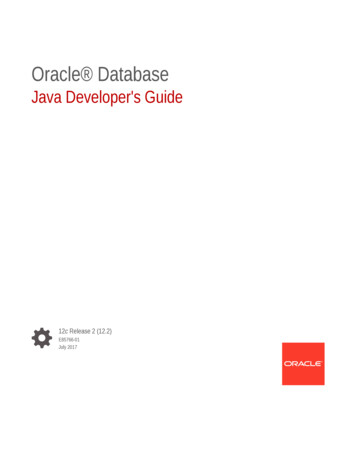
IntroductionJava-based applications are powering many businesscritical IT services today. Uses of Java technologies spanseveral domains including healthcare, logistics, finance,insurance, education and many more. In all of theseinstances, Java technology is the middleware in which thebusiness logic resides. Many production installations alsoinclude home-grown application components, runningon standard Java application servers such as OracleWebLogic, IBM WebSphere, SAP NetWeaver, ApacheTomcat and JBoss, to name a few.Because it hosts the core business logic, the performanceof the Java middleware tier has a significant impact on theperformance of the business services that it supports. Sinceall Java applications (whether client-server or web-based)run on a Java Virtual Machine (JVM), monitoring of theJVM can provide key insights into performance issues thatcould have a significant impact on the supported businessservices. For example, a single run-away thread in the JVMcould take up significant CPU resources, slowing downperformance for the entire service. Alternatively, a deadlockbetween two key threads could bring the business serviceto a grinding halt.Additionally, the functioning of the web containers/applicationservers, on which the application components are hosted,also affects application performance. Moving up thestack, the application logic and transaction flows betweenapplication components, method calls, third party API calls,and database queries - to name a few - can all affect Javaapplication performance as well.Importance of the Java VirtualMachineThe core of the Java middleware tier is the Java VirtualMachine (JVM). It is a main component of the Javaarchitecture and is part of the Runtime Environment (JRE) see Figure 1. JVM is the platform on which applicationsfunction and the Java code is executed. The JVM isconsidered as virtual machine because it provides aninterface that does not depend on the underlying operatingsystem and machine hardware – which helps deliver onJava’s unique benefit of writing code once and running itanywhere.Development Tools & APIsJava Compiler, Java Debugger, JavadocDeploymentJava Web Start, Applet /Java Plug-inUser Interface ToolkitsJava FX, Swing, Java 2D, Print Service Accessibility, SoundIntegration APIsIDL, JDBC, JNDI, RMI, RMI-II0P, ScriptingJDKCore APIsJREJMX, XML JAXP, JNI, Beans, Security, Networking, Input/OutputLang and Util Base LibrariesMath, Collections, Ref Objects, Regular Expressions, JAR, ZipJVMJava Virtual Machine (JVM)Java Hotspot Client, Server VMPlatformsSolaris, Linux, Windows, OtherThis white paper focuses on monitoring at the JVM layer andprovides use cases to highlight how JVM monitoring canhelp pinpoint the cause of complex performance issues.Web container monitoring and transaction monitoringwithin and across JVMs are also important but are beyondthe scope of this whitepaper.How the JVM WorkseG Enterprise, from eG Innovations, offers total performancevisibility for Java applications, and this whitepaper showshow built-in JVM monitoring capabilities in eG Enterpriseenable Java application performance issues to be diagnosedand resolved quickly, thereby ensuring peak performancewith low downtime.The Java compiler does not produce native executablecode. Instead, it creates what is called as byte code(see Figure 2). Byte code is a highly optimized, platformindependent set of instructions designed to be executedby the JVM. The JVM acts as an interpreter that reads andunderstands byte code and executes the correspondingnative machine instructions.Managing Java Application PerformanceFigure 1: Architecture of Java Platform Standard Edition (JVM ispart of Java Runtime Environment)www.eginnovations.com 2
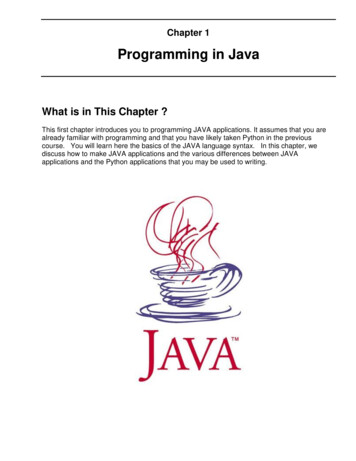
Java SourceCodeJava Compiler Managing calls between the program and the hostenvironment Management of heap and non-heap memory andgarbage collection Handling threads their creation, execution and synchronizationByteCodeByte code loaded into JVMJava Virtual Machine (JVM)Java InterpreterOperating SystemFigure 2: How the JVM worksKey functions of a JVM Loading bytecodes from application class files Verifying the loaded byte codes Linking the program with the necessary libraries Allocating memory needed by the Java programJVM Resource Usage Heap memory usage, EdenSpace, Survivor Space,Tenured GenNon-heap memory usage,Pool Code Cache, PermGenCPU utilization of JVMGarbage Collection Number of garbage collection operations Time taken for garbagecollection % of time spent by JVM forgarbage collectionIn the past, custom byte-code instrumentation had tobe developed to look at the internals of the JVM. NewerJVMs (JVM 1.5 or higher) come with extensive pre-builtinstrumentation capabilities that monitoring tools can tapinto. The Java Management eXtension (JMX) interface ofthe JVMs can be used for this purpose. The monitoring canbe done in an agent-based or agentless monitoring – i.e.,using an agent installed on the system, or using one thatresides outside the server hosting the target JVMs. Figure3, below, highlights the metrics and details that can becollected regarding the performance of the JVM.JVM ThreadsJava Classes Blocked threads Loaded classes Waiting threads Unloaded classes High CPU threads Total classes Peak threads Daemon threads Deadlock threadsJMX Connection to JVMVisibility into the ServerOperating System JMX availability JMX response timeIncoming and outgoingtraffic to the service Any changes to PID? Server uptime, disk activity,CPU and memory statisticsFigure 3: Key metrics regarding the performance of a JVM and its underlying operating systemManaging Java Application Performancewww.eginnovations.com 3
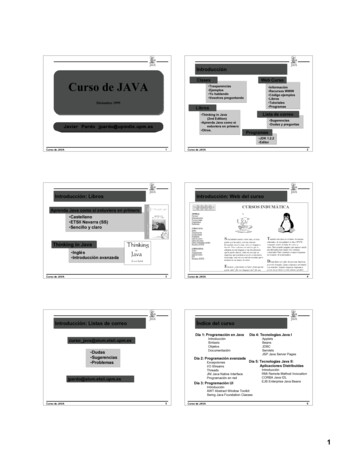
By monitoring these JVM metrics, IT Ops and DevOps personnel can get answers tocritical performance questions: What is the average CPU utilization of the JVM? Which threads are responsible for the CPU usage and what line ofcode is each thread executing? How many threads are running in the JVM at any time? Is there any leakage of threads (i.e., are threads beingstarted and left running over time)? Are there any deadlocks happening in the JVM? Which threads are responsible for the deadlock, and which linesof code (which modules, classes, files) were they executing prior to the deadlock? Are there any blocked threads? Which threads are blocking them and which lines of code are responsible for this? How efficient is the JVM's garbage collection process? How long does garbage collection take? What is the heap usage of the JVM and which object types are responsible for the memory usage of the JVM? When was the JVM last restarted? What is the current uptime of the JVM?The following sections illustrate examples of howcomprehensive monitoring of the JVM can help easilyidentify and quickly diagnose the root-cause of twocommon categories of performance problems that impactJava-based business services. In the first example, we willconsider a runaway Java application, one that suddenlystarts taking up a lot of CPU resources and we will highlighthow the exact thread and line of code responsible for thiscan be identified. In the second example, we will consider ahung Java application and depict how JVM monitoring canpinpoint the code snippet that is responsible for a deadlock.Scenario #1: Diagnosing a Runaway Java ApplicationConsider an online web store named zapstore that usesJava technologies. Figure 4 depicts the monitoring dash-board for this business service. A color code next to theservice name denotes its current status. While the colorgreen denotes normalcy, different shades of red indicateproblems of different levels of severity.Figure 4 illustrates that the zapstore service is having a criticalproblem. IT managers can click on a service to get detailsof the health of each of the tiers supporting this ser- vice.The first drilldown highlights the user experience – i.e., areusers happy and productive, or are they unsatisfied? Userexperience can be monitored using a synthetic approach,by recording typical user interactions with the serviceand replaying the interactions to measure availability andresponse times. User experience can also be monitoredpassively, – observing how real users are accessing theservice and how the service responds to their requests.Figure 4: eG Enterprise’s Business Service Dashboard identifying a critical problem in zapstore serviceManaging Java Application Performancewww.eginnovations.com 4
Figure 5 displays the user experience measured passivelyusing a plug-in installed on the web servers. Here, we seethat there are three slow transactions. One of them - theUpdate Cart transaction - is taking over 19 seconds toexecute. Normally, a poor response time problem would bea critical issue as it is business-impacting. But, the lowerpriority alert on the console indicates that the monitoringsystem has intelligently determined that the response timeslowness is an effect of a problem and not the cause.A Microsoft IIS web server front-end handles all thestatic content. The business logic is handled by the Javaapplication aws02 japp. This Java application relies on anActive Directory server for user authentication and accessrights validation. For access to the inventory database, theJava application queries an SQL database server. Customersupport queries are directed by the Java application to aWindows-based CRM system. Payment processing ishandled by an external web-based payment system.Automated Root Cause DiagnosisFrom Figure 6, we can see that the Java application, theIIS web server, the emulated client with slow transactions,all show problems. The color codes on the different tiershighlights the cause-effect relationships. By analyzing thedependencies between the different tiers, the monitoringsolution has identified that the Java application is theprobable root cause and the problems with the other tiersare probably its effects.Figure 5: Monitoring transactions to zapstore serviceTo understand where the real problem lies, an administratorcan click on any of the transactions in Figure 5. The drilldown reveals the topology of the zapstore service (seeFigure 6). The service topology shows all the networkdevices and applications that are involved in service deliveryand the inter-dependencies between them. The zapstoreservice uses a typical multi-tier architecture: users canaccess the service from a browser client, or by logging intoa Windows terminal server from a thin client and then usinga browser to connect to the service.Figure 6: Topology map of the zapstore serviceManaging Java Application PerformanceFigure 7: Virtual topology map shows the problematic Javaapplication is hosted on Amazon EC2Clicking on the problematic Java application in the servicetopology map takes the administrator to the next screen(see Figure 7). In Figure 6, we did not see the underlyinginfrastructure supporting the different application tiers.Figure 7 shows the cloud infrastructure that is supportingthe Java application server. The virtual topology shown herereveals that the CRM system and the Java application serverare running on cloud virtual machine instances hosted onAmazon AWS EC2. This topology helps the administratoranswer the question as to whether the problem is due tothe Java application, or if it is because of the cloud platformon which the application is hosted. In this case, we cansee that the problem originates in the Java application tier(displayed in red – critical state).www.eginnovations.com 5
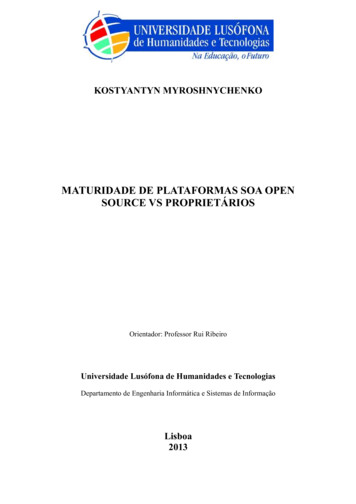
Drill Down to View Performance MetricsClick on the problematic Java application in Figure 7 to viewits performance metrics. Figure 8 shows the layer modelview of the Java application. This layer model captures thekey layers involved in the functioning of the Java application.All the metrics collected are mapped to these functionallayers and the state of a layer is determined based on thestate of all the metrics mapped to it (i.e., if all the metricsare assessed to be normal, the layer is in a normal state).The layers are hierarchically aligned, so performance issuesat the lower layers are correlated with those at the higherlayers (for example, in Figure 8, the JVM Internals layer hasa critical alert, so the JVM Engine layer that depends on itis downgraded in priority, because a problem in the layerbelow can affect the layer above). The organization ofmetrics into layers ensures that administrators need not siftthrough hundreds of metrics to determine what problemsexist in the infrastructure.indicates that there is a high CPU thread that is causingthe problem. Clicking on the magnifying glass iconnextto the High CPU threads lets you drill down further (seeFigure 9) to see the actual cause of the problem. Withoutthe right tools, determining which thread and which line ofcode is causing the CPU spike would have been a verytime-consuming exercise.Figure 9: Detailed diagnosis isolating the Java thread with highCPU usageFrom Figure 9, it is clear that the high CPU thread namedZapConnector is taking about 80% of CPU. Furthermore,the stack trace (see Figure 10) shows exactly which line ofcode the thread was executing when this high CPU statewas last detected.Figure 8: Layer Model Dashboard for viewing performance metricsof the Java applicationFigure 10: Stack trace for thread with high CPU usageThe lower layers in Figure 8, namely, the Operating System,Network, and TCP are generic for all server applications,while the top two layers (JVM Internals and JVM Engine) areunique to the Java application tier. The JVM Engine layer monitors the CPU activity andmemory usage inside the JVM. The JVM Internals layer looks deeper into the JVMand tracks the Java threads, classes loaded, andgarbage collection activity.In this example, looking at the layer model of the Javaapplication server (see Figure 8), we can see that JVMInternals is showing a critical problem (indicated by thedark red color). On the left panel, the model shows that theproblem pertains to JVM Threads. The panel on the rightManaging Java Application PerformanceIn viewing the stack trace, the most recently executed lineof code is the one on the top. So in this case, it is line 223of the LogicBuilder.java source file, which contains thecreateLogic method of the com.zapstore.logic.LogicBuilderclass.To see why there was a problem at this line of code, it isnecessary to look at the LogicBuilder.java file in a text editor(see Figure 11). Here, we can see that line 223 of the sourcecode is within a while loop. This code is supposed to loopone and a half million times and then sleep waiting for thecount to decrease. Instead, the value of count is incorrectlyreset to 0 at line 222, and this is causing the while loop toexecute forever, thereby resulting in one of the threads inthe JVM taking a lot of CPU. Deleting the code at line 222would solve this problem.www.eginnovations.com 6
9230231232233public void createLogic(){long count 0L;while(!finish){try{if(count 1500000){count 0;Thread.sleep(1);}count ;}catch(Exception ex){ex.printStackTrace();}}}}Figure 11: Exploring problematic code using text editorThis example has illustrated how a monitoring solution likeeG Enterprise with end-to-end visibility, deep diagnosis andautomatic correlation capabilities is able to identify the rootcause of the problem—a runaway high CPU thread—in amulti-tier Web application within a few clicks and point tothe exact line of code that is causing the issue.During normal operation, administrators do not have toclick through several screens to find the root cause of aproblem. The eG Enterprise alarm window (see Figure 12)which comes up as soon as a user logs in, directly prioritizesalarms based on their severity. The alarms can be emailedto administrators, sent as SNMP traps and forwarded toother network management systems, or they can be usedto open or close trouble tickets directly in helpdesk systems.Scenario #2: Diagnosing a HungJava ApplicationThe second performance problem scenario involvesunexpected thread blocking. Figure 8 from earlier, the LayerModel Dashboard used for performance monitoring of theJava application, showed another alert in JVM Threads:a blocked thread in the JVM (See Figure 13 below). Let’sinvestigate what is causing this.Figure 13: Layer Model Dashboard for the Java applicationsindicating blocked threadsClicking on the diagnosis iconnext to the Blocked threadsmetric brings up a diagnosis window showing all blockedthreads.Figure 14: Detailed Diagnosis to find the blocked threadsHere we can see there is one blocked thread namedDatabaseConnectorThread. Drilling down into the stacktrace helps troubleshoot the problem further.Figure 15: Stack trace for the blocked thread –DatabaseConnectorThreadFigure 12: Alarms window in eG Enterprise displays alarms byseverity (Most critical at the top)Managing Java Application PerformanceLooking at the top of the stack trace, we can see where theDatabaseConnectorThread thread is blocked and at whichline of code (126). the ‘ThreadState’ field clearly shows thatthe thread causing the blocking is the ObjectManagerThread.www.eginnovations.com 7
Using a text editor to look at the DbConnection.javasource file shows that the while loop in this class is insidea synchronized block (see Figure 16). The object used tosynchronize the access to this block is a variable namedsync. Looking at the variable declarations at the top of thesource code (see Figure 17) reveals that the sync variablerefers to the static string 137138139140public void getConnection(){synchronized(sync){long 1 0L;while (!finish1){try{Thread.sleep(3600);}catch(Exception ex);{ex.printStackTrace();}}}}}Figure 16: DbConnection.java source file12345678910package com.ibc.connectionPooling;import com.ibc.objectPooling.*;import java.util.Date;public class DbConnection{public static boolean finish1 false;public static String sync "test";Figure 17: DbConnection.java variable declarationsblocking the DatabaseConnectorThread is line number 26of ObjectManager.java.Figure 18: Stack trace for the blocked thread –ObjectManagerThreadAgain, the use of text editor shows that ObjectManagerThreadenters a 3600 second timed wait at line 26 (see Figure 19).This sleep call is inside a synchronized block with the localvariable mysync being used as the object to synchronize on.171819202122232425262728293031323334public void run(){synchronized(mysync){long 1 0L;while (!last){try{Thread.sleep(3600);}catch(Exception ex);{ex.printStackTrace();}}}}Figure 19: ObjectManager.java source fileThree key things can be uncovered by looking at the stacktrace and the Java code source:1. DatabaseConnectorThread is blocked and enteringa synchronized block2. Synchronization is controlled by a static string test3. Thread blocking is caused by ObjectManagerThreadGoing back to Figure 15, which shows the stack tracefor the blocked thread, and clicking on the link toObjectManagerThread brings up the stack trace for theblocking thread. Figure 18 shows that the code that isManaging Java Application 136137public void getConnection(){synchronized(sync){long 1 0L;while (!finish1){try{Thread.sleep(3600);}catch(Exception ex);{ex.printStackTrace();}}Figure 20: DbConnection.java source filewww.eginnovations.com 8
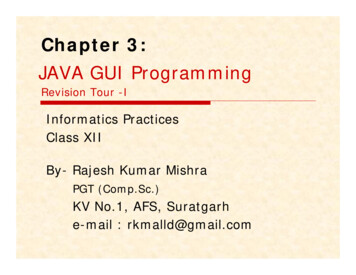
Looking at the variable declarations at the top of each sourcecode file (see Figures 21 & 22), one will quickly observe thatboth the mysync variable of the ObjectManager class and thesync variable of the DbConnection class in fact refer to thesame static string, test.12345678910package com.ibc.connectionPooling;import com.ibc.objectPooling.*;import java.util.Date;public class DbConnection{public static boolean finish1 false;infrastructure as well. With monitoring support for over 180enterprise applications, 10 operating systems and 10 hypervisors, eG Enterprise offers broad monitoring coveragefor most enterprise and service provider infrastructures.The monitoring can be done in an agent-based or anagentless manner. Administrators can choose whichapproach works for them. A single eG monitor (agent oragentless) can monitor all the JVMs running on a system,such the JVM used by web application servers likeWebLogic, WebSphere, Tomcat, JBoss, SAP NetWeaver,etc. Moreover, eG Enterprise can also be used to monitorclient/server Java applications and any custom applicationsusing Java. Both Windows and UNIX-based environments(AIX, Linux, HP-UX, Solaris, etc.) are supported.public static String sync "test";Figure 21: ObjectManager.java variable declarationsJM XHTTP/S12345678910package com.ibc.objectPooling;import com.ibc.objectPooling.*;import java.util.Date;public class ObjectManager extends Thread{public static boolean last false;public static String mysync "test";public ObjectManager()Figure 22: DbConnection.java variable declarationsSo, even though the programmer has given two differentvariable names in the two classes, the two classes refer toand are synchronizing on the same static string object, test.This is why two unrelated threads are interfering with eachother's execution.JM XeG AgenteG ManagerJava ApplicationJMXJava ApplicationHTTP/SJava ApplicationUser AccessingeG Enterprise onWeb ConsoleFigure 23: The eG Enterprise architectureAdditionally, eG enterprise offers code-level insight for Javaapplications by using byte code instrumentation and tracinghow user transactions flow throughout the applicationsarchitecture. Administrators can easily identify which tier ofthe Java applications architecture is experiencing slowdown(see Figure 24).TroubleshootingModifying the two classes – ObjectManager andDbConnection – so that the variables mysync andsync point to two different strings by using thenew String (“test”) function resolves this problem.End-to-End Application andInfrastructure MonitoringBesides providing in-depth monitoring of the JVM, eGEnterprise offers in-depth monitoring of other tiers of theManaging Java Application PerformanceFigure 24: Java business transaction monitoring using eG Enterprisewww.eginnovations.com 9
In addition to real-time alerts and diagnosis, eG Enterprisealso provides historical reports that are ideal for postmortem diagnosis and pinpointing where the root-cause ofa problem lies. Administrators can: Get insights into the performance of the JVM thatcan help them fine-tune the performance of the Javaapplications to ensure improved user experience.Correlate Java application performance with that ofthe other infrastructure tiers and determine wherethe bottlenecks lie.Next StepsFor more information, please visit nce-monitoring,or email us at info@eginnovations.comLIVE DEMOFREE TRIALRequest a personal walkthrough to learnfirst hand how eG Enterprise can helpimprove performance and operations inyour business environment.15-days of free monitoring and diagnosis, inyour own infrastructure. Try it and learn exactlyhow eG Enterprise helps you ensure a greatend-user experience and improve IT operations.About eG InnovationseG Innovations provides the world's leading enterprise-class performance management solution that enables organizations to reliably deliver mission-critical business services across complex cloud, virtual, and physical IT environments. Where traditional monitoring tools oftenfail to provide insight into the performance drivers of business services and user experience, eG Innovations provides total performancevisibility across every layer and every tier of the IT infrastructure that supports the business service chain. From desktops to applications,from servers to network and storage, eG Innovations helps companies proactively discover, instantly diagnose, and rapidly resolve even themost challenging performance and user experience issues.eG Innovations' award-winning solutions are trusted by the world's most demanding companies to ensure end user productivity, deliverreturn on transformational IT investments, and keep business services up and running. Customers include JP Morgan Chase, Citigroup,Depository Trust and Clearing Corporation, CSC, Cathay Bank, AllScripts, Honeywell, Fidelity Investments, Samsung, Xerox, Marathon Oil,US Department of State, The Government of Canada, McKesson, Aviva, AXA, and many more.To learn more visit www.eginnovations.com.Restricted RightsThe information contained in this document is confidential and subject to change without notice. No part of this document may be reproduced ordisclosed to others without the prior permission of eG Innovations, Inc. eG Innovations, Inc. makes no warranty of any kind with regard to the software anddocumentation, including, but not limited to, the implied warranties of merchantability and fitness for a particular purpose. Copyright eG Innovations, Inc. All rights reserved.All trademarks, marked and not marked, are the property of their respective owners.Specifications subject to change without notice.Total Performance VisibilityManaging Java Application Performancewww.eginnovations.com 10
Because it hosts the core business logic, the performance of the Java middleware tier has a significant impact on the performance of the business services that it supports. Since all Java applications (whether client-server or web-based) run on a Java Virtual Machine (JVM), monitoring of the JVM can provide key insights into performance issues that