Transcription
Proceedings of Indian Geotechnical Conference 2020December 17-19, 2020, Andhra University, VisakhapatnamVisakhapatnam ChapterInterpretation of Static Cone Penetration Test withTriaxial Test to Determine Undrained Shear Strength ofClayey SoilSachin K. More 11AssistantProfessor, Department of Civil Engineering, Rajarambapu Institute of Technology,Rajaramnagar, Maharashtra-415414E-mail: sachin.more@ritindia.eduAbstract. A series of static cone penetration tests and undrained triaxial testsare performed to determine undrained shear strength of clayey soil. The fieldstatic cone penetration test is conducted on Marine Clay Soil near NaygaonWest, Mumbai. It will be very precise, if we able determine the undrained shearstrength of clayey soil using field tests. Therefore in this research we have developed empirical relationship between the parameters of static cone penetration test and triaxial test, so that using the field parameters we can able to determine undrained shear strength of clay soil. Mainly the static cone penetrationtest gives end bearing, frictional resistance and corresponding cone factor ofclay soil for various depths, which are then related with the laboratory parameters like Atterberg’s Limits and Undrained Shear Strength of clay for the samedepths. From the empirical relationship between field parameters and laboratoryparameters we are able to develop coefficient called as cone factor K, whichwill help us to determine undrained shear strength of soil directly on site forsimilar types of clayey soil.Keywords: Cone Penetration Test, Undrained Shear Strength, Cone Factor.1Introduction1.1A subsection sampleIn geotechnical engineering practice most importance is given for determination ofindex properties and engineering properties of the soil sample. There are several laboratory and field methods are available for determination of these properties. In laboratory many of the tests are performed on disturbed and undisturbed soil sample.But these are the representative soil samples which gives the approximate values ofthe test results. There are very few tests which gives the results according to the fieldconditions. For major construction work it is very necessary to have a representativetest data for further design process. Clay soil sample is very sensitive from construction point of view and it is very necessary to take care during construction.In clay soil undrained shear strength parameter is very important from design perspective. So, it is very important to have representative values of undrained shear strengthTheme 1239
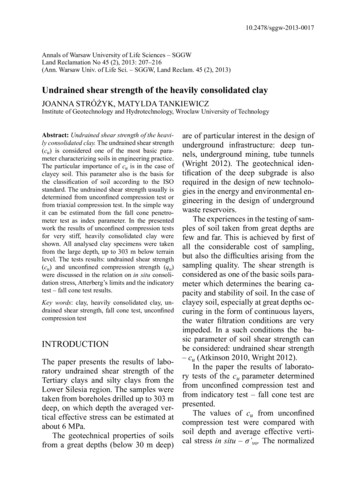
Sachin K Moreof clay soil sample. Laboratory triaxial test is one of the important test to determineundrained shear strength of clay soil and it gives representative results. But if we canable to find the undrained shear strength of soil directly on site then achieved valueswill be based on site conditions. In this research the correlation has been made between triaxial test and static cone penetration test to achieve the undrained shearstrength values of clay soil directly on the site using static cone penetration test. Staticcone penetration test can be used for wide range of geotechnical applications in claysoil.2Site SelectionThe static cone penetration test can be performed on soft soil, so site is selected insuch way that static cone penetration test can be carries out easily. The area aroundNaigaon West, Mumbai is deposited with marine clay. So, we have selected NaigaonWest, Mumbai to carry out static cone penetration test. The site is located near Naigaon railway station, Mumbai which 5 km away from west coast of Arebian Sea.Fig. 1. Site location and mapThe site map is shown below in Fig. 1 (Ref. Genstru Consultants Pune). On the samesite Genstru Consultants were also performing geotechnical investigation for railwayover bridge.3Field Testing and Sample Collection3.1 Static cone penetration test : The static cone penetration test used to know soilstrata and also to identify soil layers that may be problematic and require additionaltesting during investigation. The results of static cone penetration tests are used forgeotechnical design process and various correlations between soil parameters.Static cone penetration is internationally recognized as a standard field test to collectdata about bearing capacity and frictional resistance of soil. The equipment meetsessential requirements of IS: 4968 (Part III). The probing part consists of a conewhich has an apex angle of 600 and overall base diameter of 35.7mm equivalent to isof 10cm2. The cone is connected with the sounding rods and mantle tubes. The assembly of sounding rod and mantle tubes is pushed into the soil, by means of hydrau-Theme 1240
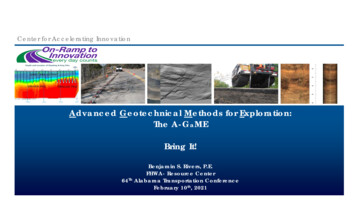
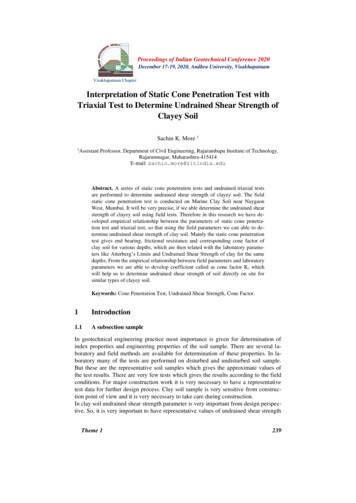
Proceedings of Indian Geotechnical Conference 2020December 17-19, 2020, Andhra University, Visakhapatnamlic pumping unit and ram. Basically the test procedure consists of first pushing thecone and friction jacket and finally the whole assembly in sequence through specifieddepth and noting the resistance. The readings are taken at every 20cm of cone penetration and continuous data of end resistance and sleeve friction is recorded.Static cone penetration test results: The procedure of conducting static cone penetration test is as per IS: 4968 (Part III) and ASTM D 5778. Total four number of staticcone penetration test was conducted at 50m interval named as A, B, C, and D locations and continuous profile of cone resistance and sleeve friction is recorded. Thegraph shows the cone resistance and sleeve friction with respect to depth.Location ALocation CLocation BLocation DFig. 2. Static cone penetration test resultsTheme 1241
Sachin K MoreFrom trends of the all graph it seems that cone resistance and frictional resistancegoes on increasing with increase in depth. The range of cone resistance varies from 0to 3000 kPa and range of frictional resistance varies from 0 to 1000 kPa. The resistances are recorded up to a depth of 6m for each 0.2m interval and are then converted into layers of 1.5m interval.Table 1. Cone resistance and frictional resistance at every 1.5m intervalDepth inm0.00-1.501.50-3.003.00-4.504.50-6.00Location 00Location CDepth n 0800Location DDepth in mqc(kPa)fs(kPa)Depth in 5250400700Corrections for static cone penetration test results: The combine cone and frictional resistance shall be corrected for the dead weight of the cone, frictional jacketand sounding rods. These values shall be corrected for the ratio of ram area to thebase area of the cone.I. Correction for cone resistance1. Mass of cone, m 0.8kg2. Mass of each sounding rod, m1 1.5kg3. Correction (m nm1) x 10 kN/m2II. Correction for frictional resistance1. Mass of friction jacket mf kg 1.3kg2. Area of friction jacket, a πdh 113.04 cm 23. Cone area at base, b 10cm24. Correction factor to be added mf/a z . Where z (fs x b)/ aIII. Correction for pore pressure:The recorded cone resistance and frictional resistance should be corrected for porepressure as shown below,qt qc u2 (1-a)a is the area ratio equals to 0.7 and u2 is pore water pressureTheme 1242
Proceedings of Indian Geotechnical Conference 2020December 17-19, 2020, Andhra University, VisakhapatnamTable 2. Corrected values of cone resistance and frictional resistance at every 1.5m intervalDepth inm0.00-1.501.50-3.003.00-4.504.50-6.00Location 40.9271.89Depth in mDepth inm0.00-1.501.50-3.003.00-4.504.50-6.00Location 45.3467.47Depth in -3.003.00-4.504.50-6.00Location 5.3471.89Location 36.4963Sample Collection. The undisturbed and disturbed samples were collected at every1.5m interval. The disturbed samples were collected using standard penetration testsampling tubes and undisturbed samples were collected through Shelby tubes of100mm diameter and 0.9m length.Fig.3. Collected disturbed and undistrurbed samplesTheme 1243
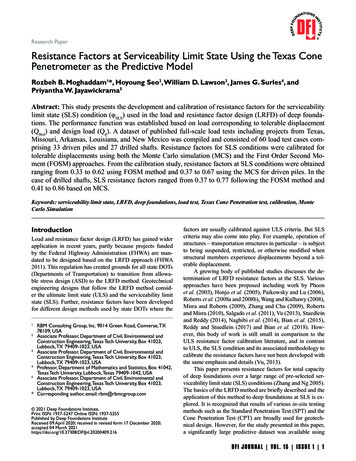
Sachin K More4Laboratory TestingIn order to determine index and engineering properties of the soil, various laboratorytests were conducted. The laboratory test program includes determination of specificgravity, grain size analysis, Atterberg’s limits and undrained triaxial tests.4.1Grain size analysisThe grain size analysis and hydrometer test was conducted on collected soil samplesof each location. Mostly for clay soil sample we t sieve analysis is preferred becauseit contains maximum amount of clay and silt particles. Hydrometer test was conducted on the soil samples which are less than 75μ. After conduction of tests the results ofgrain size analysis and hydrometer tests are club together in soil classification curve.Below graph shows the particle size distribution.Location ALocation BLocation CLocation DFig. 4. Particle size distribution curve for location A, B, C & DThe particle size distribution results indicate the type of soil is silty clay. The contentof clay in the soil is more than 80%.Theme 1244
Proceedings of Indian Geotechnical Conference 2020December 17-19, 2020, Andhra University, Visakhapatnam4.2Atterberg’s limitsAtterberg’s limits are basic tests to identify the behavior of the clay soil, whichmeasures liquid limit, plastic limit and shriKage limit. As the water content in dryclayey soil increases it undergoes dramatic and distinct changes in behavior and consistency. Depending upon the presence of water content, it has four states like solid,semi-solid, plastic and liquid state. In each state behavior of soil and consistency isdifferent and therefore engineering properties is also different in each state of claysoil. The results of consistency limits are tabulated below. The atterberg’s limits arecalculated at every 1.5m interval at each location.Table 3. Results of Atterberg’s Limit TestTheme 1Depth 666869.8172Location 4.653613.82PlasticityIndex3030.8630.4336Depth 67.569.2570.2571Location 35Depth 687070.569Location .5533.216.21PlasticityIndex33.5833.731.535.8Depth 6769.568.570Location .2533.9716.2PlasticityIndex33.237.5832.236.03245
Sachin K More4.3Specific gravitySpecific gravity of the soil samples was determined using density bottle as per IS:2720 (Part II) 1980. The tests were performed on collected soil samples from variouslayers. The values of specific gravity are shown in table below. The specific gravityof soil sample varies in between 1.58 to 1.64.Table 4. Results of Specific Gravity TestDepth icGravityLocation A2.622.642.592.58SpecificGravityLocation B2.572.632.622.60SpecificGravityLocation C2.612.622.592.60SpecificGravityLocation D2.602.592.602.63Triaxial testThe triaxial test on cylindrical sample is most widely used to determine undrainedshear strength, bearing capacity parameters and stress strain relationship. In this research a strain controlled triaxial test are conducted as per procedure given in the IS:2720 (Part 10, 11 & 12). Electrical load cell are used to measure the pore water pressure, displacement and volume change.The triaxial tests were conducted on undisturbed soil samples collected from eachlocation to determine undrained shear strength of soil. The strain rate was0.002mm/min with different cell pressure of 0.5kg/cm 2, 1.0kg/cm2 & 1.5kg/cm2. Thewhole assembly of triaxial test is shown in figure below.Fig.5. Collected undisturbed and disturbed samplesThe results of triaxial test is tabulated below which shows that undrained shearstrength of soil goes on increasing with increase in depth. The determined values ofTheme 1246
Proceedings of Indian Geotechnical Conference 2020December 17-19, 2020, Andhra University, Visakhapatnamundrained shear strength of clay soil samples are then used for correlation with staticcone penetration test data.Table 5. Results of Specific Gravity TestLocation ADepth in (m)Undrained ShearStrength (Su) 6.50140.47Location CDepth in (m)Undrained ShearStrength (Su) -6.50147.085Location BDepth in (m)Undrained ShearStrength (Su) -6.50147.08Location DDepth in (m)Undrained ShearStrength (Su) -6.50147.08Determination of Cone Factor ValuesIt is very reliable estimation of undrained shear strength of clay from cone factor determined from the results of static cone penetration test. The value of cone factor isinfluenced by type of soil, test methods for determination of undrained shear strength.Many attempts have been made to fine cone factor values (Nash & Duffin, 1982;Lunne & Kelven, 1981; Chang et. al. 2001). From the studies it is observed that it isvery necessary to calculate the cone factor values suitable for localized, specific typeof soil considering all those factors. In this research we tried to calculate the conefactor values for the marine clay situated at Naigaon West, Mumbai. These cone factor values can be calculate using empirical relationships mentioned below.5.1Empirical cone factor valuesThere are many empirical correlations have been proposed to calculate the cone factorvalue. The researcher Terzaghi 1948 proposes a equation to calculate cone factorvalue based on recorded values of cone resistance and sleeve friction of static conepenetration test areK Empirical cone factorTheme 1247
Sachin K Moreσ’v0 The total overburden stress.The researcher Lunne in 1996 proposed a empirical relation to calculate cone factorfrom corrected tip resistance are as below,Another equation has been proposed to calculate cone factor are as below,From the empirical relationships mentioned above, the values of cone factor are calculated. These values of cone factor are ranging between 12 to 16 and an average of14.7. The empirical cone factor values of every layer in each location are calculatedand empirical relationship between index properties, engineering properties and conefactor has been made.6Correlation Between Cone Factor, Index Properties andEngineering Properties.6.1Correlation between Cone Factor and Plasticity IndexWe are tried to plot the graph between all these three cone factor values K, Kt & Kewith plasticity index of the soil, we observed linear relationship between cone factorsand plasticity index. Using correlation between cone factor and plasticity index of soila localized equation Kt 0.384Ip 1.726 with a correlation coefficient equal to0.926is suggested for estimating the cone factor. The analysis is meaningful as it indicated increasing trends of cone factor with plasticity index of clayey soil. The relationship between cone factor and plasticity index is shown in graph below.Fig.6. Correlation between K and plasticityindexTheme 1Fig.7. Correlation between Kt and plasticityindex248
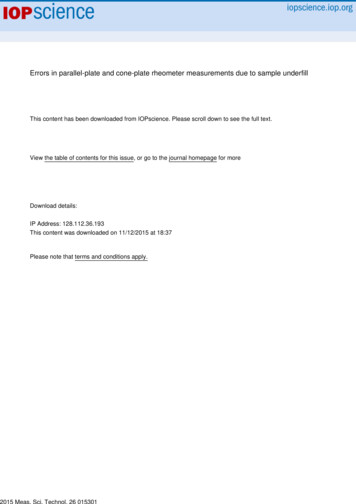
Proceedings of Indian Geotechnical Conference 2020December 17-19, 2020, Andhra University, VisakhapatnamFig.8. Correlation between Ke and plasticity index6.2Correlation between cone factor and undrained shear strengthTo calculate in-situ undrained shear strength of soil using static cone penetration test,they must be correlate with each other. So, undrained shear strength of soil calculatedusing undrained triaxial test and cone resistance from cone penetration test on similarsoil in Mumbai is plotted against each other as shown in graph. From this graph itseems that undrained shear strength of soil goes on increasing with increase in coneresistance of soil, so there is linear relationship between these two parameters.Using the correlation between these two parameters a localized equation for undrained shear strength Su 0.064 (qt - σvo) 4.058 is suggested with correlation coefficient of 0.989, for the cone factor value of 14.87.Fig.9. Correlation between Ke and plasticity indexTheme 1249
Sachin K More7Conclusions1. From SCPT test results it is observed that Cone resistance and frictional resistance goes on increasing with increase in depth.2. An empirical cone factor, K, Kt and Ke is derived from the empirical correlation and the values are in the range of 12 to 16 or average of 14.87.3. The results of the present study showed increasing trends of cone factor withplasticity index of clayey soil.4. Using the correlation between the cone factor and the plasticity index, a localized equation K 0.384Ip 1.726 with a correlation coefficient equal to0.926 is suggested for estimating the cone factor.5. Undrained shear strength can be estimated using static cone penetration testusing formula Su 0.064 (qt – σvo) 4.058 for cone factor value 14.87.References1. S. A. Naeini, R. Ziaie Moayed.: Evaluation of undrained shear strength of loose silty sandsusing CPT results, International Journal of Civil Engineering, Vol. 5, No. 2. (2007).2. Nwobasi, Paul Awo,: Estimation of undrained shear strength of soil using cone penetrationtest, International Journal of Scientific & Engineering Research, Volume 4, Issue 9, 409ISSN 2229-5518 (2013).3. C.S. Chen.: Evaluating undrained shear strength of klang clay from cone penetration test,International Conference on In-situ Measurement of Soil Properties and Case Histories,Bali, Indonesia, (2001).4. Moses Karakouzian , B. Burcin Avar.: Field measurements of shear strength of an underconsolidated marine clay, Engineering Geology 67 233–242, (2002).5. Zsolt Rémai,:Correlation of undrained shear strength and CPT resistance, Periodica Polytechnica Civil Engineering 57/1 pg. 39–44(2012).6. Young Jin Shin and Daehyeon Kim,: Assessment of undrained shear strength based oncone penetration test (CPT) for clayey soils, KSCE Journal of Civil Engineering 15(7),1161-1166, (2011).Theme 1250
3.1 Static cone penetration test : The static cone penetration test used to know soil strata and also to identify soil layers that may be problematic and require additional testing during investigation. The results of static cone penetration tests are used for geotechnical design process and various correlations between soil parameters. Static .