Transcription
Geotech Geol Eng (2013) 31:979–1009DOI 10.1007/s10706-013-9662-2STATE-OF-THE-ART REVIEWCone Penetration Test Based Direct Methods for EvaluatingStatic Axial Capacity of Single PilesFawad S. Niazi Paul W. MayneReceived: 29 December 2012 / Accepted: 29 April 2013 / Published online: 5 June 2013 Springer Science Business Media Dordrecht 2013Abstract The direct cone penetration test (CPT) basedpile design methods use the measured penetrometerreadings by scaling relationships or algorithms in asingle-step process to enable the assessment of pilecapacity components of shaft and base resistance (fp andqb, respectively) for evaluation of full-size pilings. Thispaper presents a state-of-the-art review of publishedworks that focus on direct CPT evaluation of static axialpile capacity. The review is presented in a chronologicalorder to explicate the evolution over the past six decadesof an in situ test based solution for this soil-structureinteraction problem. The objective of this study is anattempt to assemble maximum published methodsproposed as a result of past investigations in one resourceto afford researchers and practitioners with convenientaccess to the respective design equations and charts. Inaddition to an all-inclusive summary table and the designcharts, a compilation of significant findings and discussions thereof are presented. Furthermore, potential futureresearch directions are indicated, with special emphasison the optimal use of the modern multi-channel hybridgeophysical-geotechnical seismic CPT to evaluate thecomplete axial pile load–displacement response.F. S. Niazi (&) P. W. MayneGeosystems Engineering Division, School of Civil andEnvironmental Engineering, Georgia Institute ofTechnology, Atlanta, GA 30332-0355, USAe-mail: fniazi6@gatech.eduP. W. Maynee-mail: paul.mayne@gatech.eduKeywords Pile foundation Cone penetration test Piezocone penetration test Pile load test Axial pilecapacity1 IntroductionThe static axial capacity (Qt) of pile foundations iscalculated from the sum of the shaft capacity (Qs) andbase capacity (Qb):Xfpi Asi þ qb Abð1ÞQt ¼ Qs þ Qb ¼where fpi unit shaft resistance of the ith soil layerthrough which the pile shaft is embedded; Asi shaftarea providing frictional resistance with the adjacentsoil in the ith layer against axial displacement; qb is theunit end bearing resistance; Ab is the pile base area.The methods for the assessment of pile capacity interms of its components of shaft and base resistance (fpand qb, respectively) have followed a constant evolutionover the past many decades. Starting from some basicformulations where fp was related solely to the shearstrength of the soil, alternative approaches such as thoseincorporating the influence of lateral effective stresscoefficients (K) and pile-soil interface friction (d) wereadvanced. Subsequently, other variables which influence the magnitude of fp were studied, including: stresshistory, pile length, pile slenderness ratio, soil sensitivity, plasticity of clayey soils, relative density of sandysoils, effective stress strength of soil, progressive failure123
980mechanism, plugging effect in open-ended pipe piles,soil compressibility characteristics, pile material, andinstallation methods. Similarly, the qb component of pilecapacity depends primarily on the conditions around thepile base, including: pile tip configuration [e.g. tipshape, open-ended (OE) vs. close-ended (CE) etc.],installation method, strength and stiffness properties ofthe geomaterial encountered at the pile base, rate ofloading, and drainage characteristics. Differentresearchers have proposed various bearing capacitytheories, and modifications thereof, to evaluate qb of pilefoundations, e.g. limit plasticity, elasto-plasticity, cavityexpansion, strength dilatancy, and particle breakage.This continual process of evolution has led to a variety ofsophisticated formulae.Despite significant contributions being made to theliterature in terms of different design methods, many ofthe approaches have a number of inherent drawbacks.Soil behavior is, of course, governed by a series ofcomplex stress–strain changes that occur duringinstallation and subsequent loading. Owing to thedifficulties and the uncertainties in assessing the pilecapacity on the basis of the soil strength-deformationcharacteristics, the most frequently followed designpractice is to refer to the formulae correlating directlythe pile capacity components of fp and qb to the resultsof the prevalent in situ tests. Within the domain of thesein situ methods, the cone penetrometer test (CPT) isone of the most frequently used investigation tool forpile bearing capacity evaluations. Ever since the firstuse of CPT in geotechnical investigations, researchefforts have advanced the very elementary idea ofconsidering it as mini-pile foundation. This hasresulted in plethora of correlative relationships beingdeveloped between the CPT readings [measured tipstress (qc) or more proper total tip stress (qt), sleevefriction (fs), and shoulder pore water pressure (u2)] andthe pile capacity components of fp and qb. Suchcorrelations, although empirical, have been worked outon the basis of load test results from both instrumentedand un-instrumented full scale piles and are able toaccommodate many important variables.2 Pile Capacity Evaluation from CPTAs commonly reported (e.g. Ardalan et al. 2009; Caiet al. 2009, 2012; Mayne 2007), there are two mainapproaches to accomplish axial pile capacity analysis123Geotech Geol Eng (2013) 31:979–1009from CPT data: (a) ‘‘rational (or indirect) methods’’and (b) ‘‘direct methods.’’ The rational methodsrequire a two-step approach. As a first step, CPT dataare used to provide assessments of stress history0[preconsolidation stress (rp), and overconsolidationratio (OCR)], in situ radial stress coefficient (Ko) i.e.,0the ratio of in situ radial to vertical effective stress (rro/0rvo), radial stress coefficient at failure (Kf) i.e., the0ratio of radial to vertical effective stress at failure (rrf/0rvo), undrained shear strength (su), relative density0(Dr), effective stress strength (/ ), soil total unitweight (ct), fundamental soil stiffness [intial shearmodulus (Gmax), or initial Young’s Modulus (Emax)],interface friction between soil and pile material (d),and bearing capacity coefficients (Nc, Nq). The pertinent relationships may be found in the relatedliterature, some of which have previously beensummarized by Niazi and Mayne (2010), and Niaziet al. (2010a). Utilizing these input values of geoparameters, the second step enables the assessment of fpand qb components of pile capacity within a selectedanalytical framework.The pile fp can be evaluated using either total stressanalysis (a-method) for clays that relates fp to su via anadhesion factor (a), or the effective stress analysis (bmethod) for both sands and clays that relates overburden stress via empirical parameter b. The simplestfundamental formulations of the two approaches for fpare shown below:a-Method : fp ¼ a sur0rf tan d ¼ Kf b-Method : fp ¼d ¼ Ko r0vo tan dð2Þr0vo tan¼ b r0vo ðassuming Ko ¼ Kf Þð3ÞFor a pile foundation, an important factor of relevanceto qb is the likely strain compatibility differencesoccurring between the unmatched mobilization of sideresistance and end bearing components during pileloading. For undrained loading (primarily in clays andcohesive silts) beneath the base, the qb can fullymobilize within tolerable limits of vertical displacements, usually taken as w/d 0.1, where w pilesettlement, and d base diameter. In the case ofdrained loading (primarily sands and granular materials), however, it is impractical to assume that fullmobilization of the end bearing resistance occursfor the range of tolerable settlements. Consequently,to achieve a settlement ratio corresponding to
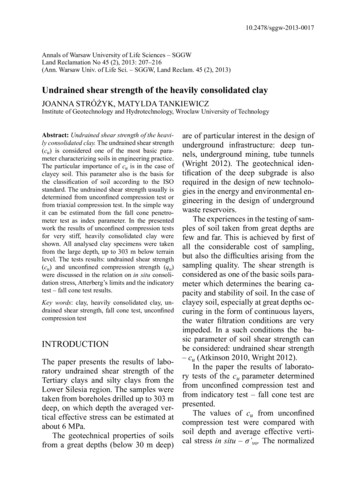
Geotech Geol Eng (2013) 31:979–1009w/d 0.10, it is customary to use an operationalvalue of qb that is reduced from the theoretical value[qb 0.1qb(theory)]. In sands as well as slow loading(or long-term analysis) in clays and silts, usuallydrained conditions are assumed (use bearing capacitycoefficient for overburden, Nq corresponding toeffective stress analysis). In clays, silts, and soils0with low permeability (assuming / 0 for fastloading), usually undrained conditions are evaluated(use bearing capacity term for cohesion, Nc corresponding to total stress analysis). Thus, the evaluationof qb is performed using relevant coefficients to relate0qb either to su or rvo (qb & Nc su for undrained0loading, and qb & 0.1Nq rvo for drained loading).Here, Nc & 9 for deep foundations, while Nq is0function of / .Doherty and Gavin (2011), Jamiolkowski (2003),Patrizi and Burland (2001), and Karlsrud (2012) haveeffectively reviewed significant contributions in thisregard including works by API (1969, 1975, 1976,1987, 1993), Chen and Kulhawy (1994), Drewry et al.(1977), Karlsrud et al. (1993, 2005), Kolk and van derVelde (1996), Kraft et al. (1981), McClelland (1974),Miller and Lutenegger (1997), Randolph (1983),Randolph and Murphy (1985), Semple and Rigden(1984), Skempton (1959), and Vijayvergiya and Focht(1972). For the scope of this paper, no furtherdiscussion has been included on the indirect methods.However, summary lists of the various factors considered by different researchers in their respective studiesto make improvements in the predictive reliability oftotal stress approach and effective stress approach arepresented in Tables 1 and 2, respectively.In contrast to the rational methods, the direct CPTmethods use the measured penetrometer readings byscaling relationships or algorithms in a single-stepprocess to obtain fp and qb for evaluation of full-sizepilings. Figure 1 presents various paths to evaluate thetwo components of qb and fp from CPT readings.The remaining parts of this paper present the basis fordevelopment, chronological evolution during the pastover 60 years, and the design formulations and chartsfor the direct CPT-based methods for axial pile capacityevaluations. Over 75 different technical papers, reportsand PhD research studies were reviewed in this processin an attempt to present all-inclusive and updatedinformation on the subject. It may be noted that there are981still many reports and manuals (not cited herein) thatinclude design recommendations on the topic, based onvarious formulations presented in this paper. Summaryinformation on the scope, effort and significant findingsof each method are included, followed by generaldiscussions and recommendations for future researchdirections.3 Direct CPT Based MethodsIn one viewpoint, the cone penetrometer can beconsidered as a mini-pile foundation, whereby themeasured tip stress and sleeve resistance correspondto the pile end bearing and the component of sidefriction (Mayne 2007). As noted by Ardalan et al.(2009) and Eslami and Fellenius (1997), the meaneffective stress, compressibility and rigidity of thesurrounding soil medium affect the pile and the conein a similar manner; thus, eliminating the need tosupplement the field data with laboratory testing andto calculate intermediate values for use in the CPTmethods for pile capacity evaluations. This concepthas led to the development of many direct CPTmethods, whereby the measured readings are simplyscaled up empirically for the evaluation of full-scalepiling. The initial formulations of such methods wasbased solely on the measured tip resistance (qc)derived from mechanical cone penetrometers. Subsequently, with the introduction of the electrical conepenetrometer, the additional channels measuringsleeve friction (fs) and porewater pressures (u1 andu2), the correction of porewater pressures to themeasured tip resistance to yield corrected tip resistance (qt), and continuously increasing database ofCPT and pile load tests has resulted in a variety ofdirect CPT based pile evaluations. Some of thesemethods provide design equations for either fp or qb,while others account for both the components.In addition to the purely empirical CPT-baseddirect methods, fp and qb can also be estimated usingthe applicable semi-empirical direct methods whichrequire measurements or estimation of additionalparameters along with the penetrometer readings ofCPT. Within the scope of this study, the semiempirical direct methods have also been grouped withthe direct methods.123
982Geotech Geol Eng (2013) 31:979–1009Table 1 Factors considered in the total stress approach (a-methods) for estimating pile unit shaft resistance urvoProgressivefailurePluggingeffectTomlinson (1957)8884888Peck (1958)8884888Skempton (1959)8884888Woodward et al. (1961)8884888Kerisel (1965)8884888API (1969)8488488McClelland (1974)8484888Vijayvergiya and Focht (1972)4884488Drewry et al. (1977)8884888API (1975, 1976)8444488Kraft et al. (1981)4884448Randolph (1983)4884848Semple and Rigden (1984)4484488Randolph and Murphy (1985)8484488API (1987)8484488API (1993)8484488Karlsrud et al. (1993)8844488Chen and Kulhawy (1994)8884888Kolk and van der Velde (1996)4484488Miller and Lutenegger (1997)8888884Jamiolkowski (2003)8484488NGI-05 (Karlsrud et al. 2005)8444488Salgado (2006)8484888German method (Kempfert and Becker 2010)8884888Karlsrud (2012)84444880Ip plasticity index; su undrained shear strength; rvo effective overburden stressTable 2 Factors considered in the effective stress approach (b-method) for estimating pile unit shaft resistance ler (1968), Burland (1973), Pelletier and Doyle (1982)444844888888Meyerhof (1976)8444848888888Flaate and Selnes (1977)88848448888Kulhawy et al. (1983)444844888888Twine (1987), Patel (1989)888884888888Reese and O’Neill (1988)888884488888Fleming et al. (1992)448844888888Burland (1993)888484884888de Nicola and Randolph (1999)888884888488Patrizi and Burland (2001)888484884888ICP-05 method (Jardine et al. 2005)448448444844Karlsrud (2012)8884848888840000rr radial effective stress; d0 0 soil-pile interface friction angle; /0 effective friction angle; OCR ( rp/rvo) is theoverconsolidation ratio; J ( rr/rv) radial effective stress coefficient; rvo effective vertical stress; L pile length; d pilediameter; su undrained shear strength of clay; Dr relative density of sand; St clay’s sensitivity; Ip plasticity index123
Geotech Geol Eng (2013) 31:979–1009983CPT Based Evaluations ofPile CapacityDirectMethodsRational (Indirect)MethodsTotal Stress ApproachEffective Stress ApproachUnit Shaft Resistance (fp):α-Methods(applicable to fine grained soils)fctn(su, σvo , OCR, Ip, L,plugging, progressive failure)Unit Shaft Resistance (fp):β-Methods(applicable to coarse andfine grained soils)fctn(σr δ φ , OCR, K, σvo , L,d, su, Dr, St, Ip)Unit Base Resistance (qb):undrained loading(applicable to fine grained soils)fctn(su)Unit Base Resistance (qb):drained loading(applicable to coarse grained soilsandslow loading in fine grained soils)fctn(φ , σvo , L, d, Dr)Pure Empirical Methods:Enable evaluations of fp and qb directlyusing qc (or qt), and/or fs and/or u2Semi-Empirical Methods:Enable evaluations of fp and qbusing qc (or qt), and/or fsalong with additional parameters (σrδ φ , K, σvo , L, d, su, Dr, plugging)Fig. 1 Alternative paths for CPT-based evaluations of fp and qbcomponents of pile capacity4 Chronology of Evolution4.1 Early WorkThe early efforts to use CPT data for pile design weredirected toward estimating the maximum pile embedment depth (Begemann 1969). Accordingly, the maximum driving depth for a concrete pile was broadlytaken as the depth where the total cone resistance (pointresistance plus total sleeve friction) reached 45–50 kN.Based on a comparative field investigation on qb of a0.426 m jacked square concrete pile and average qc ofsix CPT soundings in medium dense sand, Plantema(1948) concluded that qb & qc. Huizinga (1951)reported on the early efforts in Holland to estimate qbfrom CPT data. Hence, qb was computed using averageqc in the zone of soil that would be influenced by thepile base to account for varying qc values; although nospecific averaging procedure was detailed. Huizinganoted from his data that, on the average, measuredvalues of total shaft friction (Qs) were about twice thevalue computed by assuming equal unit friction on therods and pile. During that period the only measure ofside friction which could be obtained was total frictionon the entire length of push-rods.Meyerhoff (1951) concluded that for deep foundations bearing in sand, CPT logs provide betterestimates of pile capacity directly compared to useof theoretical bearing capacity equations. However, hehighlighted the possible anomaly due to scale effect onCPT qc versus pile qb occurring from the difference incone and pile diameters, especially for dense sandlayers. Van der Veen and Boersma (1957) explored thescale effect on CPT qc to pile qb relationship. From theresults of load tests on 15 concrete piles and CPTsoundings, they concluded that pile qb can be reasonably evaluated using an average of qc over a depthinterval from 3.75d above the pile base to 1.0d below,where d is pile diameter. In a similar study on 88 pileload tests, Menzenbach (1961) identified the type andstrength of soil as additional factors to be consideredwhile relating pile qb to CPT qc.4.2 Bogdanovic MethodBogdanovic (1961) used CPT data to analyze theresults of load tests on driven and jacked concrete pilesin soft clay overlying dense gravelly sand in Yugoslavia. Bogdanovic showed that the pile fp may beconveniently calculated as CPT fs times the ratio ofpenetrometer to pile circumference, while pile qbestimates are obtained by averaging CPT qc valuesfrom an envelope drawn through the minimum qcvalues rather than by averaging the actual values overa depth interval from 4.0d above the pile base to2.0d below the base. Hence, the concept of minimumpath rule was introduced in the averaging procedure.4.3 Meyerhof MethodMeyerhof (1956), recognizing the empirical correlations between standard penetration test (SPT) andstatic CPT, performed an analysis of the measuredresults in pile loading tests and CPT readings. Hedeveloped a method to estimate the bearing capacitycomponents (fp and qb) of driven displacement pilesand piles with small displacement (e.g. steel H piles) incohesionless soils from qc and fs.Meyerhof (1976) documented the effects of pileembedment in the different bearing strata (Fig. 2),length of pile, and the method of pile installation (e.g.driving, drilling etc.). Accordingly, appropriate allowances were introduced in the design equations. Meyerhof (1983) further expanded the database of CPT123
984Geotech Geol Eng (2013) 31:979–10094.4 De Beer’s ContributionDe Beer (1963) provided significant insight into thescale effect problem on the pile qb evaluation. Heconsidered penetrometers of different sizes andshowed that at some depth all penetrometers attainthe same qc values. The effect of this phenomenon onqb of a pile driven into a dense layer underlying aweaker layer can be seen by referring to Fig. 4. If thelayers were penetrated by a cone penetrometer ofsmall diameter (3.57 cm), the depth of embedmenteffect would be minimal and the qc would ideallyfollow the profile of dashed curve. However, if a largediameter pile were pushed into the second layer, the qbwould not equal that of the negligible diameter probeuntil the pile had reached a critical depth (Lc)corresponding to the deep foundation condition. DeBeer showed that it is reasonable to assume that thepile base resistance qb curve varies linearly over Lc(solid curve); thus, the pile resistance at any intermediate depth could be determined if the small diameterqc curve and Lc were known. He further showed that Lcis a function of the foundation size and sand density.4.5 Vesić and Kerisel MethodVesić (1964) and Kerisel (1964) performed experiments on piles and penetrometers (45–320 mm diameter) in sands placed at different densities in rigid walllaboratory test chambers. Both the sets of experimentsFig. 2 Pile unit baseresistance and depth in sandstratum beneath weak soillayer: a thick sand stratum;b thin sand stratumoverlying weak soil (afterMeyerhof 1976)30Pile Unit Base Resistance, qb (MPa)and load tests on driven and drilled shafts to present arefined version of design equations and charts, wherethe effects of pile base diameter were also integrated(Fig. 3).25201510500510152025Fig. 3 Relationship between pile base resistance and CPT qc insand (after Meyerhof 1983)confirmed De Beer’s theory concerning the depth ofembedment effect. According to Vesić’s experimentsthe values for Lc vary from about 6d for loose sand toabout 25d for dense sand, whereas, Kerisel’s experiments indicate Lc values of about 5d for loose sandand approximately 20d for dense sand.4.6 Begemann MethodBegemann (1963) noted from the concurrent work bythe Dutch engineers that qb for a pile with its base atthe interface between two soil layers is approximatelyequal to the average qc of the two layers, concludingthat soil above and below the pile base contributedalmost equally to the pile qb. He assumed that thefailure at the pile base followed the classic logarithmicspiral shape, although no clear evidence was given tosupport this assertion for the case of a deep H 20d 10dqbH’ 10dH 20dql2(a)12330Cone Tip Resistance, qc (MPa)DenseSandql2(b)WeakSoil
Geotech Geol Eng (2013) 31:979–10099853.57 cm penetrometer qc curveWeak SoilPenetration Resistanceof dynamic penetration tests. Making use of correlations, they obtained the values of qc and fs that wouldotherwise be measured in a static CPT. By introducingcertain empirically derived factors for different pileand soil types from load test results, design equationswere proposed to estimate the bearing capacity ofsingle piles.LcStrong SoilDepth4.8 Nottingham and Schmertmann MethodLarge diameter qb curveFig. 4 Scale effect diagram (adapted from De Beer 1963)He suggested that it is usually adequate to average qcof the upper layer to a distance 8d above the pile baseand that of the lower layer over 3.5d below the base.For the lower layer, additional weight should be givento the sounding value at a depth of 3.5d to account forthe assumed logarithmic shape where a significantportion of rupture surface runs near horizontally.Nottingham (1975) reported that this method wassubsequently further refined to account for the presence of thin layers or zones of weak soil which couldaffect the shape and position of the rupture surface atthe pile base (Fig. 5).Begemann (1965, 1969) developed design curvesfor predicting uplift pile friction capacity based on theresults of a large number of uplift load tests and CPTsoundings from his adhesion jacket cone developed in1953. The driven piles database in these studiesconsisted of tapered wooden piles, pointed baseprefabricated concrete piles with 45 point, pointlessbase prefabricated concrete piles, OE steel pipe piles,and I-beam piles. The design curves along with anexample application are shown in Fig. 6. Begemann(1969) also reported that some tests indicate negligibledifference between friction in uplift and compression.Apparently, until around mid-70’s, no noteworthywork was documented pertaining to the use of CPTdata for predicting pile capacity in clays. This may beattributed to the fact that CPT methods were beingdeveloped in regions where the geology is such thatpiles are driven through soft clays and organic soils intounderlying sands. Nottingham (1975) is noted to be thefirst to explored different combinations of soil types todevelop design equations applicable to a wide varietyof situations. He also studied the applicability of bothmechanical and electrical friction sleeve penetrometers for predicting the load capacity of displacementpiles. His study included 108 load tests on large-scalemodel piles. Three types of model piles were used: a102 mm square precast concrete pile; a 102 mmdiameter pipe pile; and a step-taper pile with sectiondiameters ranging from 74 to 115 mm. Data from loadtests on 15 full-scale piles were used to verify theequations developed from the model pile tests. Heconcluded that the Begemann’s procedure was a validdesign tool for investigating pile qb in both granular aswell as cohesive soils using either mechanical orelectrical penetrometer data. However, he introduced areduction factor for mechanical penetrometer used inclays to account for possible increase in qc resultingfrom friction on the tip mantle. Further, he introducednew design equations and charts (Figs. 7, 8) fordifferent pile and penetrometer types for both sandand clay. This method has been commonly referred toas Schmertmann method after some refinement workby Schmertmann (1978), where limiting qb values wereimposed for different soil types and some nondisplacement piles were also included.4.9 Penpile Method4.7 Aoki and Velloso MethodAoki and Velloso (1975) presented a method toestimate the bearing capacity of piles from the resultsClisby et al. (1978) proposed simple design equations,frequently recognized as Penpile method, for theMississippi Department of Transportation. The123
986Geotech Geol Eng (2013) 31:979–1009Fig. 5 Begemannprocedure for predicting pileqb (adapted from Begemann1963)qcqb (qc1 qc2)/2qc1 Average qc over a distance of xdbelow the pile tip (path a-b-c). Sum qcvalues in both the downward (path a-b)and upward (path b-c) directions. Useactual qc values along path a-b andminimum path rule along path b-c.Compute qc1 for x-values from 0.7 to 3.75and use the minimum qc1 value obtained.edDepth8dLcxdaqc2 Average qc over a distance of 8dabove the pile tip (path c-e). Use theminimum path rule as for path b-c inthe qc1 computations.b b20Cone Tip Resistance, qc (MPa)Fig. 6 Begemann’s graphfor predicting pile fp(adapted from 0140160180200Sleeve Friction, fs (kPa)Example CalculationsPlot point A for measured average qc 6.4 MPa, and fs 130 kPaConnect points O and A; extend to point BExtend horizontally to point C on curve 2 for prefab pile with 45o pointExtend vertically down from point CMeasure reduction coefficient 55%Estimate fp 130 kPa x 0.55 71.50 kPamethod is applicable to both sand and clay andprovides estimates of pile fp as well as qb. Theyrecommended that the pile qb should be based on the12310080604020Reduction Coefficient (%)Legend1: Wooden pile2: Pointed base prefab concrete pilewith 45o point3: OE steel pipe pile and I-beam pile4: Pointless base prefab concrete pileaverage qc of three CPT qc readings taken close to thepile base. Later reliability studies on driven and jackedpiles (e.g. Abu-Farsakh and Titi 2004; Cai et al. 2009),
Penetrometer-pile friction ratio, αcGeotech Geol Eng (2013) 31:979–1009987direction of loading (compression vs. tension). In thismethod upper limits of 15 MPa and 120 kPa areimposed on qb and fs, respectively.1.4Steel Piles1.2Concrete and Timber Piles1.00.84.11 Philipponnat Method0.60.40.20.0050100150200Penetrometer Sleeve Friction, fsPenetrometer-pile friction ratio, αsFig. 7 Design curves for pile fp in clays (after Nottingham1975; Schmertmann 1978)3.0Steel Pipe PileTimber PileSquare Concrete Pile2.52.01.51.0Philipponnat (1980) attempted to develop a simpledirect CPT-based pile design method by takingaccount for large variety of piles and soils. His methodwas calibrated using a database of 44 different types ofinstrumented piles, load tested in different soil types.Appropriate coefficients were introduced in the designequations for estimating pile fp to account for the pileand soil types. Additionally limiting values of fp werealso imposed based on the pile type. As for pile qb,Philipponnat recommended equal weights for theaverage qc values of the soil layers 3d above andbelow the pile base. However, he suggested removalof extreme values (spikes) from the CPT qc profiles asthese are not expected to have significant impact on qbof piles much larger in size than the penetrometers.0.54.12 LCPC Method0.0010203040Pile depth to diameter ratio, z/dFig. 8 Design curves for pile fp in sand (after Nottingham 1975;Schmertmann 1978)however, indicated that this method underestimatesthe pile capacity significantly.4.10 European MethodDe Ruiter and Beringen (1979) proposed another CPTbased method founded on the experience gained onpile foundations for large offshore structures innorthern part of North Sea, with great water depthand adverse sea conditions. This method, also knownas European method or Dutch method, uses differentprocedures for clay and sand. In clay, the undrainedshear strength (su) for each soil layer is first evaluatedfrom qc using cone bearing factor (Nkt); pile qb is thencalculated using bearing capacity factor (Nc 9),while pile fp uses adhesion factor (a) depending uponthe stress history of clay. In sand, pile qb is calculatedsimilar to Schmertmann method, while pile fp is afunction of both fs and qc of respective layers, and theBustamante and Gianeselli (1982) proposed a methodbased on the analysis of 197 full-scale static load tests(including compression and uplift) on 96 pile foundations from 48 sites in soils made up of such variedmaterials as clay, silt, sand, gravel, weathered rock,mud, peat, weathered chalk, and marl. The foundations taken into account include both displacement andnon-displacement piles. This method is commonlyknown as the Laboratoire Central des Ponts etChaussées (LCPC) method or French method. Theapproach offers versatility in the variety and types ofdifferent deep foundation systems and geomaterialsthat can be accommodated. The LCPC method reliessolely on qc readings for evaluating fp along the pileshaft and for qb beneath the pile base. Bustamante andFrank (1997) presented a simplified version of theLCPC method. Poulos (1989) offered summary
geophysical-geotechnical seismic CPT to evaluate the complete axial pile load-displacement response. Keywords Pile foundation Cone penetration test Piezocone penetration test Pile load test Axial pile capacity 1 Introduction The static axial capacity (Q t) of pile foundations is calculated from the sum of the shaft capacity (Q s) and base .