Transcription
GSJ: Volume 8, Issue 1, January 2020ISSN 2320-91862823GSJ: Volume 8, Issue 1, January 2020, Online: ISSN 2320-9186www.globalscientificjournal.comBearing capacity and settlement assessment of the soil of Kotto(NorthEast of Douala) using static penetration and laboratory testingMANEFOUET Bertille Ilalie(1),DIFFO TIOUA Delanoy(2),KENFACK Jean Victor(3)andKATTE YATO Valentine(4)(1, 2, 3)Department of Earth sciences, Faculty of science, The University of Dschang, P.O. Box 67 Dschang(Cameroon)E-mail: (1)ilaliebertillem@gmail.com; (2)delanoydiffo@gmail.com; (3)victor.kenfack@univ-dschang.org(4)Department of Civil Engineering and Forestry, Techniques, HTTTC, The University of Bamenda, P.O. Box 39,Bambili, North West Region, Cameroon, E-mail: ykatte@yahoo.comAbstract:Thisstudy reports on the assessment of the bearing capacity and soil settlement in Kotto, located, in the northeast of Douala(Cameroon)where modern buildings are rising daily. Themethodology entailsinthe analysis of the resultsfrom soil identification, direct shear, oedometric and static penetrometertests.Three objectives were envisaged, firstly,the knowledge of the geotechnical nature of the soils of this area,secondlythe knowledge of the mechanical propertiesofthese soils, andfinally, a comparative study of the results of laboratory and in-situ tests. The testing procedures adoptedwere in accordance with French normsNF P 94-113 for the static penetrometer test, NF P 94-071-1 for the Casagrandeshear test box, and the XP P 94- 090-1 for the oedometer test. The Terzaghi principle was utilized in calculating thebearing capacity. The results are quite expressive in terms of the difference between the results of laboratory and in-situmechanical tests: the initial effective vertical stress between the depths 2 and 2.30 m is 23 kPa, while the averagebearing capacity at 2 m depth is 322.5 kPa. In general, the bearing capacity of this area is low and requires soilimprovement for structures with a load greater than 245 kPa. The settlement increases with depth, at the depth of 2 m, itcan atain a value of 4.80 cm.Key words: bearing capacity, settlement, mechanical tests, modern buildings, Kotto.IntroductionCameroonis located between West and Central Africa and currently experiencing huge construction activities.The quality of construction of civil engineering works is imperative. Therefore, geotechnical studies are required tofurnish the necessary soil parameters required in the design and construction of stable sustainable structures. Preliminaryevaluation of mechanical characteristics and soil compressibility is not common practice by many project managers.There has been a number of recent building structural collapse such as the collapse of a six storey house underconstruction in Douala in September 2015, the collapse of five storeybuilding in Douala in the month of June 2016 andthe collapse of a five storeybuilding in Dschang in September 2017,is a wake up call for tough scientific and technicalapproach in the design and construction of buildings.Thus, it is urgent to master soil mechanics in the sub-region. Hencethis study on "bearing capacity and settlement assessment of the soil of Kotto (Douala North-east) based on the staticpenetration test and on laboratory tests". It mainly aims to determine the lift and compressibility of different soil layers. Itis obvious that this goal can only be achieved through the identification and classification of soil, the determination ofpeak ground resistance, the evaluation of settlement through a practical case.The present work is intended to be a critical analysis of all the activities generally performed in the analysis ofthe foundation soil of buildings in the city of Douala, specifically in the suburb of Kotto. This will be done throughsurveys and tests carried out in the laboratory as well as in situ. To achieve this, the work will be organized around threepoints. First of all the generalities on the study area, then the brief presentation of the methodology used, then apresentation of the different results obtained followed by their interpretation and discussion.I. Presentation of the study siteThe study site was in Kotto which is the administrative district of the Douala V. It is located at an altitude of46.0 meters, the GPS coordinates are 4 5'5.64 '' of north latitude and 9 45'20.05 '' of east longitude. Douala is theeconomic capital and is one of the coastal cities of Cameroon. It extends over a plain and is subdivided into six districts.It is a port city located on the edge of the Atlantic Ocean, at the bottom of the Gulf of Guinea, at the estuary of the WouriRiver.The relief consists of a set of valleys mostly flat-bottomed, wet or dry.The climate is equatorial of theGSJ 2020www.globalscientificjournal.com
GSJ: Volume 8, Issue 1, January 2020ISSN 2320-91862824Cameroonian type and coastal sub-type with two seasons which are: the rainy season which extends from March toNovember and the dry season which extends from December toFebruary. It is characterized by a constant temperature,around 27.5 C and very abundant rainfall. The air is almost constantly saturated with moisture.The study area is located in the coastal plain of Cameroon stretching from the eastern slopes of MountCameroon to the estuary of the Sanaga river in the Douala sedimentary basin. This triangular basin has an area of about7000 square kilometers (Ngueutchoua, 1996). The Douala Basin has suffered multiple transgressions during itsgeological history. The work of Njike (1984), Regnoult(1986), Ngueutchoua (1996), Mbesse et al(2012) highlights acertain number of formations. The lithology of the Douala basin from top to bottom shows several formations groupedaccording to their age of deposition: Quaternary, Tertiary and secondary sediments, with thestudy arealocated in theTertiary formation. The Tertiary sediments are represented by the Nkapa, Souellaba and Matanda formations. They arecharacterized by marls, sandstones, silts, black or brown clays, clayey sands and fine sands.II.Material and methodsII.1. TestsCommon test have been used (Manefouet, 2012;Enyegué, 2016). The water content was determined inaccordance with the NF P 94-050 standards (AFNOR, 1995). The Atterberg limits tests were carried out in accordancewith the NF P 94-051 (AFNOR, 1993).The geotechnical parameters are intended to identify the soil and characterize its state by means of the clayconsistency. The three distinguishing characteristics are the liquid limit LL, plastic limit PL and the plasticity index PIwhich gives information on the extent on the field soil plasticity.The shear test was carried using the shear box test according to the NF P 94-071-1 (AFNOR, 1994). This testwas carried out under drained conditions on all the samples obtained. The shear strength parameters were obtained fromthe slope of the line of best pit giving the angle of friction φ' (Effective angle of internal friction) and the ordinate at theorigin of line giving the cohesion c'. This line represents the shear stress τ as a function of the normal stress σ' andfriction angle φ'.The Odometric test was carried out according to the standard XP P 94-090-1 (AFNOR, 1997), this test makes itpossible to establish, for a given sample, two types of curves: the compressibility curve(which indicates the totalsettlement as a function of the logarithm of the applied stress) and the consolidation curves (which give the settlement ofthe sample as a function of time under application of a constant stress).The oedometric or compressibility curve 𝑒𝑒 𝑣𝑣 )]giving the variations of the void ratio (e) of the soil as a function of the vertical effective stress applied tothe sample will make it possible to determine the initialvoid ratio of the soil in-situ (𝑒𝑒0 ), the compression index Cc , therecompression index Cs and the maximum past effective stress (preconsolidation) pressure𝜎𝜎𝑝𝑝′ .The static penetration test was determined inAccordance with NF P 94-113standard (AFNOR, 1996). It aims todetermine the resistance to penetration of a standardized cone and possibly the lateral friction mobilized on the sleeve.The parameters deduced from the measurements of the static penetration test are:- the static tip resistance qc which is equal to the ratio between the tipstress Qc and the cross section Ac of thebase of the cone, namely:𝑄𝑄𝑞𝑞𝑐𝑐 𝑐𝑐 (1)--𝐴𝐴𝐶𝐶the unit lateral friction fs which is equal to the ratio between the lateral friction force on the sleeve Qs and thelateral surface area of the sleeve As, and is given by:𝑄𝑄𝑓𝑓𝑠𝑠 𝑠𝑠 (2)𝐴𝐴𝑠𝑠the friction ratio Rf in %, which is equal to the ratio between the unit lateral friction fs and the static peakresistance qc, that is:𝑓𝑓𝑠𝑠𝑅𝑅𝑓𝑓 (3)𝑞𝑞 𝑐𝑐II.2. Calculation of stress and settlementThe calculation of the shear strength of the soil layers will be performed from static penetration test. Theultimate stress at the cone tip is given as(fascicule 62-V, 1993):𝑞𝑞𝑢𝑢 𝑘𝑘𝑐𝑐 𝑞𝑞𝑐𝑐𝑐𝑐 γD (4)Where𝐵𝐵 𝐷𝐷𝑘𝑘𝑐𝑐 0.14 1 0.35 0.6 0.4 𝑒𝑒 (5)𝐿𝐿1𝐵𝐵𝐷𝐷 𝑏𝑏𝑞𝑞𝑐𝑐𝑐𝑐 (6)𝑞𝑞 (𝑧𝑧)𝑑𝑑𝑑𝑑 3𝑎𝑎 𝑏𝑏 𝐷𝐷 3𝑎𝑎 𝑐𝑐𝑐𝑐Where: B: width of foundation, L: length, D: height of foundation, De: height of the foundation elementcontained in bearer layer, 𝑘𝑘𝑐𝑐 : lift factor, 𝑞𝑞𝑐𝑐𝑐𝑐 : even tip equivalent strength, 𝑞𝑞𝑐𝑐𝑐𝑐 : corrected equivalent strength,a B/2 if B 1 m or a 0,5 m if B 1 m; b min {a ; h}𝑞𝑞The permissible stress is given by the expression : 𝜎𝜎𝑝𝑝𝑝𝑝𝑝𝑝𝑝𝑝 𝑢𝑢 with F 3.𝐹𝐹GSJ 2020www.globalscientificjournal.com
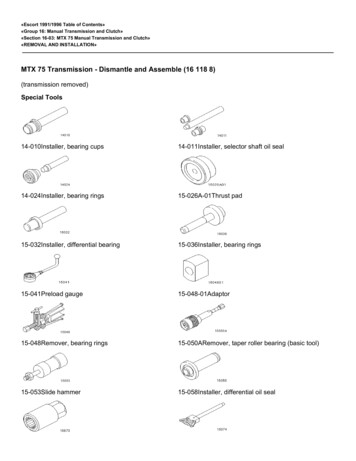
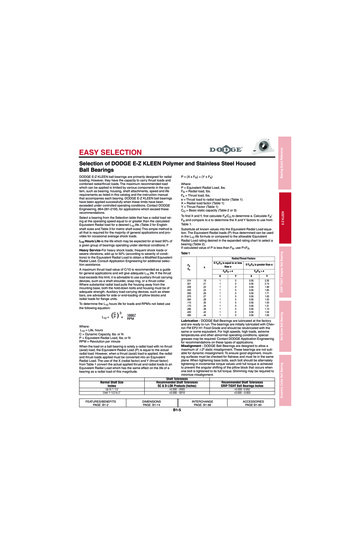
GSJ: Volume 8, Issue 1, January 2020ISSN 2320-91862825The settlement (S) under the footing is given by the oedometric method. In this case, the effective stress is lowerthan the pre-consolidation pressure, so the overload first causes the recompression of the soil to a voids ratiocorresponding to the pre-consolidation pressure, and then it reaches a unequaled level, causing a strong compression ofthe soil and the development of a deeper settlement, hence the use of both index (compression index and recompressionindex). The settlement of overconsolidated soil is given by (Robitaille and Tremblays,1997; Tchouani, 1999 ; CallaudM., 2004):𝑆𝑆 𝐻𝐻0 𝐶𝐶𝑠𝑠1 𝑒𝑒 0𝑙𝑙𝑙𝑙𝑙𝑙 𝜎𝜎′ 𝑝𝑝𝜎𝜎′ 𝑣𝑣0 𝐶𝐶𝑐𝑐1 𝑒𝑒0𝜎𝜎′ 𝑣𝑣0 𝜎𝜎′ 𝑣𝑣𝑙𝑙𝑙𝑙𝑙𝑙 𝜎𝜎′ 𝑝𝑝 (7)H0is initial thickness of the considered layer. The surcharge of the soil above the depth of settlement (zi is thethickness of the layers above the stress reference point) is given by:(8)𝜎𝜎𝑣𝑣′ 0 𝛾𝛾𝑖𝑖 . 𝑧𝑧𝑖𝑖The stress reference point is usually the center of the layer of which settlement is calculated.Δ′𝜎𝜎 𝑣𝑣 Δ𝜎𝜎𝑣𝑣′ (𝑧𝑧) 𝐼𝐼𝑞𝑞 (9)Stress increase brought by the footing to the z-side identified from the base of the footing.I is the coefficient ofinfluence according to the dimensions of the footing and the depth z and read on charts (Curve for determining theincrease of vertical stresses under the corner of a uniformly loaded rectangular surface).q represent the uniform pressureor stress applied by the footing. The soil initial void ratio in place is noted eo. Cc and Cs are respectively the compressionindex and the recompression index. The preconsolidation pressure is notedσ'p and the coefficients of consolidation 𝐶𝐶𝑣𝑣 .The calculation is made at the corner of the footing and the origin of the depth is taken at the level of the footing.III. RESULTS AND DISCUSSIONIII.1. Field resultsIII.1.1. Manual auger sampling resultsManual auger drilling has allowed us to determine the soil profile in place at a depth of 3 m, and this is presentedin figure 1.This section of the soil is identical for the different trial pits that have been made. It shows the homogeneity ofthe formation that is in place.0.00 mOrganicsoil0.15 mClayeysand3.00 mFigure n 1: Lithological soil section with manual auger3.1.2. Results of static penetrometer surveysThe results of the static penetrometer testsare given in table n 3. These were processed to obtain equivalent peakresistance, ultimate stress, and the allowable soil stress. The processing was obtained using the following assumptions:- Square footings of size B 2 m;- Penetrometric lift factor Kc taken for soil type A sand from Fascicle 62-V.The permissible stress was calculated at the Serviceability Limit State (SLS) and the Ultimate Limit State (ULS).To allow for the design using the worst conditions,the SLS values was considered with a factor of safety of 3. Thecurves resulting from the exploitation of the field results are presented in Figure n 2.Table n 1 summarizes the peak resistance ranges qc of each trial pit per ground layer traversed. According to thistable, it is found that the different layers are of uniform thickness. This shows that it is homogeneous soil. An abnormalpeak of resistance at a depth of 6.80 m is observed for CPT1 (Cone Penetration Test 1), a sharp increase in peakresistance from 17.80 m for CPT 2, 3, and 4 until blocking. On the other hand for the CPT 1 there is a decay showingprobability of a rocky block which does not extend in all the soil.GSJ 2020www.globalscientificjournal.com
GSJ: Volume 8, Issue 1, January 2020ISSN 2320-91862826(MPa)Figure n 2: curves of the CPT static penetration test 1GSJ 2020www.globalscientificjournal.com
GSJ: Volume 8, Issue 1, January 2020ISSN 2320-91862827Table n 1:Range ofPeak Resistance by boring and perlayerN of boringDepth (m)0.00 – 3.803.80 – 7.607.60 – 9.009.00 – 10.4010.40 – 1.,8015.80 – 18.0018.00 – 20.00 200.00 – 4.804.80 – 7.607.60 – 9.809.80 – 12.4012.40 – 15.6015.60 – 17.8017.80 – 19.20 19.20CPT 1CPT 2qc (MPa)0.2 – 1.82.6 – 14.25.0 – 10.29.2 – 15.83.4 – 13.21.8 – 3.43.6 - 16Stopping0.6 – 1.82.4 – 4.24.2 – 12.24.6 – 14.08.4 – 17.02.8 – 8.217.0 – 28.0 28.0Layers1st layer2nd layer3rd layer4th layer5th layer6th layer7th layerStopping1st layer2nd layer3rd layer4th layer5th layer6th layer7th layerRefusalN of boringCPT 3CPT4Prof (m)0.00 – 4.004.00 – 7.607.60 – 9.809.80 – 13.0013.00 – 15.6015.60 – 17.8017.80 – 19.40 19.400.00 – 4.604.60 – 7.607.60 – 9.809.80 – 12.4012.40 – 15.6015.60 – 17.8017.80 19.60 19.60qc (MPa)0.4 – 2.02.2 – 8.66.0 – 11.44.0 – 15.09.0 – 15.22.6 – 6.09.8 – 26.0 26.00.6 – 2.02.2 – 5.85.6 – 11.44.4 – 14.67.2 – 16.63.0 – 6.613.4 - 28.0 28.0Layers1st layer2nd layer3rd layer4th layer5th layer6th layer7th layerRefusal1st layer2nd layer3rd layer4th layer5th layer6th layer7th layerRefusalThe profiles of the average allowable stress obtained as a function of depth are recorded in Tablen 2.From this table, the permissible stresses at SLS vary from one survey to another depending on the depth. Thesizing of the foundations will be done with the most unfavorable values of the stresses at different depths. Thelayer to be proposed as the one to be the recommended base of the foundations must have a permissible stress atthe serviceable limit state greater than or equal to the total ultimate load.III.2. Results of laboratory testsIII.2.1. Results of soil identification testsThe results of soil identification (water content, specific gravity, particle size analysis and Atterberglimits) are summarized in Table n 2. The unit weight of soil (γ) is 19.27 𝑘𝑘𝑘𝑘/𝑚𝑚3 .The HRB classification is the one used.200 – 2.300.08Percent passing by -7-6 ic1.0IGHRB2.0ω (%)Atterberg Limits (%)(Sieve openning - mm)ɣs (T/m3)Particle size distribution(m)samplingDepth ofTable n 2: Summary of soil identification resultsPlasticclayey sandThe plasticity index indicates a plastic soil. Manual auger drilling has demonstrated the nature of thematerial as clayey sand, which is confirmed by the HRB classification and is class A-7-6 (4).III.2.2. Results of mechanical tests on intact samplesThe results of the shear box test and oedometric tests are shown in Table n 4.Table n 4: Summary of results of mechanical tests on intact sampleSampleDepth (m)NatureWater content ( %)Unit weight of the solid phase (γs - kN/m3)Total unit weight (γh - kN/m3)Preconsolidation pressure (σ’p – kPa)Effective overburden pressure (σ’vo – kPa)Initial void ratio eoŒdometric testCompression index CcRecompression index CrOedometric modulus (kPa)Permeability coefficient (k - cm/s)Angle of internal friction (φ –degree)Straight shear testCohesion ( c –kPa)GSJ 2020www.globalscientificjournal.com2.00 – 2.30Yellowish clayey 34.170.821
GSJ: Volume 8, Issue 1, January 2020ISSN 2320-91862828Table n 3:Summary of the results of static penetrometer surveysCPT 1Depth(m)CPT )𝝈𝝈𝒑𝒑𝒑𝒑𝒑𝒑𝒑𝒑 (ULS)(MPa)qce(MPa)Kcqu(MPa)CPT ���𝒑𝒑𝒑 𝒑𝒑(SLS)(MPa)qce(MPa)Kcqu(MPa)CPT 32.67512.250.506.132.0423.0631.6982.548GSJ 2020www.globalscientificjournal.com
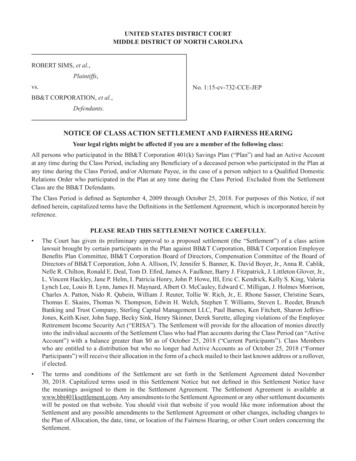
GSJ: Volume 8, Issue 1, January 2020ISSN 2320-91862829The results obtained during these tests allow to calculate the settlement. The curve related to the shear testis given in Figure n 3 and that of the compressibility curve in Figure n 4.9080à 0,28barà 0,54bar7060(b)80.0y 0.691x 0.82170.0τ (kPa)Shear stress τ 0.000.200.400.600.80Strain (cm)1.000 10 20 30 40 50 60 70 80 90 100 110 120σN (kPa)Figuren 3: Shear test results:(a) Shear stress curve, (b) Shear stress lineMσ‘pDCLABNNormal stress (kPa)Figuren 4: Curve of compressibilityIII.3. Foundation sizing and settlement computationIII.3.1. Dimensioning of foundations Primary dataAs in the work of Kognonsa (2004), it will be considered in this work the following parameters for thedesign and calculation of foundations:- shallow foundation with isolated footing;- post of width b 20 cm and length l 30 cm;- service load at SLS Pser 610.60 kN;- the characteristic strength of concrete at 28 days is 25.00 MPa.Foundation sizing will be done according to the following principles:- Standard for geotechnical calculations: DTU 13.12- Standard for reinforced concrete calculations: BAEL 91 mod. 99 Penetrometer caseThe calculation of the shallow foundations was made between 1 and 6 m deep (σpermacceptable from5m). The allowable SLS stress vary with depth (Table n 5) and the lowest values of the results were retained;therefore, the foundation calculation will be done with these results. The results of the foundation calculation atSLS are shown in Table n 5.GSJ 2020www.globalscientificjournal.com
GSJ: Volume 8, Issue 1, January 2020ISSN 2320-91862830Table n 5: Results of the calculation of the dimensions of the footingsDepth 50.359Pser(kN)610.6610.6610.6610.6610.6610.6b (m)l 0B (m)2.502.001.701.551.301.10L (m)3.753.052.602.301.951.60footingsS (m²)9.386.104.423.572.541.76d (m)0.860.690.580.500.410.33h 1380.1710.2410.347In view of the low values of the permissible stress (Table n 5), the dimensions of the footings are verylarge, which is not advantageous. At 5 m depth, σperm 0.245 MPa and the dimensions of the footings are𝑃𝑃acceptable and the safety is verified thanks to relation 𝑠𝑠𝑠𝑠𝑠𝑠 𝜎𝜎𝑝𝑝𝑝𝑝𝑝𝑝𝑝𝑝 ; nevertheless shallow foundations cannot be𝑆𝑆designedat such depth, as in the work of Hassan (2010). So these soils do not easily permit the use ofshallowfoundations. At least to make an improvement with viabilitymaterial as the case of the pozzolan present in theneighbourhood.III.3.2. Calculation of settlementThe results of the settlement calculation are summarized in Table 6.Table n 6: Settlement computation resultsWidth B (m)Length L (m)Depth Z (m)B/ZL/ZInfluence coefficientPressure q (kPa)σ’v0 (kPa)Δσ’v (kPa)Settlement S .490.03257.8119.717.4177.087.6910.43240.39The calculation of settlement bellow the base of foundation gives values which increase with depthrightup to 2 m under the footing, and these values are acceptable, whereas from 3 meters they are not. Thesettlements are acceptable at 2 m because the maximum value for settlement under isolated footing is 6.50 cm.III.4.1. Technical discussionSoil surveys were carried out by the mechanical point penetrometer at a depth of 20 m. The lithology ofthe site presents seven layers of soil. The thicknesses of each of the layers as well as their peak resistance rangesare given in table n 7.Table n 7: Summary of Soil Bearings per r6thlayer7thlayerDepth (m)0.00 – 4.004.00 – 7.607.60 – 9.809.80 – 13.0013.00 – 15.6015.60 – 17.8017.80 – 19.60qc (Mpa)0.4 – 2.02.2 – 8.66.0 – 11.44.0 – 15.09.0 – 15.22.6 – 6.63.6 – 28.0σpermatSLS (Mpa)0.060 – 0.2660.213 – 1.4631.432 – 1.8351.903 – 2.3501.685 – 2.5141.505 – 3.0610.751 – 2.664According to Table n 7, the first layer of soil has low values of permissible stress at SLS, despite thefact that some trial pits have some acceptable values (0.266 MPa) at 4 meters depth. It appears that this layer isnot favorable for the sizing of the footings. This leads to a depth of foundation calculation of up to 6 meters inthe soil (acceptable σperm) with optimum dimensions being (1.30 m x 1.95 m) for the footings (Table n 5). This𝑃𝑃was done for a minimum admissible stress σperm 0.245 MPa and safety is respected ( 𝑠𝑠𝑠𝑠𝑠𝑠 𝜎𝜎𝑝𝑝𝑝𝑝𝑝𝑝𝑝𝑝 ).𝑆𝑆The optimization of these dimensions led to the calculation of settlements (Table n 6). At2 metersdeep,it is estimated at 4.80 cm. According to the recommendations of the Fourth Congress International of SoilMechanics, in London in 1956, this settlement (global settlement), is acceptable for any type of work.Permissible stresses increase overall with depth (figure n 5). Between 1 and 6 m depth, the increase islow (from 0 to 0.4 MPa for SLS and from 0 to 0.6 for ULS); at 6 m, an abrupt increase occurs up to 7 m (0.4 to1.35 MPa for SLS and 0.6 to 1.9 MPa for ULS); between 7 and 12 m, the admissible stresses increasemoderately (from 1.35 to 2.1 MPa for SLS and 1.9 to 3.25 MPa for ULS); between 12 and 15 m, the stressesdecrease rather (from 2.1 to 1.6 MPa for the SLS and from 3.25 to 2.6 MPa for the ULS); between 15 and 17 m,GSJ 2020www.globalscientificjournal.com
GSJ: Volume 8, Issue 1, January 2020ISSN 2320-91862831the stresses increase sufficiently (from 1.6 to 2.25 MPa for SLS and from 2.6 to 3.6 MPa for ULS); at 17 m thestresses decrease to 20 m (from 2.25 to 1.7 MPa for the SLS and from 3.6 to 2.5 MPa for ULS)00.51Stress and2settlement1.52.533.54024Depth (m)6810Mean σperm (ELS)(Mpa)Mean σperm (ELU)(MPa)Settlement (m)1214161820Figure n 5 : Stress and settlement as a function of depth(a)Mean 𝜎𝜎𝑝𝑝𝑝𝑝𝑝𝑝𝑝𝑝(b)at LSFigure n 6: correlation between settlement under footing and the permissible stress at (a) ULS and (b) SLSSettlement under a shallow foundation (between 1 and 4 m deep) increases relatively with thepermissible stress. Figures n 5 and n 6 show that the correlation which exists between the permissible stress andthe settlement is a polynomial of order 2. The correlation is practically perfect. It is expressed with a correlationcoefficient of 1.000 for soils at the serviceability limit state and 0.999 for soils at the ultimate limit state under ashallow foundation.The variation of the stresses or settlements of soils under a foundation is quite common in manyresearch works such as those of Corneille (2007) on the mechanical behavior of the ballasted columns loaded onrigid footings, as well Ali et al, (2010) on the pile limit load and settlement estimation from the pile load test, ofBouassida et al (2003) on the settlement of a rigid foundation soil carrying a reinforced concrete column.ConclusionThis study, as initially defined, was aimed primarily at determining the soil bearing pressure andcompressibility of the different soil layers of Kotto, located in the north-east of the city of Douala (Cameroon).In order to achieve this objective, 4 soil tests were carried using the SPT to a depth of about 20 m. This studyshows that the site has a variable lithology with 7 layers of distinct resistances. The results of the identificationtests show a fairly homogeneous soil consisting essentially of clayey sand, whose class is A-7-6 (4) according tothe HRB classification.It emerges that the first layer of soil has a low soil bearing pressure ranging from 0.6 bar to 1.54 bar(minimum value). These values show that this layer cannot bear isolated spreadfootings.The foundation calculation was thus made up to 6 meters in the soil and the results obtained weresatisfactory between 5 and 6 meters. Associated with the results of the oedometric test, the settlement calculationgave a value of 4.80 cm at 2 meters under the base of the footing.The calculation of the foundations has given very large dimensions in the first layer which is not acceptable fromthe economic point of view. In order to implement the dimensions obtained (1.30 mx 1.95 m), it isrecommended, from a technical point of view, to avoid the use of deep foundations, to make use of pozzolanicgravelmechanical stabilization present at the vicinity to improve upon the bearing capacity of the soil.GSJ 2020www.globalscientificjournal.com
GSJ: Volume 8, Issue 1, January 2020ISSN 2320-91862832Références[1]. AFNOR, 1993, Norme expérimentale NF P 94-051- Sols : reconnaissance et essais. Détermination des Limites d’Atterberg:méthodologie et procédures, 16p.[2]. AFNOR, 1994, Norme expérimentale NF P 94-071-1- Sols : reconnaissance et essais. Essai de cisaillement rectiligne direct à laboite : méthodologie et procédures, 16p.[3]. AFNOR, 1995, Norme expérimentale NF P 94-050- Sols : reconnaissance et essais. Détermination de la teneur en eau pondéraledes matériaux : méthodologie et procédures, 8p.[4]. AFNOR, 1996, Norme expérimentale NF P 94-113- Sols : reconnaissance et essais. Essai de pénétration statique : méthodologieet procédures, 16p.[5]. AFNOR, 1997, Norme expérimentale XP P 94-090-1- Sols : reconnaissance et essais. Essai œdométrique : méthodologie etprocédures, 24p.[6]. Ali H., Reiffsteck Ph., Baguelin F., Van de Graaf H., Bacconnet C. and Gourvès R., 2010. Calcul de la charge limite etestimation du tassement d’un pieu à partir de l’essai de chargement de pointe. XXVIIIèmes Rencontres Universitaires de GénieCivil – La Bourboule, Référence n 53, Session Géotechnique – Inspection, p12-21.[7]. Bouassida M., Guetif Z., De Duhan P et Dormieux L., 2003. Estimation par une approche variationnelle du tassement d’unefondation rigide sur sol renforcé par colonnes. Revue française de Géotechnique N 109, p21-29.[8]. Corneille S., 2009. Etude du comportement mécanique des colonnes ballastées chargées par des semelles rigides. Thèse écialité : Génie Civil Hydrosystèmes – Géotechnique, 290 p.[9]. hniquedessolsdefondationsdes ouvrages: application au projet de construction d’un bâtiment de type SS R 4 dans ineeringSciences,Universityof.Dschang, Cameroun, 103p.[10]. Fascicule 62 - titre V du CCTG, 1993. Règles techniques de conception et de calcul des fondations des ouvrages de génie civil.Numéro 93-3 T.O du B.O.M.E.L.T.[11]. Hassan Ali, 2010. Caractérisation améliorée des sols par l’essai de chargement de pointe au piézocônes. Application au calcul desfondations profondes. Doctorate thesis, University Blaise Pascal - Clermont II, France, 324 p.[12]. Kognonsa Blaise C., 2004. Méthodologie de dimensionnement des fondations d’ouvrages d’art en béton armé: application auxponts-routes sur micro-pieux. Project of the bend of study, University Cheikh Anta Diop of Dakar, Sénégal, 151p.[13]. Manefouet B.I., 2012.Études et contrôles géotechniques, conduite des essais. Internship intercourse ofnational (Cameroon)Labo
The static penetration test was determined inAccordance with NF P 94-113standard (AFNOR, 1996. It aims to ) determine the resistance to penetration of a standardized cone and possibly the lateral friction mobilized on sleeve. the The parameters deduced from the measurements of the static penetration test are: - the static tip resistance q. c