Transcription
Measuring Nutrient Removal,Calculating Nutrient BudgetsNutrient removal is the quantity of nutrients removed inplant material harvested from the field. All plant materialcontains quantities of the following elements: nitrogen (N),phosphorus (P), potassium (K), calcium (Ca), magnesium(Mg), sulfur (S), boron (B), chlorine (Cl), copper (Cu), iron(Fe), manganese (Mn), molybdenum (Mo), nickel (Ni), andzinc (Zn). The first six elements, N, P, K, Ca, Mg, and S, aretaken up in greater quantities by plants and are termedmacronutrients. They are present in concentrations of percent (%). The remaining nutrients are present in smaller concentrations, parts per million (ppm), and are therefore referred toas micronutrients. Directly measuring nutrient removal requiresmeasuring how much biomass is removed from the field aswell as the concentrations of nutrients in that biomass.Nutrient removal is commonly estimated from measured yields and published nutrient concentrations. For instance, the P removal rate of corn grain has been estimatedby multiplying 0.37 lb P2O5 bu 1 by the yield in bushels peracre. However, there are inaccuracies involved with usingaverage concentrations. For grains, much of this uncertaintycomes from the use of a volumetric measurement (bushel)rather than a mass measurement. For forages, nutrient removal coefficients usually do not specify how much moisture is assumed to exist.Nutrient removal estimates are most often used to calculate partial nutrient budgets, where total applications arecompared with total removals. Such budgets are partialbecause losses from erosion, runoff, and leaching are notconsidered, nor are additions from atmospheric deposition,sediment deposition, or collection of runoff from other areas. Partial nutrient budgets have implications for soil testlevels of immobile nutrients. Positive budgets result whenapplication rates exceed those of removal, and under suchconditions, soil test levels are expected to rise. Negativebudgets result when application rates are less than removalSummaryNutrient removal is the quantity ofnutrient removed from a specifiedarea. Commonly, farmers and advisers use published removal rates(on a yield unit basis) to estimatesuch quantities. However, measurements may be taken on thefarm to improve evaluations andprovide opportunities to furtherexamine and evaluate nutrientmanagement practices. The measurements that are essential tocalculating nutrient removal are: harvest area weight of moist plant material moisture content of harvestedplant portions nutrient concentration.Guidance is provided for usingthese measurements to calculate dry matter yield and nutrientremoval. In addition, nutrientbudgets are discussed, along withtheir evaluation using soil testdata. In the last section, two examples are provided. The firstconsiders a farming operationthat produces forage for internaluse. The second guides the readerthrough measurements and calculations used on a grain farm.T. Scott MurrellInternational Plant Nutrition Inst.3500 Parkway Lane, Suite 550Norcross, GA 30092(smurrell@ipni.net)Soil Science: Step-by-Step Field AnalysisSally Logsdon, Dave Clay, Demie Moore, and Teferi Tsegaye, editors 2008 Soil Science Society of America, 677 S. Segoe Road,Madison, WI 53711, USA www.soils.org159
and are expected to draw down soil test levels. Finally, balanced budgets, where applications equal removal, are expected to keep soil test levels of immobile nutrients fairlystable. Consequently, nutrient rates that balance nutrientbudgets are referred to as maintenance applications.Natural resource professionals can measure, ratherthan estimate, nutrient removals themselves on the farm.There are a couple of reasons for doing so. First, measuredremovals reflect variations in varieties, hybrids, and management practices used in a given area and are expected tobe more accurate than generalized estimates. Second, collecting such information provides new ways for advisersand farmers to work together, increasing communicationand providing new opportunities to improve managementpractices.Periodically calculating nutrient budgets from locallycollected information provides a check on whether or notimplemented practices are meeting management objectives.Although nutrient budgets are most commonly used in operations where manure scheduling and distribution are theprimary issues, they are useful in all production settings.In this chapter, guidance is provided for accomplishingtwo tasks: measuring nutrient removal ratescalculating nutrient budgets over timeWe focus on approaches that can be used on the farm andwe limit our discussion to forage and grain crops.Measuring Components of Nutrient RemovalMeasurements needed for calculate nutrient removalrates are: harvest areaweight of moist plant material harvested from the areamoisture content of plant materialnutrient concentration of plant materialThe first three measurements are used to determine howmuch total dry matter (DM) was harvested from a knownarea. Dry matter is plant material that contains 0% moisture.Its weight is termed dry weight. The amount of DM removedper acre is needed because nutrient concentrations determined by a laboratory are reported on a DM basis (Millsand Jones, 1996). At harvest, plant material contains someamount of moisture, so its weight is referred to as wet weight.160Soil Science: Step-by-Step Field Analysis
Determining the amount of moisture in the harvested plantmaterial makes it possible to subtract the weight of waterand find the DM yield per acre.Measuring Harvest AreaKnowing the exact area harvested is crucial to accurately determining yield. A common approach to determining field size is to use the global positioning system (GPS).A vehicle equipped with a differentially corrected GPS receiver coupled with a computer running mapping softwareis driven around the border of the area to be measured.Geographic information system (GIS) software is thenused to calculate the area within the border outlined bythe vehicle. Another GIS-based method is to import aerialphotographs into GIS software and outline the area usingpolygon drawing tools. Of the two, field measurements areexpected to be more accurate, since driving the field bordercan reveal areas that cannot be farmed and that may nothave been detectable from an aerial photograph, particularly if the photograph is not recent.Measuring Wet WeightTo determine DM yield, wet weight of plant materialmust first be measured.Equipment for ForageOften, forage is not weighed. Many times, forage producers are not concerned with the weight of the harvestedmaterial but instead pay attention to the number of bales orthe approximate volume of hay or silage. This is typicallythe case when forage is produced and used within the samefarming operation. However, when forage is produced formarkets off the farm, its price is determined by weight.A recent investigation into the accuracy of estimating theweight of a bale showed that estimates were off an averageof 16% and tended to underestimate bale weights (Yohn etal., 2007). Therefore, to improve estimates of nutrient removal, accurate determinations of weight are needed.The most accurate equipment for measuring foragewet weight is a scale, which should be properly calibrated.If a scale is not available on the farm, neighbors or grain elevators are possibilities. For measuring large bales or manysmall bales, a platform truck scale is a good option. If indi-Scales.Measuring Nutrient Removal, Calculating Nutrient Budgets161
vidual small bales are weighed, less expensive scales can beused, such as large animal scales.When no scale exists, weightcan be approximated from volume (Wiersma and Holmes,2000). The internal length and width of a wagon are measured and height marks made at half-foot intervals. Whenthe wagon is filled, the height of forage is recorded, and forage volume calculated. Volume is converted to DM weightusing a table of average DM density (pounds DM per cubicfoot of forage). Average density values for the first cutting ofalfalfa, second and subsequent cuttings of alfalfa, red clover,grass, oat, and corn are 5.7, 5.0, 5.5, 4.6, 5.0, and 5.0 lb DMft 3, respectively (Wiersma and Holmes, 2000). Considerableuncertainty exists with this method, and it should be notedthat DM is estimated weight, rather than wet weight.Forage Wagons with No Scale.This method was developed byYohn et al. (2007). The approach calibrates hydraulic pressure to weight. First, gauges are installed in hydraulic linesto measure pressure. For instance, gauges can be placed inlines leading to the two cylinders of a front end loader. Tocalibrate, objects of a known weight, such as seed bags ortractor weights, are progressively added. Each time moreweight is added, the pressure is recorded. This allows pressure to be related to weight. During calibration, the weightused should cover the range expected for the plant materialto be weighed. As an example, for round bales, up to 1500pounds may be needed in the calibration. Once calibrated,hydraulic pressure associated with lifting each bale to a specific height can be converted to weight.Tractor Hydraulics as Scales.Equipment for GrainGrain yields can be measured with a platform truckscale, grain cart scale, or yield monitor.Collecting Samples for Moisture DeterminationCollecting representative samples is a critical step foraccurately assessing plant moisture content. Samples formoisture analysis should be collected when the sampleis weighed.Forage SamplesIdeally, a separate sample should be taken from eachweighed load, separated by lot. A lot is forage harvestedwithin one day from one field and from a specific variety or162Soil Science: Step-by-Step Field Analysis
hybrid. To collect a forage sample, a core sampler is recommended (Brusewitz et al., 1993; Undersander et al., 2005).Each sample should consist of 10 to 12 cores that are composited into a single sample from which a smaller portion istaken for moisture determination.Grain SamplesTwo primary approaches are used to collect grain samples (GIPSA, 2006, 2001). The first one is taking a samplefrom a moving stream of grain. The second approach is collecting samples from grain at rest, such as a truck, combinehopper, or bin. Taking a sample from flowing grain can bedone with a large coffee can held to one side of the stream.A minimum of three such samples per load is suggested.For grain at rest, a hand probe is recommended, taken atspecific locations and angles, depending on the length ofthe probe and the type of container being sampled. At leasttwo probes should be used for a hopper trailer.Measuring Moisture ContentVarious methods exist for determining the moisturecontent of plant material. Different equipment and techniques exist for forage and grain.Forage MoistureFor forages, moisture can be determined either by measuring the weight difference of a sample after drying or byusing an electronic moisture meter.In commercial laboratories, forage moisture is calculated directly by weighing the wet weight of the sample, drying the sample in a forced-air oven at 176 F until a stableweight is obtained (Mills and Jones, 1996), and calculatingmoisture content as follows:Moisture (%) wet weight (g) - dry weight (g) 100%wet weight (g)[1]On the farm, other options exist for drying samples.A microwave oven procedure was developed by Farmerand Brusewitz (1980) and has been made available onlineby Chamliss (2002). In this procedure, a 100-g sample (wetweight), cut into 1-inch pieces, is placed in a microwaveoven, along with a 10- to 16-oz. glass of water. The microwave oven is then run on high setting for 5 minutes, theMeasuring Nutrient Removal, Calculating Nutrient Budgets163
sample removed, and weighed again. The glass is thenemptied and refilled with fresh water and placed back inthe microwave. The sample is returned to the oven and themicrowave run on high for 2 minutes. Changing water andrunning the microwave for 2 minutes is done repeatedlyuntil the sample weight stabilizes.Moisture can also be determined on-farm with a Kosterforage moisture tester (Koster Crop Tester, Inc., Brunswick,OH). This tester is a self-contained electrical forced-airdryer. The sample is placed in the specimen container thatcomes with the dryer. The sample is then dried for 30 minutes and weighed again. Subsequently, the sample is driedin 10-minute increments until the weight stabilizes.The electronic moisture meter is an indirect measurement of moisture. The instrument actually measures eitherelectrical conductance or resistance and converts that information to moisture as a percent of wet weight.Studies have been conducted to determine the accuracyof various on-farm approaches to measuring the moistureof forages. The Prairie Agricultural Machinery Institutetested the Koster forage moisture tester on alfalfa and cornsilage and found it to have acceptable accuracy (3%) whencompared with a standard oven-dry method (Prairie Agric.Machinery Inst., 1981). Oetzel et al. (1993) tested the microwave oven, the Koster forage moisture tester, and anelectronic moisture meter on samples of alfalfa, corn silage,and high-moisture shelled corn. They found that all threeof the measurements had good reproducibility. For alfalfa,all three underestimated moisture when compared withthe standard oven-dry method but had an acceptable error rate of about 6.4%. For corn silage, the microwave ovenand Koster forage moisture tester underestimated moisturecontent, with the Koster tester doing so significantly andwith a nominally acceptable error rate of 9.4%. The electronic moisture tester gave inaccurate results, with a totalerror of 19.6%, and consistently overestimated corn silagemoisture. It was thought by the authors that such inaccuracy may have been attributable to the heterogeneous natureof the corn silage material. For high-moisture shelled corn,a much more homogeneous material, the electronic moisture meter was the most accurate, with an error of 1.25%.1164Trade names are included for the benefit of the reader and do not imply endorsement of orpreference for the product listed by the author or SSSA.Soil Science: Step-by-Step Field Analysis
Both the microwave oven and the Koster tester underdried the corn, with theKoster tester not drying as much as the microwave oven, resulting in greater error.The error of the microwave was acceptable (2.1%), while that of the Koster testerwas marginally so (9.7%). Brusewitz et al. (1993) reviewed the various methodsand concluded that the microwave oven was almost as accurate as the referenceoven and therefore recommended its use for drying samples. They determined thatmoisture meters for corn silage were inaccurate, in agreement with Oetzel et al. (1993),but could be accurate for hay if calibrated with results from a microwave oven.Grain MoistureFor grains, moisture meters are the most common approach for determiningmoisture content. These meters work in principle like those described for forages.The accuracy of the moisture meter should be checked periodically by comparing readings from the moisture meter with those from a meter used at a grain elevator (Hurburgh and Wilcke, 1995). If a moisture sensor is coupled to a yield monitor on the combine, calibration involves reading the average moisture of a load andcomparing it with the average moisture of several samples taken from that load,measured with a separate moisture meter.Calculating Dry Matter YieldHarvest area, wet weight, and moisture are all used to calculate DM yield.First, DM weight is calculated as:æmoisture (%) ö DM weight (lb) weight wet (lb) - ççç wet weight (lb) øè100%[2]Second, DM yield is determined by dividing DM weight by the harvest area:DM yield (lb acre-1) DM weight (lb)area harvested (acres)[3]Measurements for ForageForage Removed from the Field. Each load hauled from the field should be sampled andweighed. The DM yield is calculated by adding up the DM weights of all loads anddividing by the area harvested, according to Eq. [3]. If partial loads from two different fields are combined into a single load, estimate the portion of the load attributable to each field.Forage Stored in the Field. When bales are stored in the field, gather a few representative bales from each lot to create a load and divide the total DM weight of the loadby the number of bales to get the average DM weight per bale, as shown in Eq. [4].Multiply the average DM bale weight by the number of bales stored in the field.Avg. DM weight of a bale (lb bale-1) DM weight of a load (lb)number of bales in a load (bales)Measuring Nutrient Removal, Calculating Nutrient Budgets[4]165
Measurements for GrainIn cases where yield monitors are used, data are recorded by field andload within the field. This feature is available with or without a GPS receiver. Whenyield monitors have been properly calibrated, total wet weight of grain and moisture can be recorded for either individual loads or the field. Equation [2–3] can thenbe used to calculate DM yield.Yield Monitor.Truck Trailer. The number of truck trailer loads leaving a field can be used to estimatetotal wet weight by weighing each load on a platform scale. When a load containsgrain from more than one field, estimating the percent volume occupied by thegrain from each field allows the load weight to be partitioned to each field.Wet weight can also be measured with grain carts equippedwith scales. Weights and moisture percentages of individual loads are recorded andseparated by field.Grain Cart with a Scale.Measuring Nutrient ConcentrationNutrient analyses of plant material need to be conducted by a reputablelaboratory with good quality control procedures and participating in the NorthAmerican Proficiency Testing Program (http://www.naptprogram.org/). Such laboratories will have instructions for storing samples before submission. Many alsohave protocols for collecting samples. Generally, plant samples should be placedin polyethylene freezer bags and stored in a freezer until they can be submitted.The results provided by the laboratory will have different concentration unitsfor different elements. For the macronutrients, N, P, K, Ca, Mg, and S, concentrations are reported as a percentage of the DM weight of the sample. For the remaining micronutrients, parts per million units are used.Calculating Nutrient RemovalNutrient removal calculations for elements will differ based on the units usedto report their concentrations. Differences also exist for P and K because practitionersuse the oxide forms of these elements, P2O5 and K2O, rather than the elemental formreported by the laboratory. All calculations use the DM yield calculated in Eq. [3].Concentrations Reported in Units of PercentNitrogen, Calcium, Magnesium, SulfurCalculating nutrient removal for these elements is performed by dividing thepercent elemental nutrient concentration by 100 and multiplying the quotient bythe DM :Nutrient removal (lb acre-1) DM yield (lb acre-1) 166concentration (%)100%[5]Soil Science: Step-by-Step Field Analysis
PhosphorusThis calculation is the same as Eq. [5], except that a conversion factor (2.29) has been included that transforms elemental P content to P2O5 content.Nutrient removal (lb P2 O5 acre-1) DM yield (lb acre-1) P concentration (%) 2.29100%[6]PotassiumLike P, this equation contains a factor (1.20) that converts elemental K to K2O.Nutrient removal (lb K 2 O acre-1) DM yield (lb acre-1) K concentration (%) 1.20100%[7]Concentrations Reported in Units of Parts per MillionThis calculation works for all the micronutrients: B, Cl,Cu, Fe, Mn, Mo, Ni, and Zn.Nutrient removal (lb acre-1) DM yield (lb acre-1) concentration (ppm)1,000,000[8]It should be noted that while Ni has recently been recognized as an essential element, it is not routinely analyzed incommercial soil testing laboratories. As an additional note,nutrient removal rates of all micronutrients are small.Converting Published Removal Coefficientsto a Dry Matter BasisIn some cases, DM yield may be known or estimated,but nutrient concentrations are not measured. In such cases,the only alternative is to use published nutrient removalrates. Published estimates are in pounds of nutrient peryield unit of the crop considered.ForagePublished coefficients for forages are in units of poundsper ton. Many published coefficients do not specify themoisture content. Table 1 provides values that can be usedin such cases (Koelsch et al., 2004).Measuring Nutrient Removal, Calculating Nutrient Budgets167
Table 1. Dry matter content used to report nutrient removal per ton(Koelsch et al., 2004).CropDM content per ton%All hayAlfalfa silage, mid-bloomBarley strawCorn silageCorn stoverOat strawRye strawSmall grain silage, dough stageSorghum silageSorghum-sudan silageSorghum stoverWheat straw854090358590903530308090To convert published removal coefficients from a moistbasis to a DM basis, the following equation is used. Thepublished nutrient removal rate is divided by the DM content estimated in Table 1, and the quotient then multipliedby 100. The result will be a larger number because a ton ofDM will contain more nutrients than a ton of moist plantmaterial where some of the weight is water.Nutrient removal rate éê lb (ton DM)-1 ùú ëû[9]æ nutrient removal rate é lb (moist ton)-1 ù ö çëêûú 100% DM (ton DM)-1ççç DM content éê % (moist ton)-1 ùú ø ççèëûFor example, if a published removal coefficient is 3.1 lb P2O5(moist ton) 1 for corn silage at 65% moisture, this is equivalent to:P2 O5 removal rate êé lb (ton DM)-1 úù ëûé 3.1 lb P O (moist ton)-1 ù-12 5êúê 35 % DM (moist ton)-1 ú 100% DM (ton DM) ëêûú8.9 lb P2 O5 (ton DM)-1This value can then be multiplied by the DM yield to estimate nutrient removal.GrainPublished coefficients for grain are in units of poundsper bushel. When the only information available on farm is168Soil Science: Step-by-Step Field Analysis
pounds DM harvested, these coefficients must be convertedfrom volumetric to gravimetric measurements, corrected formoisture. This is accomplished by dividing the publishednutrient removal rate by the amount of DM in a bushel, estimated in Table 2 (Hirning et al., 1987):Nutrient removal rate éê lb (lb DM)-1 ùú ëûì nutrient removal rate é lb (moist bu)-1 ù ïüïïïëêûú ïïíýïïDM weight êé lb DM (moist bu)-1 úùïïëûïïîþ[10]Table 2. Commonly used test weights and moisture percentages ofvarious grains (Hirning et al., 1987).CropTest weightMoistureDry matterlb bu 1%lb bu heat100.0010.0090.0060.0013.5051.90For instance, a nutrient removal rate of 0.38 lb P2O5 bu 1corn grain at 15.5% moisture is equivalent to:P2 O5 removal rate éê lb (lb DM)-1 ùú ëûé 0.38 lb P O (moist bu)-1 ù-12 5êúê 47.32 lb DM (moist bu)-1 ú 0.0080 lb P2 O5 (lb DM)êëúûOnce this value has been calculated, it can be multiplied byDM yield to estimate nutrient removal.Comparing On-Farm Nutrient Removal Rateswith Published ValuesIt is always a good idea to compare the values generated on the farm to published estimates (Table 3). Often, it isdifficult to find published estimates for both macro- and micronutrients. Some sources that have such information areJacobsen et al. (2005), Mitchell (1999), and Zublena (1991).Such a comparison helps ensure that the numbers beingMeasuring Nutrient Removal, Calculating Nutrient Budgets169
generated on the farm are reasonable. If large discrepancies are found, a check may be needed of the calculations,equipment, or procedures.Table 3. Nutrient removal coefficients for various crops (Murrell, 2005).CropUnitNNutrient removalP2O5K2O————————— lb unit 1 —————————AlfalfaAlsike cloverBarley grainBarley strawBarley strawBeans, dryBirdsfoot trefoilBluegrassBromegrassBuckwheatCanolaCorn grainCorn stoverCorn stoverCorn silageCorn silageFescueFlax grainFlax strawMilletMintOat grainOat strawOat strawOat silageOrchardgrassPotato tuberPotato vineRed cloverReed canarygrassRye grainRye strawRye strawRyegrassSorghum grainSorghum stoverSorghum stoverSorghum-sudanSoybean grainSoybean stoverSoybean stoverSoybean ububulb 0.270.8342341.31.03725Soil Science: Step-by-Step Field Analysis
Sugarbeet rootSugarbeet topSunflower grainSunflower stoverSunflower stoverSwitchgrassTimothyTobacco (leaves)VetchWheat grainWheat strawWheat entrations Reported in Units of PercentNitrogen, Ca, Mg, S. The concentrations of these nutrients areconverted to removal rates per ton of DM using Eq. [11].Nutrient removal rate éê lb (ton DM)-1 ùúëûæ concentration (%) ö -1 ççç 2000 lb (ton DM)èø100%[11]Phosphorus. This calculation is the same as Eq. [11] except thatan additional factor (2.29) has been included to convert elemental P content to P2O5.Nutrient removal rate éê lb P2 O5 (ton DM)-1 ùú ëûæ P concentration (%) ö -1çç 2000 lb (ton DM) 2.29çèø100%[12]Potassium. This equation contains a factor (1.20) that convertselemental K to K2O.Nutrient removal rate éê lb K 2 O (ton DM)-1 ùú ëûæ K concentration (%) ö -1ç 2000 lb (ton DM) 1.20ççèø100%Measuring Nutrient Removal, Calculating Nutrient Budgets[13]171
Concentrations Reported in Units of Parts per MillionThis calculation works for all the micronutrients: B, Cl,Cu, Fe, Mn, Mo, Ni, and Zn.Nutrient removal rate éê lb (ton DM)-1 ùú ëûæ concentration (ppm) ö -1çç ø 2000 lb (ton DM)çè1,000,000[14]It is important to remember that the results of Eq. [11–14] arefor a ton of DM and may be higher than published estimatesthat assume some moisture is in the ton of harvested forage(less than 100% DM in a ton). To adjust the removal rates inEq. [11–14] for the assumed DM contents in Table 1, use thefollowing equation. The results from this equation can becompared with published estimates of nutrient removal.Nutrient removal rate éê lb (ton at a specified DM %)-1 ùú ëûDMcontent(%)nutrient removal rate êé lb (ton DM)-1 úù ëû100%[15]GrainPublished coefficients for grain are in units of poundsper bushel. Since bushel is a volumetric measure, theweight of DM in a bushel must be calculated from testweight and moisture measurements. Test weight is thepounds of grain per Winchester bushel (2150.42 in3).There are many instruments that measure test weight.Test weight is normally recorded to the nearest half-poundper bushel (0.5 lb bu 1). Some meters are capable of measuring test weight as well as moisture. Other instruments simply measure test weight and must be used in combinationwith a separate moisture meter.Grain elevators will also take grain samples and analyze them for moisture and test weight. To ensure the mostaccurate measurements, take the samples to the elevator soon after harvest. Both moisture and test weight canchange over time.In cases where test weight and moisture are not measured, commonly accepted values can be used (Table 2).The DM content of a bushel of grain is found using:172Soil Science: Step-by-Step Field Analysis
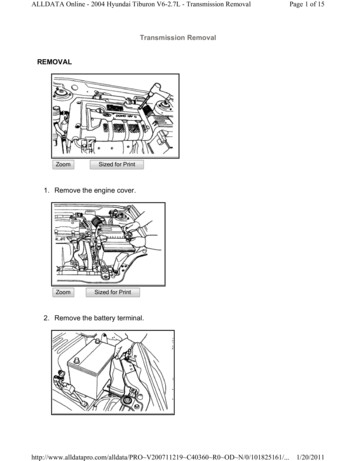
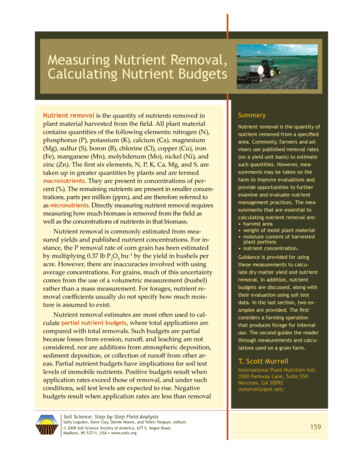
Bushel DM weight (lb DM bu-1) éæ grain moisture (%) öùtest weight (lb bu-1) - ê test weight (lb bu-1) ççç úêëèø úû100%[16]Concentrations Reported in Units of PercentNitrogen, Ca, Mg, S. The concentrations of these nutrients are converted to nutrient re-moval rates per bushel using Eq. [17].Nutrient removal rate (lb bu-1) æ concentration (%) ö -1ç bushel DM weight (lb DM bu )ççèø100%Phosphorus. Thisto P2O5.[17]equation includes the factor needed (2.29) to elemental P contentNutrient removal rate (lb P2 O5 bu-1) æ P concentration (%) ö -1çç bushelDMweight(lbDMbu)2.29 øçè100%Potassium.[18]This equation uses the factor 1.20 to convert elemental K to K2O.Nutrient removal rate (lb K 2 O bu-1) æ K concentration (%) ö -1 bushel DM weight (lb DM bu ) 1.20ççèçø100%[19]Concentrations Reported in Units of Parts per MillionThis calculation works for all the micronutrients: B, Cl, Cu, Fe, Mn, Mo, Ni, and Zn.Nutrient removal rate (lb bu-1) é conentration (ppm) ùêú bushel DM weight (lb DM bu-1)êëúû1,000,000[20]Calculating Partial Nutrient Budgets of Immobile NutrientsA partial nutrient budget compares nutrient additions to nutrient removalswithin a specified time period. Many nutrient recommendation systems use nutrient removal as the first approximation of the application rate needed to maintain soil test levels of immobile nutrients, like P and K, over time.The general formula for calculating a budget is given below. The minimum interval should include nutrient applications and the removal of those nutrients byall of the crops for which the applications were intended. Figure 1 illustrates thisconcept. For instance, in a corn–soybean rotation, producers often apply P and Konce every 2 years. Such an application would be denoted “nutrient applicationsfor Crops 1 and 2” or “nutrient applications for Crops 3 and 4” in Fig. 1. All applications are included, such as small rates of seed-placed fertilizer. To calculate theMeasuring Nutrient Removal, Calculating Nutrient Budgets173
Fig. 1. Time line demonstrating the minimum and combined intervals suggested for calculating nutrient budgets.nutrient budget, the P and K removed by the corn–soybean rotation is subtractedfrom the total P and K applied:Nutrient budget (lb acre-1) sum of all nutrient additions (lb
bu 1 by the yield in bushels per acre. However, there are inaccuracies involved with using average concentrations. For grains, much of this uncertainty comes from the use of a volumetric measurement (bushel) rather than a mass measurement. For forages, nutrient re-moval coefficients usually do not specify how much mois-ture is assumed to exist.