Transcription
Brain Drain in Ohio;Observations and Summaries with Particular Reference to Northwest OhioFebruary, 2006Patrick McGuireAssociate Professor Sociology,Director, The Urban Affairs CenterDonna Hardy JohnstonResearch Associate, The Urban Affairs CenterDan SaevigDirector, University of Toledo Alumni AssociationThe Urban Affairs Center is a partner in the Ohio Urban UniversityProgram. The Urban University Program is a unique network linking theresources of Ohio’s urban universities with the communities andstudents they serve. The UUP partners work in a cooperative effort toimprove Ohio’s urban regions1
Prepared for Dr. Daniel Johnson, University of Toledo, Ohio Urban University Program, the Western Ohio ResearchConsortium, and for Public DistributionBy The University of Toledo Urban Affairs CenterThe University of ToledoUrban Affairs Center2801 W. Bancroft St.Toledo, Ohio 43606419x530x3591E-Mail: uac@utoledo.eduThis publication is available for download at the Urban Affairs Center website:HTTP://uac.utoledo.edu2
Table of ContentsTable of Contents. 1Executive Summary . 2Introduction. 3Context & Background – US Mobility Since 1985 . 2National Mobility. 2Ohio’s Mobility. 2Studies of Brain Drain in the US, Ohio, Northwest Ohio, and Toledo. 3High School to College Transition . 4National Studies of the College-Employment Transition and Migration . 4Ohio’s Brain Drain. 6UT-UAC Analysis of Ohio grads . 9Where do Graduates of Ohio’s Universities Live and Work? . 10Migration of Young College Educated Individuals in Northwest Ohio and Toledo MSA . 152000-2003 NW Ohio. 15Is there degradation of in-state locational patterns of NW Ohio University alumni since 1980? . 16A “massive out-migration” of college graduates from Toledo MSA? . 20What about the Science/Technology “Brains” Graduating in NW Ohio?. 25Demand for scientific and technical, and advanced graduate alumni in the Toledo Region. 27Conclusions. 29Summary of Findings. 29Policy proposals . 30Appendix 1. 32Appendix # 2. 34
Executive SummaryAnalyzing the records of 1.1 million college alumni from 26 Ohio institutions since 1980, including all the major public universities,we identify several findings regarding “brain drain”—the exit of college graduates from Ohio and especially Northwest Ohio. Brain drain is not as common in this state and area as is generally believed. Only about 20% of 2000-2003 graduates left thestate—a relatively low percentage.Many who do leave relocate to adjacent states, not to “cool cities” or the sunbelt.Graduate retention seems to have increased since 2000, compared to previous periods, especially the late 1990s.Most graduates who stay in Ohio for more than 3 years after graduating, remain for two decades. Roughly 60% of thegraduates of the state-wide and of the northwest Ohio 1980 cohort are still located in Ohio, and roughly 70% of all 1980-2003graduates are located in Ohio.In-state retention rate of graduates from 8 northwest Ohio universities is similar to our state-wide sample both since 2000, andfor the entire 1980-2003 period.Science and technology graduates from northwest Ohio universities since 2000 exit the state in numbers that are slightly higherthan their peers.The Toledo MSA does have a major out-migration of alumni, but this is in part due to the fact that local universities produce somany graduates, many of whom never actually lived in the MSA. Thus, while strongly contributing to the Ohio economy, onlyabout 20% of northwest Ohio college grads stay in the region. However, given the small percentage of state-wide grads wholocate in NW Ohio, most alumni located appear to have been educated in the region.There is a significant “brain drain” indicated where alumni with advanced degrees (Masters, Doctorates, etc.) from both ourstate-wide and northwest Ohio samples disproportionately exit the state. This trend is especially pronounced in northwestOhio, despite the fact that these are relatively small number of people.Locational decisions do not appear to be effected by the gender of the graduate.On a state-wide level, our data suggests that brain drain is not a significant problem. Having an under-educated workforce andinsufficient demand by the business community for well-educated workers are problems. When taxpayers support Ohio highereducation, they are investing in the quality of the future workers and taxpayers of the State of Ohio—who will subsequently beinvesting in the social services and programs used by the current taxpayers and their children.Northwest Ohio is a significant producer of college-educated individuals to the state. Our ability to retain the many graduates of areauniversities, especially those who have advanced degrees, is relatively weak. Local firms need to recognize that hiring collegegraduates is an investment in the intellectual capital and competitiveness of their firm. They need to create more elaboraterelationships with universities to secure graduates and to support university research activities that may benefit them.2
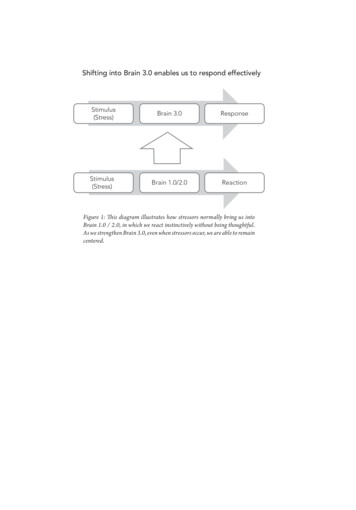
IntroductionFor decades there have been numerous reports on “brain drain” or migration of college educated youth from second and third worldnations to US universities,1 corporations, and citizenship. Well-educated immigrants have been recognized as a dynamic elementdriving the US economy. Articles in academic and mainstream media have increasingly focused on this topic. The internationalcontext shows us that “drain” can be bidirectional, uneven, varying over time, reversible, and influenced by government policy andbusiness environment.In the last decade, “brain drain” has been applied to explain the movement of college educated US youth to a few “cool cities.” Thisshift has catalyzed the concern of legislators, university officials, policy-makers, and economic development professionals. Twobeliefs unite this body of work: that having a sizable pool of talented college graduates is central to the economic vitality of a region,2and that graduates from throughout the nation are moving to relatively few urban centers mostly on the coasts. The implication of thistrend is that a vast area is left behind, unable to participate in the “new economy” because it lacks sufficient entrepreneurial andtechnical talent.The above noted concerns suggest the questions:1. What is the extent and form of Brain Drain in Ohio, Northwest Ohio, and Toledo?2. Has this pattern changed over time?3. And, does this pattern apply to Northwest Ohio?To answer these questions we employed a two part approach. First, we reviewed historical and secondary data from studies thatexamined and posited explanations for brain drain from multiple points of view, methods, and levels of analysis. Second, we gatheredand analyzed primary data on Ohio university alumni to shed light both on recent graduates, and the historical migration of Ohiouniversity graduates.1The British Royal Society first coined the expression “brain drain” to describe the outflow of scientists and technologists to the United States and Canada in the1950s and early 1960s. OECD Observer. 5/7/02.2The Southern Technology Council (1998) quoted a study by Bank Boston measuring the relationship between university science grads and entrepreneurship.They noted that Massachusetts Institute of Technology graduates had founded 4,000 firms, employed over 1.1 million people, and generated 232 Billion ofworld sales by 1994—taken together constituting the 24th largest economy in the world.3
Context & Background – US Mobility Since 1985National MobilityAmericans have always been a highly mobile people. Our net national immigration has always exceeded out-migration, and there hasbeen a continuous shifting of the US population from the northeast to the southern and western geographic areas of the US since thefirst US Census. In the last 30 years the pace of these trends has increased significantly.Currently about 17% of the US population annually changes residence.3 Racial minorities and the young move more often, especiallywithin their county of residence.4 Looking at the 1995-2000 data when 120,347,674 people over age 5 moved, we see that over half(54.4%) of all movers stayed in the same county, 21% moved to another county in the same state, 18.4% moved to another state, and6% of movers came from abroad.Almost two-thirds of all people age 25-39 moved during the 1995-2000 period, half of them outside their county, and almost 20% ofthose movers exited their original state of residence. In fact, 33.8% of all movers were 25 to 39 year olds. Thus, recent collegegraduate-aged persons, regardless of education are the most mobile age cohort. The most active sub-category is young, single,college-educated (YSC) people5—three-fourths of whom moved; 18% changed counties within the state, and 22.6% moved out ofstate (vs. 12.4% of non-YSC 25 to 39 year olds).6 YSC’s disproportionately moved to the Sunbelt, far western states, and to largerurban areas.7 Marital status was not a significant factor effecting mobility rates among YSC, since over 75% of young, collegeeducated individuals moved regardless of marital status.Ohio’s MobilityDue to out-migration, Ohio lost 163,876 people between 1986 and1997—most before 1990. There are estimates that Ohio will be oneof only two states with a projected flat population from 2000 through 2030. This is arguably due to the decline of establishedindustries, especially manufacturing-based firms. But given that these jobs are disproportionately held by non-college graduates, thesefigures do not in and of themselves indicate a brain drain problem.3http://www.vipvanlines.com/tax saving.htmIn the 1990’s only 14.5% of non-Hispanic whites moved, compared to 18.9% of African Americans, 18.9% of Asians, and 21% of Hispanics.5Among people age 25 and old (as of 1997), 36.1 million (83%) whites, 3 million blacks, 2.7 million Asians, and 1.7 million Hispanics had bachelor’s degrees.Educational Attainment in the United States, Special Report, US Census 1999. The rate also differs by race; 29.4% of whites, 17.2% of blacks and 11.1% ofHispanics had at least a bachelor’s degree in 2002. http://www.infoplease.com/ipa/A0774057.html6US Census 2000, Migration of the Young, Single, and College Educated: 1995-2000. Special Report, U.S. Dept. of Commerce, 11/ 2003.7All 20 largest metropolitan areas had a net increase in young, single, and college educated people during this period suggesting that such folks were heading toor remaining in all the large urban areas generally, and not just “cool cities.”42
Ohio has significant movement within its borders. Non-urban counties in the North Central, Western Border, and South East areas ofOhio are losing populations due to out-migration to metropolitan areas. In fact, all regions except the metropolitan counties had a netout-migration during the 1990’s. Counties gaining population are contiguous to major urban areas.8 Ohioans are moving to a fewsuburban and exurban areas from traditional urban core and rural locales, away from areas of limited economic opportunity and socialresources to places with more urban amenities such as educational institutions, access to parks, cultural diversity, and higheremployment. Individuals age 25-39 were most active in changing locations within the state and within regions.In sum, movement from previously established locations to metropolitan areas, especially by 25-39 year olds, is a general trend,suggesting that brain drain movement is a particular variant of the larger social mobility patterns affecting Ohio and the entire US.Studies of Brain Drain in the US, Ohio, Northwest Ohio, and ToledoTo understand the dimensions of this issue, we will review and discuss the findings of several studies. This will help us frame specificqueries for our analysis, create a basis for comparison with our findings, and show the impacts of different methods, populations, datasources, and definitional criteria upon our understandings. We will also present our findings and compare them to those found inother previous studies.The press’ and government’s concern about brain drain are focused on economic development issues associated with loss of highskilled “knowledge workers”--workers whose training they perceive as a lure to outside investment, and whose innovation might helpto spur local development. Among these analysts, there are two methodologies to studying “Brain Drain;“ 1) losses of collegeeducated people generally, and 2) studies looking at in-out migration of only science and engineering college graduates whose work isassociated with “high tech” or the “new economy.”Most studies are outcomes-based deductive statistical analyses derived from the US Census and other government data. Such studiesoffer greater detail about the size, components, and dynamics of migration. There also are surveys of college attendees and alumniexploring why college graduates decide to leave an area,9 but these have been small, of limited focus, and had weak response rates.10Most have focused on recent college graduates leaving the locations where they received their degree.8Major ( 4,000) population increases occurred in 5 counties around Cincinnati, 5 around Columbus, 1 between Cleveland and Akron. Only 4 counties in NWOhio had any increased population (Williams, Fulton, Wood, and Ottawa)—all are around Toledo. Ohio Trends, www.osuedc.org/current/ohtrends/vIn3.htmlThere also was a slight increase in counties south of Columbus beyond the suburban areas.9The State of Indiana and Georgia have instituted a series of annual surveys of employers, alumni, students, industries, human resource professionals, etc., whileNew Hampshire, North Carolina, and Pennsylvania did one time surveys pre 1999. Another was done for a small area of Northeast Ohio in 2002-- StarkEducation Partnership. 2003. “Graduate Retention. Akron. Others are in the information gathering stage, were not publicly released, and/or were not yetavailable as public reports perhaps due to changing state priorities or budget constraints—a problem previously noted in Indiana Human Capital. 2000.3
High School to College TransitionAnalysts have identified 3 life-cycle-based events as periods when “brain drain” from a state or region occurs: the transition to college(in-region or –state, or out); transition from college to post-college activities (first employment or graduate school), and about 1-2years after college graduation. Most studies have focused on the post-collegiate and initial work experience period and this study willtake a similar focus.National Studies of the College-Employment Transition and MigrationDuring the 1970’s and 1980’s southern or sun-belt states offered low taxes and significant tax abatements and subsidies to lure firmsand create local employment, only to have firms recruit workers from northern states, and/or move back to northern states to gainaccess to an educated workforce. Corporate criticisms about the poorly educated local students forced southern states tosystematically examine workforce preparation. Many states made substantial investments in higher education and especially universitytraining. By the late 1990’s, states wanted to know the affects of these investments on economic development.In 1998 the Southern Technology Council (STC) executed a groundbreaking study which showed that, while most college graduatesstayed in their state and region, there was a substantial brain drain to urbanized coastal areas, especially in the far west. Examiningdata on 20,000 students from the NSF’s National Survey of Recent College graduates, they determined that while most collegegraduates stayed in a state and region,11 scientists and engineers were especially migratory, lured by higher wages, 12 and by defensespending. They disproportionately moved to a few cities in the south- and far-west13 seeking a challenging, high tech workenvironment. These “brains” drained to a few “cool” cities. A 2003 Brookings14 study of the 100 largest cities notes that the 25 UScities entering the 1990’s with the largest share of college graduates had by 2000 acquired graduates at twice the rate of the other 75cities and had become distinct from the rest of the nation in their ability to attract and retain an educated workforce.Cities where 25 to 39 year old graduates migrated were rarely among the most rapidly growing US cities.15 These receiving localesoften suffered a loss of non-college educated residents and even reductions in total population. Attracting “brains” did not benefitmost existing business, nor create jobs. Attracting “brains” is not the same as having aggregated intellectual capital, either in terms of10A study using both approaches would seem to offer the greatest opportunity to identify and measure what is happening and why. Unfortunately only one studyseems to have used this approach. “Maine’s College Graduates; Where They go and Why” Center for Education Policy, Applied Research and Evaluation.University of South Maine, Portland, Me. & Finance Authority of Maine February 2003.11This was especially common among people who had both graduated high school and college in the same state.12The study drew on information from the arguably anomalous 1991-3 period—the initial period of high (info- and bio-) tech expansion in the US.13While strong, this study focuses on a period with the most dynamic economic activity of the last 30 years, especially in the high tech, information tech, andbio-tech industries.14Brookings Institution in Washington Post 11/10/0315Only 1 of the 25 growing “brain” attracting locales, were among the 10 fastest growing US cities.4
numbers of graduates or of people with advanced degrees in a region. While a healthy number 25-39 year old graduates are migratingto Southern and Western cities, the highest proportions of baccalaureate-possessing young workers are located in the Northeast(27.5%), followed by the Midwest (26.2%), and then the South and West (22.9% each). 16 However, when looking at workers holdingadvanced degrees, the Midwest actually ranks last among the four areas.17 Thus, examining migration alone may distort ourunderstanding of the net intellectual capacity of a region’s workforce.Being a “cool city,” or having a large population of bright talented college students, and vibrant high tech and knowledge-basedindustries, doesn’t prevent brain drain nor assure graduate attraction and retention. A Boston study18 shows substantial out-migrationdue to colleges creating more graduates than the economy can absorb. Almost half of recent graduates leave each year,19 and theprincipal reason for exit was the lack of jobs and low salaries in their field of expertise—not lack of employment per se. Those withskills sought by local, high tech industry remained in the area. One quarter of graduates who stayed after graduation left within twoyears, and subsequent exit of graduates from the same cohort over the next decade was minimal.16Paul Gottlieb. 2004. Labor Supply Pressures and the “Brain Drain. Washington: Brookings Institution.US Census 2003. Educational Attainment: 2000. Graduate degree attainment NE-11% highest, Midwest -8% lowest. Pg. 6.18Boston Chamber of Commerce and the Boston Foundation. 2003. Preventing a Brain Drain.1940% of them to their hometowns, 46% to other cool cities.175
Ohio’s Brain DrainWhile 24.4% of working age Americans had at least a bachelor’s level education in 2000, only 21.1% of Ohio’s, and 21.6% of theToledo MSA’s workforce had such degrees. The total number of graduates has grown slowly, despite annual increases in immigrationof college graduates and the number of new college graduates. Ohio had 32,053 in-migrants and 50,462 out-migrants among collegeeducated single people between 25 and 39 years of age during 2000.20 The 2003 US Census American Community Survey ranks Ohio40th among the 50 states in percentage of citizens over age 25 who have completed a bachelor’s degree, with only 2 of the 8 OhioMSAs having rates greater than the US Average. In fact, all Ohio MSAs ranked poorly compared to other US urban counties.21 Akey factor explaining this condition may be Ohio’s average tuition which in 2004 was 6,690, 5th highest among 50 states and 144%of the national average. Only 9 states have a lower appropriation for higher education per 1,000 of personal income. Relative to thestate average income, tuition at Ohio’s public 4 year colleges is the second highest in the nation. 22There have been several studies of brain drain examining the state-wide pattern, each with different population/samples, and usingdifferent methods and goals. A 2003 study by the Cleveland Plain Dealer looked at 490,000 alumni of 23 public and private schoolsin Ohio and found that over 70% of baccalaureate graduates who earned degrees in Ohio, stayed to work or returned for furthercollege in Ohio. People with master degrees are 30% more likely to leave Ohio than BA grads, and those with earned doctoraldegrees were twice as likely to leave the state as BA grads.23 They also found that graduates of more selective private colleges weretwice as likely to leave Ohio as public university graduates. Thus, more highly educated people, and those who attended privateuniversities,24 are more likely to leave the state.2520US Census. 2003 Migration of Young, Single, and College Educated; 1995-2000. This was a net migration rate of -88.25, similar to other rust-belt states suchas New York, Pennsylvania, Michigan, and West TTable? bm y&-geo id D&- box head nbr R02&-ds name ACS 2003 EST G00 &- lang en22All data from http://measuringup.highereducation.org/state reports.cfm23SSTI Weekly 3/28/03. Such rates help explain why the Midwest has the fewest number of people with advanced degrees of the four major US areas.24A similar finding was indicated by the Stark Kent State study (2003) using a regional survey of public and private college alumni.25This is important, since the State student aid formula may provide a student with more money to attend a private than a public university, helping to reduce thetuition difference between the two types of institutions. On the other hand, the net award to a student including state subsidy to the public university results in anet greater public investment per student when they attend the public colleges.6
Using Census data from 1995 and 2000, Mortenson (2004 in Sheehan 2004:2)26 showed that Ohio had the lowest percentage (22%) ofYSC’s of all US states who lived in the state in 1995 and left by 2000. This suggests that either the Plain Dealer data is flawed, or thatmany of those people who left, were only here as students and never actually lived in Ohio.Examining all of Ohio’s public and private university graduates from 1998 to 2001 during the first 6 months after graduation, the OhioBoard of Regents (OBOR) found roughly similar results; 76% of baccalaureate,27 64% of Masters, and 55% of Doctorate graduates ofpublic universities had in-state employment or continued schooling in Ohio.28 Inconsistent with the Plain Dealer, they found thatpublic college baccalaureate graduates were slightly less likely than private school grads to obtain in-state employment or continueschooling in-state (75% vs. 77%).29 More importantly, OBOR found that engineering and natural science graduates at all levels, weremuch less likely to stay in-state than graduates in general (see Table 1 below)—findings are consistent with the STC study.Table 1 Ohio's public university science and technology graduates 6 months aftergraduation, 1998 - sDoctorateDiscipline AreaEngineeringEngineeringEngineeringNatural ScienceNatural ScienceNatural Sciencenumber6,2151,4152556,6971,272383% instate employment&/or continued schooling68%44%28%75%56%28%Paul Gottlieb conducted a tightly focused study of scientific and technical graduates in the Cleveland area using NSF data on firstemployment experiences in the 35 occupations in information technology and biomedical industries.30 It indicates that out-migrationof Ohio’s scientific and engineering graduates occurs at twice the rate of immigration, and that the percentage of scientific andengineering graduates employed in Ohio but trained outside the state (immigrants) is low—ranked 39th among the US states. Ohio26Robert Sheehan. 2004 “Commentary on “Buying Ohioans Loyalty?” Conference on Financial Aid and Brain Drain, Case Western University 4/24/04. Re. T.Mortenson. “Mobility and Interstate Migration for the Young, Single, and College Educated 1995-2000.” Postsecondary Education OPPORTUNITY. # 125. July2004.27And 75.4% of students completing degrees at the Main Campus universities—historically more selective woo3-i.html29OBOR 2002 General Report, chapter 15, pgs. 6-11.30Paul Gottlieb. 2001. The Brain Drain Problem in Ohio and Northeastern Ohio. This study was funded by OBOR, Greater Cleveland Growth Association, andCase Western University Center for Regional Economic Issues,7
ranks 22nd in terms of retaining their own scientists and engineers. Thus, despite being a largely urban, industrial state with a largepopulation, and home to many Fortune 500 firms—factors that should advantage the state--Ohio has serious problems retaining andattracting such people.Next, Gottlieb moved beyond measuring migration, and examined demand and supply conditions such as wages, availability, collegedegree production, entrepreneurial activity. He found them to be insufficient in Ohio relative to the net population. After controllingfor population, supply, and demand, he found that not only are insufficient numbers of trained scientific and technical graduatesaccepting jobs in Ohio firms, especially high tech firms, but also there are insufficient numbers of high tech firms and jobs inOhio.31 He also calculated that attempts to attract science and technology graduates in Ohio and elsewhere through the use ofamenities, marketing and other policies attempting to influence or redress migration of scientific and engineering graduates explain nomore than 17% of variance—these people are motivated by employment and wage level.Gottlieb compared Cleveland-Akron to 30 other MSAs including Columbus, and Cincinnati.32 The study shows Cleveland, like Ohiogenerally, is low on both demand for such workers by industry and supply of high tech workers.33 Finally, he noted that simple outmigration of brains is not a problem in itself, as evidenced by the Boston example noted earlier. High turnover may be a good thing,bringing new people and innovative ideas to firms and helpin
about 20% of northwest Ohio college grads stay in the region. However, given the small percentage of state-wide grads who locate in NW Ohio, most alumni located appear to have been educated in the region. There is a significant "brain drain" indicated where alumni with advanced degrees (Masters, Doctorates, etc.) from both our