Transcription
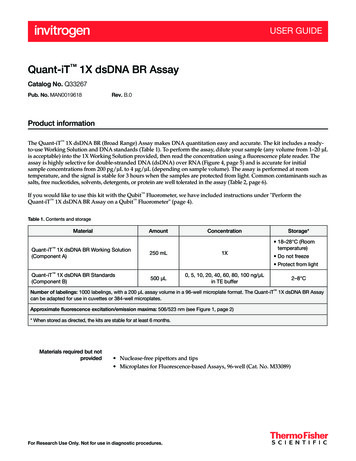
Thermal Shift Assay for screening inhibitorsVersion: 1.0Version Date: October 20201. Rationale/AimThermal shift assay (or Differential Scanning Fluorimetry, DSF) is a quick and uncomplicated assay forscreening inhibitors for proteins of interest without a need of prior knowledge of their substrates oractivities. The assay measures unfolding of the protein under investigation in a temperature range of 2595 C through an increase in fluorescence signal of the dye (SYPROTM Orange), which interacts withhydrophobic parts of the unfolded protein. Binding of inhibitors can enhance protein stability, resulting inan increase in their melting temperature (Tm). Usually higher Tm shifts (ΔTm), calculated from thedifference between Tm of native and inhibitor-bound form, correlate with greater stabilization effects ofthe tested inhibitors, which is in turn an indicative of their higher affinity. Several studies have shown thatthis assay can be used for detecting inhibitor binding for many protein classes, such as kinases andbromodomains, and the affinities of inhibitors have been shown to correlate well with ΔTm values.1Fig. 1: Thermal shift experiment principle (source Wikipedia)2. Experimental conditions2.1 Key Requirement:The assay is conducted in a 384-well format, which requires the following:- QuantStudio 5 Real-Time-PCR-System (Thermo Fisher)- Multi-channel pipette (recommended 16 channels or substituted 8 channels).
- Plate centrifuge.- Echo acoustic dispenser.2.2 Key Resources Table:Reagents (items)SYPRO OrangeProtein of interest ( 80% purity).384-well armadillo plateqPCR-compatible adhesive plate seal *Compound librarySuppliersInvitrogenIn-houseThermo FisherStarlabIn-houseCat. No.S6650AB3384E2796-9795* adhesive seal (other suppliers possible)3. ProtocolNote 1: Standard Tm buffer: 25 mM Tris-HCl, pH 8.0, 500 mM NaCl** Modifications are possible (pH, NaCl concentration, other ions, reducing agents, etc.). Hydrophobicsubstances should be avoided or at least kept to minimum.Note 2: Inhibitors should be prepared at 10 mM concentration (giving 5-fold molar excess) in a sourceplate compatible for Echo acoustic dispenser, which contains also some control wells (DMSO).3.1 General WorkflowPrepare protein solution in Tm Buffer (2 µM)Mix it with Sypro Orange (5000x) at 1000-fold dilutionAliquoting 10 µL of the protein-dye mixture into each well using multi-channel pipetteAdding 10 nL of inhibitor into each well from 10 mM solution
using Echo acoustic liquid dispenser or pipette (final conc. Is 10 µM)Seal the plate and spin down shortlyPlace the plate in the qPCR machine and use standard program for continuous heating from 25-95 Cwhile measuring fluorescence signals (filter465 nm and 590 nm)Analyze data with ’Protein Thermal Shift (Software Version 1.4, Thermo Fisher)3.2 Step by Step Protocol:This following protocol is based on screening a commercial Library (e.g. L1200) for CAMK1D in a 384-wellformat using QuantStudio5 (Thermo Fisher) and internal Analyzing ’Protein Thermal Shift softwareVersion 1.4’3.2.1 Setting up measurement--Prepare 4 ml of protein solution at 2 µM concentration in Tm buffer (e.g. dilute 400 µL of 20 µMCAMK1D in 4 mL of the buffer).Add 4 µL of SYPROTM orange (1:1000 dilution)Aliquot 10 µL into each well of a 384-well armadillo plate using 16-channel pipette.Transfer 10 nl inhibitors (final concentration 10 µM) from the 10 mM source plate to the 384well armadillo plate pre-filled with the protein-dye mixture.Seal plate with the qPCR-compatible adhesive plate seal.Spin the plate briefly using a table-top plate centrifuge (1000 rpm, 30s)Place the plate in the real-time qPCR QauntStudio5, and run the standard DSF program with aramp-up of temperature from 25-95 C at the rate of 0.05 degree per second. Fluorescencesignals are recorded for every 0.05 degree increment step.For each plate, measurement time is 35-40 min3.2.2 Analysis of ΔTm-Open the results in the ’Protein Thermal Shift software Version 1.4’ provided together withQuantStudio5.
-Load in the inhibitor plate layout-Assign sample and control wells (DMSO) by right clicking on well. Usually this is already assignedby the template you are loading.S Sample (Compound)R Reference (DMSO control)-Press ‘analyze’ button. Automated data analyses will perform fitting of the melting curves withBoltzmann equation, from which the Tm and Tm shift values will be calculated and displayedunder ‘analysis’ tab.
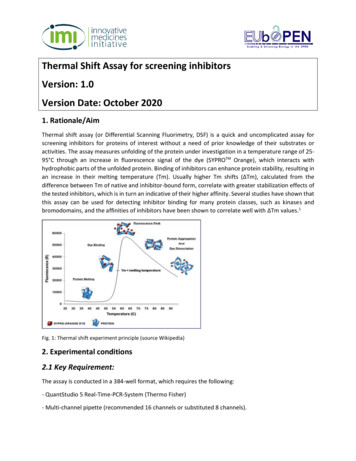
Tips: It is recommended to inspect the data and analyses manually for abnormality in curves offluorescence measurement, e.g. high initial intensity or multiple transition or low signals.Typically, these are flagged by the analysis software automatically. You can try to fit the datamanually if you are not happy with the fit. To do that use the manual integrate tool in the maintool list. If the curve it so bad that it can’t be analyzed at all, it is best to exclude this curve/Tmresult. Therefore press on ‘omit‘.Manual fitting toolsDMSO controlcurveCurve of ActivecompoundBoltzmann Fit-omitStandard fitFlag indicatorThe analyzed results can be exported in an appropriate format, such as a spreadsheet or text, bypressing ‘export’ button and select the information you want to export (i.e. Tm value, Tm Shift,inhibitor name etc.). Usually the Tm calculated by the Boltzmann Fit is more precise than the‘standard fit‘.
Literature1.Fedorov, O.; Niesen, F. H.; Knapp, S., Kinase inhibitor selectivity profiling using differentialscanning fluorimetry. Methods Mol Biol 2012, 795, 109-18.
Analyze data with 'Protein Thermal Shift (Software Version 1.4, Thermo Fisher) 3.2 Step by Step Protocol: This following protocol is based on screening a commercial Library (e.g. L1200) for CAMK1D in a 384-well format using QuantStudio5 (Thermo Fisher) and internal Analyzing 'Protein Thermal Shift software Version 1.4'