Transcription
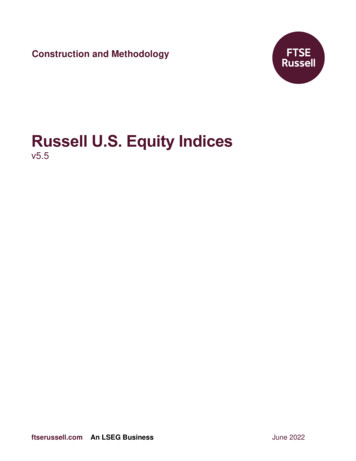
TransUnion Vehicle Pricing Index Q1 2021Executive SummaryThe TransUnion SA Vehicle Pricing Index (VPI) measuresyear-on-year price increases for new and used vehiclesfrom a basket of passenger vehicles of the 15 topmanufacturers by volume. The index is created fromvehicle sales data collated from across the industry.In Q1 2021, the VPI for new and used vehicle pricinghas risen to 8.8% and 3.7% (from 4% and 1.4% inQ1 2020, respectively).The macroeconomic outlook has been challenging;latest figures reveal -4% annualised GDP growth inQ1 2021 — an improvement on -6.2% in Q4 2020.Since 2020, consumer confidence remained below zero asbusiness confidence dropped from its highest level from2020. Household debt to income rose dramatically from2019 to 2020, adding significant pressure on consumers’disposable incomes. The exchange rate has beenfluctuating around R14.5, indicative of a stronger rand.While this makes import goods cheaper, unstable demandmakes it difficult for OEMs to accurately forecast supply.Total finance agreement volumes in the passengermarket increased marginally by 3% in Q1 2021 YoY.New passenger finance deals decreased by 5%,while used passenger vehicles rose by 7.4% YoY.1 2021 TransUnion LLC All Rights Reserved 21-1697878The used-to-new ratio remained consistent during 2020,rising to 2.4 in Q1 2021 (from 2.3). In the used vehiclemarket, 38% of sales are under two years old (in line with2019 trends). Financed demo models made up 6% of usedfinanced deals — indicating consumers are choosing oldervehicles as pressure on disposable income increases.According to the National Association of AutomobileManufacturers of South Africa (NAAMSA), there’s a YoYdecline of 6.8% in new passenger vehicle sales for Q1 2021(vs. Q1 2020).There’s more movement in new and used car financingin the following price brackets: below R200K, betweenR200K and R300K, and over R300K. During the pastquarter, financing shifted from under R200K into theR200K-R300K bracket — suggesting growth in consumerpurchasing power and their ability to purchase moreexpensive vehicles. We expect the demand shift from newto used vehicles to continue in the upcoming months asvehicle prices rise in real terms. The export market hasremained resilient throughout the pandemic, seeing a4% rise in total exports in Q1 2021 YoY.Positive interest rate indicators and low inflation havepushed demand for quality used vehicles — not newvehicles — straining supply and causing the used vehiclepricing index to surpass inflation for the first time sinceQ3 2010. This trend will continue as demand for qualityused vehicles continues without stable supply.
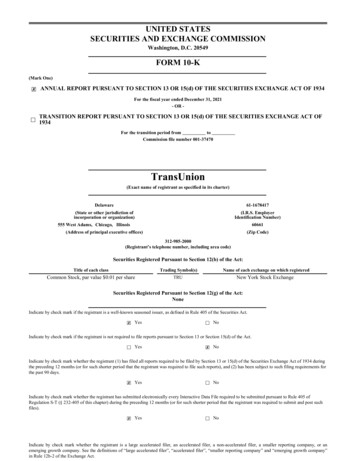
The South African automotive market will be adoptingright to repair laws to encourage competition andsustainability. After-market and value-added productswill be priced separately from new vehicles, ensuring moretransparency and providing more consumer options thatcreate opportunities for businesses.For the global automotive industry, it’s been anotherchallenging quarter in the wake of lockdown restrictionsand temporary closures. Because of limited supply,the competitive used vehicle market has grown in realterms, with more consumers expected to re-enter thenew vehicle market as right to repair becomes prevalent.Uncertain times lie ahead as rises in unemployment andmore lockdowns put even more pressure on disposableincome. As consumers deal with the impacts of negativeexchange and annualised GDP growth, debt-to-incomeratios and demand for used vehicles are increasing.While this is a tough time for dealers, there areopportunities as total cost of ownership declinesand future demand for after-market parts grows.1. Q1 2021 VPI 3.7%1.4%2.9%CPI3.1%4.6%3.3%New Price Index (Figure 1.1 and 1.2)New vehicle price increases are above inflation,and we expect this to increase further in theupcoming months.Used Price Index (Figure 1.1 and 1.2)Used vehicle price increases have increased inreal terms for the first time since Q3 2010.Figure 1.1Vehicle Pricing Index (VPI) and Consumer Price Index (CPI)15%10%5%0%-5%Q1 Q2 Q3 Q4 Q1 Q2 Q3 Q4 Q1 Q2 Q3 Q4 Q1 Q2 Q3 Q4 Q1 Q2 Q3 Q4 Q1 Q2 Q3 Q4 Q1 Q2 Q3 Q4 Q1 Q2 Q3 Q4 Q1 Q2 Q3 Q4 Q1 Q2 Q3 Q4 Q1 Q2 Q3 Q4 Q12010201120122013Index - New (Rate)20142015Index - Used (Rate)Figure 1.22 2021 TransUnion LLC All Rights Reserved 21-1697878201620172018CPI - Base Jan 2000 (Rate)201920202021
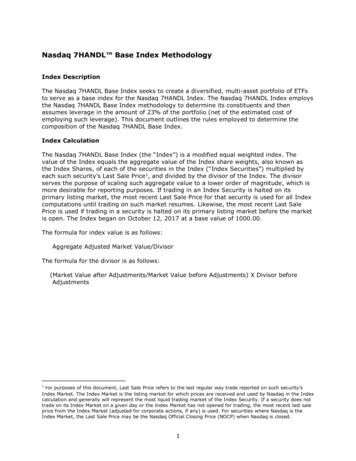
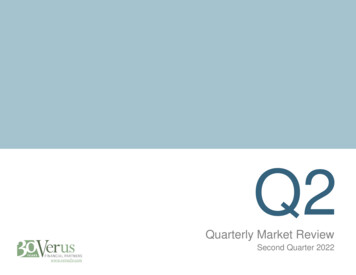
2. Q1 2021 Used-to-New o-New Ratio (Figure 1.3 to 1.5)The used-to-new ratio is based on finance dealsregistered in the past quarter. The ratio indicatesfinance houses are financing 2.41 used vehicles forevery 1 new vehicle, which is expected to increasein the upcoming quarters.NAAMSA NEW VEHICLES75,20680,716Q1 2021Ratio96,313Q1 2020Q4 2020Figure 1.4Figure 1.3Used-to-New Ratio3,503,002,502,001,501,00Q1 Q2 Q3 Q4 Q1 Q2 Q3 Q4 Q1 Q2 Q3 Q4 Q1 Q2 Q3 Q4 Q1 Q2 Q3 Q4 Q1 Q2 Q3 Q4 Q1 Q2 Q3 Q4 Q1 Q2 Q3 Q4 Q1 Q2 Q3 Q4 Q1 Q2 Q3 Q4 Q1 Q2 Q3 Q4 Q1 Q2 Q3 Q4 Q12009201020112012201320142015TotalFigure 1.53 2021 TransUnion LLC All Rights Reserved 21-1697878201620172018201920202021
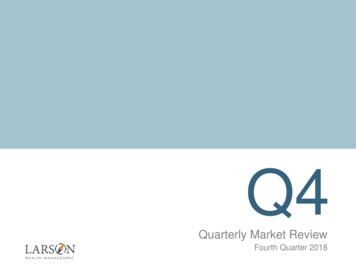
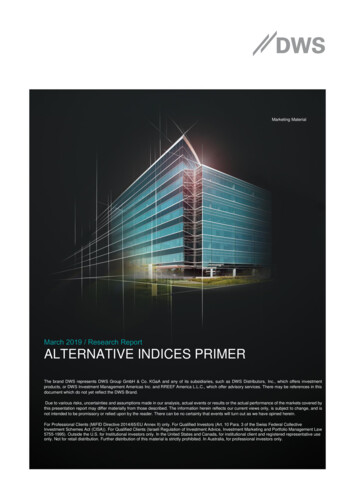
3. Q1 2020 Vehicle Asset Finance ResultsVehicle Asset Finance (Figure 1.6 and 1.7)40%In terms of consumers’ ability to buy more expensivevehicles, the over R300k band is at its highest sincewe started tracking in 2011. Despite lower volumes,we expect this positive trend to continue.Q12021 R200,00031%R200,000-R300,00029% R300,000Figure 1.6Vehicle Asset Finance Q1Q2Q32013Q4Q1Q2Q3Q42014 R200KQ1Q2Q32015Q4Q1Q2Q32016 R200-300KFigure 1.74 2021 TransUnion LLC All Rights Reserved 21-1697878Q4Q1Q2Q3Q4Q12017Q2Q32018 R300KQ4Q1Q2Q32019Q4Q1Q2Q32020Q4
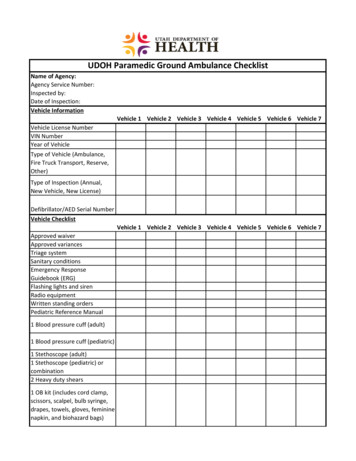
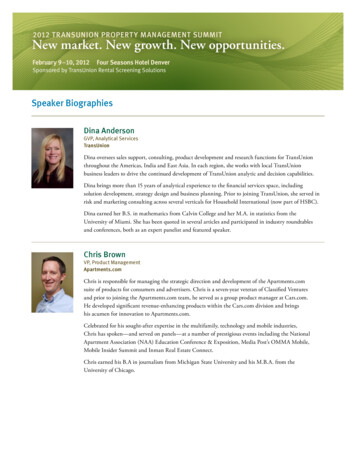
4. Q1 2021 Top Manufacturers by Sales Volume – PassengerManufacturers by Financed Sales Volumes (Figure 1.8 and 1.9)Toyota and VW performed well in both areas, sharing the top two spots in used car sales,while Hyundai and Suzuki enjoyed a strong quarter along with VW in new vehicle sales.Used Passenger Vehicle SalesNew Passenger Vehicle gure 1.8SUZUKIHYUNDAIRENAULTOTHERFigure 1.95. 2021 Q1 Top Manufacturers by Sales Volume - Light CommercialManufacturers by Financed Sales Volumes (Figure 1.10 and 1.11)Toyota had an exceptional quarter on the new LCV finance market capturing 39% of total sales volume.Ford and Toyota dominated the used market securing close to 60% of financed LCVs.Used Light Commercial Vehicle SalesNew Light Commercial Vehicle UZUVOLKSWAGENFigure 1.105 2021 TransUnion LLC All Rights Reserved 21-169787832%OTHERTOYOTAFORDNISSANISUZUFigure 1.11VOLKSWAGENOTHER
Contact usTransUnion SA Vehicle Pricing Index queries can be directed to:Michelle van Renen SA MkrtComms@transunion.com or 27 11 214 6000Want to know more?We can help you gain a more granular view of your operating environment with our Business Intelligence Reports.With access to extensive data and predictive insights you can identify, segment and effectively target prospectivecustomers amid tough economic pressures.For more information on our BI Reports contact: Kriben Reddy Kriben.Reddy@transunion.com or on 27 11 214 6000Sources: Figure 1.1 and 1.2 – Industry Sales Data, Figure 1.3 – NAAMSA, Figure 1.4 to 1.11 – New Financed Vehicle Sales DataTransUnion Auto Information Solutions (TransUnion) obtains information for its analyses from sources, which it considers reliable, but TransUnion does not guarantee theaccuracy or completeness of its analyses or any information contained therein. TransUnion makes no warranties, expressed or implied, as to the results obtained by anyperson or entity from use of its information and analyses, and makes no warranties or merchantability or fitness for a particular purpose. In no event shall TransUnion beliable for indirect or incidental, special or consequential damages, regardless of whether such damages were foreseen or unforeseen. TransUnion shall be indemnified andheld harmless from any actions, claims, proceedings, or liabilities with respect to its information and analysis.6 2021 TransUnion LLC All Rights Reserved 21-1697878
TransUnion SA Vehicle Pricing Index queries can be directed to: Michelle van Renen SA_MkrtComms@transunion.comor 27 11 214 6000 Contact us Sources: Figure 1.1 and 1.2 - Industry Sales Data, Figure 1.3 - NAAMSA, Figure 1.4 to 1.11 - New Financed Vehicle Sales Data TransUnion Auto Information Solutions (TransUnion) obtains information for its analyses from sources, which it considers .