Transcription
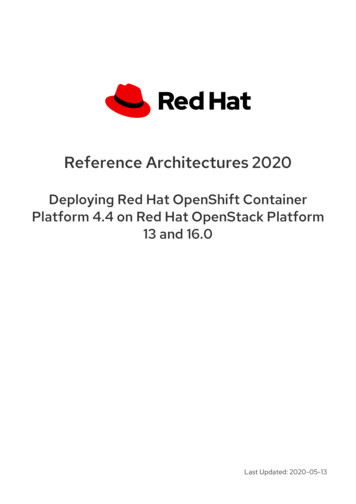
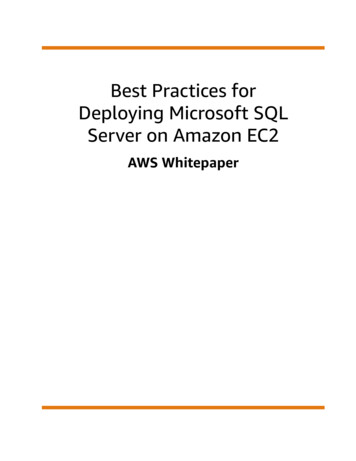
C ONTRIBUTED R ESEARCH A RTICLES5Creating and Deploying an Applicationwith (R)Excel and RThomas Baier, Erich Neuwirth and Michele De MeoAbstract We present some ways of using R inExcel and build an example application using thepackage rpart. Starting with simple interactiveuse of rpart in Excel, we eventually package thecode into an Excel-based application, hiding alldetails (including R itself) from the end user. Inthe end, our application implements a serviceoriented architecture (SOA) with a clean separation of presentation and computation layer.MotivationBuilding an application for end users is a very challenging goal. Building a statistics application normally involves three different roles: application developer, statistician, and user. Often, statisticiansare programmers too, but are only (or mostly) familiar with statistical programming (languages) anddefinitely are not experts in creating rich user interfaces/applications for (casual) users.For many—maybe even for most—applications ofstatistics, Microsoft Excel is used as the primary userinterface. Users are familiar with performing simplecomputations using the spreadsheet and can easilyformat the result of the analyses for printing or inclusion in reports or presentations. Unfortunately, Exceldoes not provide support for doing more complexcomputations and analyses and also has documentedweaknesses for certain numerical calculations.Statisticians know a solution for this problem, andthis solution is called R. R is a very powerful programming language for statistics with lots of methods from different statistical areas implemented invarious packages by thousands of contributors. Butunfortunately, R’s user interface is not what everydayusers of statistics in business expect.The following sections will show a very simpleapproach allowing a statistician to develop an easyto-use and maintainable end-user application. Ourexample will make use of R and the package rpartand the resulting application will completely hide thecomplexity and the R user interface from the user.rpart implements recursive partitioning and regression trees. These methods have become powerfultools for analyzing complex data structures and havebeen employed in the most varied fields: CRM, financial risk management, insurance, pharmaceuticalsand so on (for example, see: Altman (2002), Hastieet al. (2009), Zhang and Singer (1999)).The main reason for the wide distribution of treebased methods is their simplicity and intuitiveness.The R Journal Vol. 3/2, December 2011Prediction of a quantitative or categorical variable,is done through a tree structure, which even nonprofessionals can read and understand easily. Theapplication of a computationally complex algorithmthus results in an intuitive and easy to use tool. Prediction of a categorical variable is performed by aclassification tree, while the term regression tree is usedfor the estimation of a quantitative variable.Our application will be built for Microsoft Exceland will make use of R and rpart to implement thefunctionality. We have chosen Excel as the primarytool for performing the analysis because of variousadvantages: Excel has a familiar and easy-to-use user interface. Excel is already installed on most of the workstations in the industries we mentioned. In many cases, data collection has been performed using Excel, so using Excel for the analysis seems to be the logical choice. Excel provides many features to allow ahigh-quality presentation of the results. Preconfigured presentation options can easilyadapted even by the casual user. Output data (mostly graphical or tabular presentation of the results) can easily be used infurther processing— e.g., embedded in PowerPoint slides or Word documents using OLE (asubset of COM, as in Microsoft Corporation andDigital Equipment Corporation (1995)).We are using R for the following reasons: One cannot rely on Microsoft Excel’s numericaland statistical functions (they do not even givethe same results when run in different versionsof Excel). See McCullough and Wilson (2002)for more information. We are re-using an already existing, tested andproven package for doing the statistics. Statistical programmers often use R for performing statistical analysis and implementing functions.Our goal for creating an RExcel-based application is to enable any user to be able to perform thecomputations and use the results without any specialknowledge of R (or even of RExcel). See Figure 1 foran example of the application’s user interface. Theresults of running the application are shown in Figure2.ISSN 2073-4859
6C ONTRIBUTED R ESEARCH A RTICLESFigure 1: Basic user interface of the RExcel based end-user application.Figure 2: Computation results.There are a few alternatives to RExcel for connecting Excel with R:XLLoop provides an Excel Add-In which is able toaccess various programming languages fromwithin formulae. It supports languages like R,Javascript and others. The “backend” languagesare accessed using TCP/IP communication. Incontrast to this, RExcel uses COM, which has avery low latency (and hence is very fast). Additionally, the architecture of RExcel supportsa completely invisible R server process (whichis what we need for deploying the application),or can provide access to the R window whiledeveloping/testing.inference for R provides similar functionality asRExcel. From the website, the latest supportedR version is 2.9.1, while RExcel supports currentR versions immediately after release (typicallynew versions work right out of the box withoutan update in RExcel or statconnDCOM).Integrating R and Microsoft ExcelWork on integration of Excel and R is ongoing since1998. Since 2001, a stable environment is availablefor building Excel documents based upon statisticalmethods implemented in R. This environment consists of plain R (for Windows) and a toolbox calledstatconnDCOM with its full integration with Excelusing RExcel (which is implemented as an add-in forMicrosoft Excel).Like all Microsoft Office applications and somethird-party applications, Excel provides a powerfulThe R Journal Vol. 3/2, December 2011scripting engine combined with a highly productivevisual development environment. This environmentis called Visual Basic for Applications, or VBA forshort (see Microsoft Corporation (2001)). VBA allowscreation of “worksheet-functions” (also called userdefined functions or UDFs), which can be used ina similar way as Excel’s built-in functions (like, e.g.,“SUM” or “MEAN”) to dynamically compute values to beshown in spreadsheet cells, and Subs which allow arbitrary computations, putting results into spreadsheetranges. VBA code can be bundled as an “Add-In” forMicrosoft Excel which provides an extension both inthe user interface (e.g., new menus or dialogs) andin functionality (additional sheet-functions similar tothe built-in sheet functions).Extensions written in VBA can access third-partycomponents compatible with Microsoft’s ComponentObject Model (COM, see Microsoft Corporation andDigital Equipment Corporation (1995)). The link between R and Excel is built on top of two components:RExcel is an Add-In for Microsoft Excel implementing a spreadsheet-style interface to R and statconnDCOM. statconnDCOM exposes a COM componentto any Windows application which encapsulates R’sfunctionality in an easy-to-use way.statconnDCOM is built on an extensible designwith exchangeable front-end and back-end parts. Inthe context of this article, the back-end is R. A backend implementation for Scilab (INRIA (1989)) is alsoavailable. The front-end component is the COM interface implemented by statconnDCOM. This implementation is used to integrate R or Scilab into Windows applications. A first version of an Uno (OpenOffice.org (2009)) front-end has already been releasedfor testing and download. Using this front-end R andISSN 2073-4859
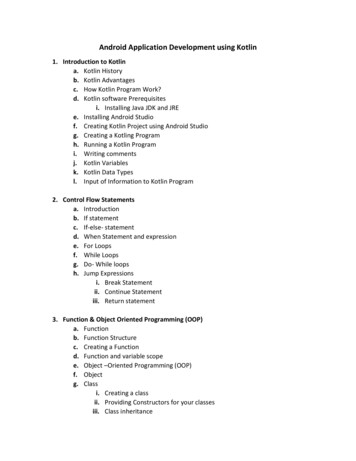
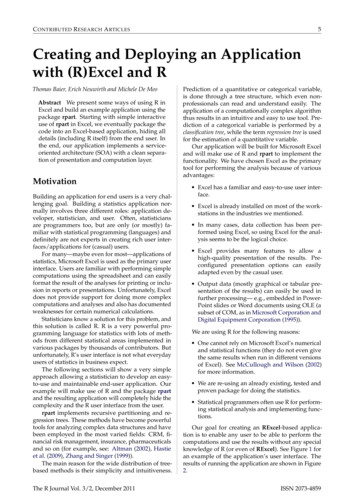
C ONTRIBUTED R ESEARCH A RTICLESScilab can easily be integrated into OpenOffice.orgapplications, like Calc (see OpenOffice.org (2006)).ROOo is available via Drexel (2009) and already supports Windows, Linux and MacOS X.RExcel supports various user interaction modes:Scratchpad and data transfer mode: Menus controldata transfer from R to Excel and back; commands can be executed immediately, either fromExcel cells or from R command lineMacro mode: Macros, invisible to the user, controldata transfer and R command executionSpreadsheet mode: Formulas in Excel cells controldata transfer and command execution, automatic recalculation is controlled by ExcelThroughout the rest of this article, we will describehow to use scratchpad mode and macro mode for prototyping and implementing the application.For more information on RExcel and statconnDCOM see Baier and Neuwirth (2007).Implementing theand regression treeclassificationWith RExcel’s tool set we can start developing our application in Excel immediately. RExcel has a “scratchpad” mode which allows you to write R code directlyinto a worksheet and to run it from there. Scratchpadmode is the user interaction mode we use when prototyping the application. We will then transform theprototypical code into a “real” application. In practice, the prototyping phase in scratchpad mode willbe omitted for simple applications. In an Excel hostedR application we also want to transfer data betweenExcel and R, and transfer commands may be embedded in R code. An extremely simplistic example ofcode in an R code scratchpad range in Excel mightlook like this:#!rputinvalresult -sin(inval)#!rgetresult'Sheet1'!A1'Sheet1'!A2R code is run simply by selecting the range containing code and choosing Run R Code from the popup menu.Lines starting with #! are treated as special RExcelcommands. rput will send the value (contents) of acell or range to R, rget will read a value from R andstore it into a cell or range.In the example, the value stored in cell A1 of sheetSheet1 will be stored in the R variable inval. Afterevaluating the R expression result -sin(inval), thevalue of the R variable result is stored in cell A2.Table 1 lists all special RExcel commands and provides a short description. More information can befound in the documentation of RExcel.The R Journal Vol. 3/2, December 20117In the example below, we have a dataset on thecredit approval process for 690 subjects. For eachrecord, we have 15 input variables (qualitative andquantitative) while variable 16 indicates the outcomeof the credit application: positive ( ) or negative ( ).Based on this training dataset, we develop our classification tree which is used to show the influence of 15variables on the loan application and to distinguish“good” applicants from “risky” applicants (so as toestimate variable 16). The risk manager will use thismodel fully integrated into Excel for further creditapproval process.The goal of the code snippet below is to estimatethe model and display the chart with the classificationtree. The risk manager can easily view the binary treeand use this chart to highlight the splits. This will helpdiscover the most significant variables for the creditapproval process. For example, in this case it is clearthat the predictor variables V9 determines the bestbinary partition in terms of minimizing the “impuritymeasure”. In addition, the risk manager will noticethat when V9 equals a, the only significant variableto observe is V4. The graphical representation of theclassification tree is shown in Figure 3 on page se'!A1:P691fit -rpart(V16 .,data trainingdata)plot(fit,branch 0.1,uniform T,margin .1,compress T,nspace 0.1)text(fit,fancy T,use.n \\Note: \ in the code denotes a line break for readability and should not be used in the real spreadsheetAfter estimating the model andvisualizing the results, you can use the Classification Tree to make predictions about the variable V16: the applicants willbe classified as “good” or “risky.” By running thefollowing code, the 15 observed variables for twopeople are used to estimate the probability of creditapproval. Generally, a “positive” value ( ) with probability higher than 0.5 will indicate to grant the loan.So the risk manager using this model will decide togrant the credit in both cases.library(rpart)#!rputdataframe trainingdata\'database'!A1:P691#!rputdataframe newcases\'predict'!A1:O3outdf -as.data.frame(predict(fit,newcases))predGroup - ifelse(outdf[,1] 0.5,\names(outdf[1]),names(outdf[2]))res -cbind(predGroup,outdf)#!rgetdataframe res'predict'!R1ISSN 2073-4859
8C ONTRIBUTED R ESEARCH A RTICLESCommandDescription#!rput variable range#!rputdataframe variable range#!rputpivottable variable range#!rget r-expression range#!rgetdataframe r-expression range#!insertcurrentplot cell-addressstore the value (contents) of a range in an R variablestore the value of a range in an R data framestore the value of a range in an R variablestore the value of the R expression in the rangestore the data frame value of the R expression in the rangeinsert the active plot into the worksheetTable 1: Special RExcel commands used in sheetsFigure 3: Graphical representation of the classification tree in the RExcel based application.The R Journal Vol. 3/2, December 2011ISSN 2073-4859
C ONTRIBUTED R ESEARCH A RTICLESThe potential of this approach is obvious: Verycomplex models, such as classification and regressiontrees, are made available to decision makers (in thiscase, the risk manager) directly in Microsoft Excel.See Figure 2 on page 6 for a screen-shot of the presentation of the results.Tidying up the spreadsheetIn an application to be deployed to end users, R codeshould not be visible to the users. Excel’s mechanismfor performing operations on data is to run macroswritten in VBA (Visual Basic for Applications, theprogramming language embedded in Excel). RExcelimplements a few functions and subroutines whichcan be used from VBA. Here is a minimalistic example:Sub Apply "sin",Range("A2"), Range("A1")RInterface.StopRServerEnd SubGetRApply applies an R function to argumentstaken from Excel ranges and puts the result in a range.These arguments can be scalars, vectors, matrices ordataframes. In the above example, the function sin isapplied to the value from cell A1 and the result is putin cell A2. The R function given as the first argumentto GetRApply does not necessarily have to be a namedfunction, any function expression can be used.RExcel has several other functions that maybe called in VBA macros. RRun runs any codegiven as string. RPut and RGet transfer matrices, and RPutDataframe and RGetDataframe transferdataframes. RunRCall similar to GetRApply calls anR function but does not transfer any return value toExcel. A typical use of RunRCall is for calling plotfunctions in R. InsertCurrentRPlot embeds the current R plot into Excel as an image embedded in aworksheet.In many cases, we need to define one or moreR functions to be used with GetRApply or the otherVBA support functions and subroutines. RExcel hasa mechanism for that. When RExcel connects to R (using the command RInterface.StartRServer), it will checkwhether the directory containing the active workbookalso contains a file named RExcelStart.R. If it findssuch a file, it will read its contents and evaluate themwith R (source command in R). After doing this, RExcel will check if the active workbook contains a worksheet named RCode. If such a worksheet exists, itscontents also will be read and evaluated using R.Some notes on handling R errors in Excel: The R implementation should check for all errors which areexpected to occur in the application. The applicationitself is required to pass correctly typed argumentsThe R Journal Vol. 3/2, December 20119when invoking an R/ function. If RExcel calls a function in R and R throws an error, an Excel dialog boxwill pop up informing the user of the error. An alternative to extensive checking is to use R’s try mechanismto catch errors in R and handle them appropriately.Using these tools, we now can define a macro performing the actions our scratchpad code did in theprevious section. Since we can define auxiliary funcions easily, we can also now make our design moremodular.The workhorse of our application is the followingVBA macro:Sub PredictApp()Dim outRange As If Err.Number 0 ThenMsgBox "This workbook does not "& "contain data for rpartDemo"Exit SubEnd dRangeRInterface.GetRApply"function("& "trainingdata,groupvarname,"& "newdata)predictResult(fitApp("& "trainingdata,groupvarname),"& .CurrentRegion)RInterface.StopRServerSet outRange urrentRegionHighLight outRangeEnd SubThe function predictResult is defined in theworksheet RCode.Packaging the applicationSo far, both our code (the R commands) and data havebeen part of the same spreadsheet. This may be convenient while developing the RExcel-based applicationISSN 2073-4859
10C ONTRIBUTED R ESEARCH A RTICLESor if you are only using the application for yourself,but it has to be changed for redistribution to a wideraudience.We will show how to divide the application intotwo parts, the first being the Excel part, the secondbeing the R part. With a clear interface between these,it will be easy to update one of them without affectingthe other. This will make testing and updating easier.Separating the R implementation from the Excel (orRExcel) implementation will also allow an R expertto work on the R part and an Excel expert to work onthe Excel part.As an additional benefit, exchanging the Excelfront-end with a custom application (e.g., written in aprogramming language like C#) will be easier, too, asthe R implementation will not have to be changed (ortested) in this case.The application’s R code interface is simple, yetpowerful. RExcel will only have to call a single Rfunction called approval. Everything else is hiddenfrom the user (including the training data). approvaltakes a data frame with the data for the cases to bedecided upon as input and returns a data frame containing the group classification and the probabilitiesfor all possible groups. Of course, the return valuecan also be shown in a figure.Creating an R packageThe macro-based application built in section “Tidying up the spreadsheet” still contains the R code andthe training data. We will now separate the implementation of the methodology and the user interfaceby putting all our R functions and the training datainto an R package. This R package will only expose asingle function which gets data for the new cases asinput and returns the predicted group membership asresult. Using this approach, our application now hasa clear architecture. The end user workbook containsthe following macro:Sub PredictApp()Dim outRange As RangeClearOutputRInterface.StartRServerThe implementation using an R package still has someshortcomings. The end user Excel workbook containsmacros, and often IT security policies do to not allowend user workbooks to contain any executable code(macros). Choosing a slightly different approach, wecan put all the VBA macro code in an Excel add-in. Inthe end user workbook, we just place buttons whichtrigger the macros from the add-in. When opening anew spreadsheet to be used with this add-in, Excel’stemplate mechanism can be used to create the buttonson the new worksheet. The code from the workbookdescribed in section “Tidying up the spreadsheet” cannot be used “as is” since it is written under the assumption that both the training data and the data forthe new cases are contained in the same workbook.The necessary changes, however, are minimal. Converting the workbook from section “Tidying up thespreadsheet” again poses the problem that the dataand the methodology are now deployed on the endusers’ machines. Therefore updating implies replacing the add-in on all these machines. Combining theadd-in approach with the packaging approach fromsection “Creating an R package” increases modularization. With this approach we have: Methodology and base data residing on a centrally maintained server.In this macro, we start a connection to R, load theR package and call the function provided by this packThe R Journal Vol. 3/2, December 2011Building a VBA add-in for Excel End user workbooks without any macro code.RInterface.RRun "library(RExcelrpart)"RInterface.GetRApply Set outRange Range("predict!R1").CurrentRegionHighLight outRangeEnd Subage and then immediately close the the connection toR.The statconnDCOM server can reside on anothermachine than the one where the Excel applicationis running. The server to be used by RExcel can beconfigured in a configuration dialog or even fromwithin VBA macros. So with minimal changes, theapplication created can be turned into an applicationwhich uses a remote server. A further advantage ofthis approach is that the R functions and data usedby the application can be managed centrally on oneserver. If any changes or updates are necessary, theExcel workbooks installed on the end users’ machinesdo not need to be changed. Connection technology for end users installedfor all users in one place, not separately for eachuser.Deploying the ApplicationUsing the application on a computer requires installation and configuration of various components.The required (major) components are: Microsoft Excel, including RExcel and statconnDCOM R, including rscproxyISSN 2073-4859
C ONTRIBUTED R ESEARCH A RTICLES The VBA Add-In and the R package createdthroughout this articleFor the simplest setup, all compontents are installed locally. As an alternative, you can also installExcel, RExcel and our newly built VBA Add-In onevery workstation locally and install everything elseon a (centralized) server machine. In this case, R,rscproxy, our application’s R package and statconnDCOM are installed on the server machine and onehas to configure RExcel to use R via statconnDCOMon a remote server machine. Please beware that thiskind of setup can be a bit tricky, as it requires a correct DCOM security setup (using the Windows tooldcomcnfg).DownloadingAll examples are available for download from theDownload page on http://rcom.univie.ac.at.BibliographyE. I. Altman. Bankruptcy, Credit Risk, and High YieldJunk Bonds. Blackwell Publishers Inc., 2002.T. Baier. rcom: R COM Client Interface and internalCOM Server, 2007. R package version 1.5-1.T. Baier and E. Neuwirth. R (D)COM Server V2.00,2005. URL http://cran.r-project.org/other/DCOM.T. Baier and E. Neuwirth. Excel :: COM :: R. Computational Statistics, 22(1):91–108, April 814108258m/.Basel Committee on Banking Supervision. International Convergence of Capital Measurement andCapital Standards. Technical report, Bank for International Settlements, June 2006. URL http://www.bis.org/publ/bcbs128.pdf.L. Breiman, J. Friedman, R. Olshen, and C. Stone.Classification and Regression Trees. Wadsworth andBrooks, Monterey, CA, 1984.J. M. Chambers. Programming with Data. Springer,New York, 1998. URL k/. ISBN 0-38798503-4.R. Drexel. ROOo, 2009. URL http://rcom.univie.ac.at/.The R Journal Vol. 3/2, December 201111T. Hastie, R. Tibshirani, and J. Friedman. The Elementsof Statistical Learning: Data Mining, Inference, andPrediction. Springer, 2009.INRIA. Scilab. INRIA ENPC, 1989.//www.scilab.org.URL http:B. D. McCullough and B. Wilson. On the accuracy ofstatistical procedures in Microsoft Excel 2000 andExcel XP. Computational Statistics and Data Analysis,40:713–721, 2002.Microsoft Corporation. Microsoft Office 2000/Visual Basic Programmer’s Guide. In MSDN Library, volume Office 2000 Documentation. Microsoft Corporation, October 2001. URL http://msdn.microsoft.com/.Microsoft Corporation and Digital Equipment Corporation. The component object model specification.Technical Report 0.9, Microsoft Corporation, October 1995. Draft.OpenOffice.org. OpenOffice, 2006. URL http://www.openoffice.org/.OpenOffice.org. Uno, 2009. URL http://wiki.services.openoffice.org/wiki/Uno/.H. Zhang and B. Singer. Recursive Partitioning in theHealth Sciences. Springer-Verlag, New York, 1999.ISBN 0-387-98671-5.Thomas BaierDepartment of Scientific ComputingUniversitity of Vienna1010 ViennaAustriathomas.baier@univie.ac.atErich NeuwirthDepartment of Scientific ComputingUniversitity of Vienna1010 ViennaAustriaerich.neuwirth@univie.ac.atMichele De MeoVenere Net SpaVia della Camilluccia, 69300135 RomaItalymicheledemeo@gmail.comISSN 2073-4859
We have chosen Excel as the primary tool for performing the analysis because of various advantages: Excel has a familiar and easy-to-use user inter-face. Excel is already installed on most of the work-stations in the industries we mentioned. In many cases, data collection has been per-formed using Excel, so using Excel for the anal-