Transcription
Proceedings of the International Conference on Industrial Engineering and Operations ManagementWashington DC, USA, September 27-29, 2018A Framework for Teaching Manufacturing ParadigmsUsing SimulationScott McCurdyCochranton Junior-Senior High SchoolCochranton, PA 16314, USAscott.mccurdy@craw.orgJohn NameyJefferson Area Junior-Senior High SchoolJefferson, OH 44047, USAjohn.namey@jalsd.orgFaisal AqlanIndustrial Engineering DepartmentPenn State BehrendErie, PA 16563, USAFUA11@psu.eduAbstractThis study presents a learning framework for manufacturing paradigms utilizing both physical and computersimulations. The objective of this study is to attract more people to manufacturing and address the problem oflacking young talents in the field. First, physical simulations of the five manufacturing paradigms (i.e., craftproduction, mass production, Lean production, mass customization, and personalized production) are developed inorder to understand the past, present and future of manufacturing and identify the associated skill sets. Thencomputer simulations are developed to imitate the physical experiments. The developed simulation will be used toteach high school students the basics of manufacturing and how simulation can be used to perform analysis ofmanufacturing systems. Preliminary results are discussed and suggestions for future work are presented.KeywordsManufacturing education, manufacturing paradigms, physical simulation, computer simulation.1. BackgroundEffective educators understand and employ techniques that promote student engagement. Engaging learningexperiences are those that have clear applications to the real world and use differentiated instructional strategiessuch a hands-on activities, multimedia events, creative thinking, and cooperative learning to name a few. Specific toScience, Technology, Engineering, and Math (STEM) education, engaging activities can readily align to real-lifeapplications associated with manufacturing and industrial processes. STEM education continues to expand whichaffords more opportunities to expose students to manufacturing processes. The use of computer simulation to studyand analyze manufacturing systems have been discussed by many authors in the literature. Simulation provides aneasy method to run experiments on the system model and make changes on it that may be very costly if performedon the real system (Al-Hawari et al., 2010). Studies also showed many manufacturing improvement possibilitiesbased on simulation of various production control strategies in production systems (Kosturiak and Gregor, 1998).Several studies have used simulation for different applications in manufacturing systems such as capacity analysis(Gujarathi et al., 2004), production line consolidation (Aqlan et al., 2014), study of design changes (Zhiwei andYongxian, 2008), and evaluation of design alternatives (Owens and Levary, 2002).This study considers three manufacturing paradigms, namely craft, mass, and lean production. The first paradigm,craft production, is characterized by skilled craftsmen individually producing goods without the use of automation IEOM Society International1452
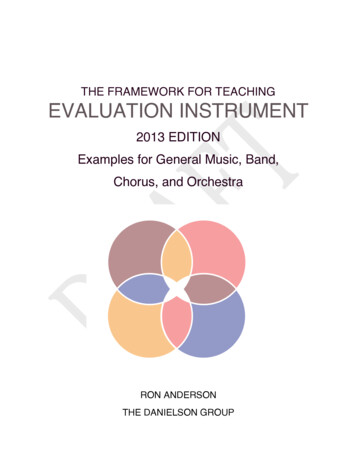
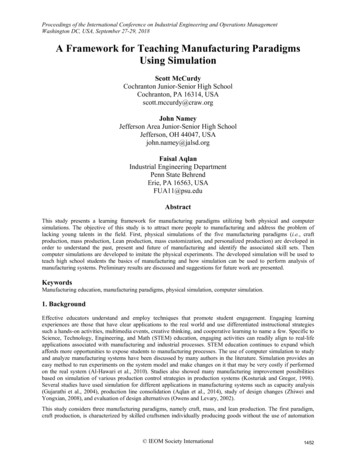
Proceedings of the International Conference on Industrial Engineering and Operations ManagementWashington DC, USA, September 27-29, 2018or assembly lines. It is considered the original form of production models that produces a relatively low volume ofhighly varied products, analogous to woodworkers and pottery artisans. The latter exemplar outlines production of alarge number of similar products efficiently. Mass production is typically described as system that usesmechanization, such as an assembly line, to achieve accurate organization of material and work flow. The twoparadigms fall on different sides of the push-pull production strategy, where craft production follows the “pull”action by waiting for customer requests and special arrangements, and mass production exhibits the “push” approachby making projections on demand which then determines what enters the production process. Lean production is aphilosophy that promotes increase in efficiency and productivity for production by removing wastes and reducinglead time.The developed simulations discussed in this study will be used to teach the principles of manufacturing paradigms tohigh school students. We first developed physical simulations of manufacturing paradigms which is conducted byhigh school teachers, most of them have years of experiences working in manufacturing industry. Then we collecteddata from the physical simulation hands-on activities and developed computer simulations that mimic the physicalsimulations. Computer simulations will allow for studying the behavior of the systems and performing differentwhat-if scenarios. A unit plan is developed so that STEM subject teachers can use in high school classrooms thatwill expose students to manufacturing systems while aligning to state and national learning standards. The unit planincludes differentiated instructional strategies and teems with real-world applications. The classroom becomes amanufacturing facility, production includes building Lego cars, and students physically perform the various roles inthe process. Students also use computer simulation software (e.g., Arena , Simio , Plant Simulation , FlexSim ,Simcad , AnyLogic ) to represent the process visually and conduct verification and validation analysis.2. Research MethodologyShown in Figure 1, the proposed research methodology focuses on developing simulations for manufacturingparadigms that will be used to teach high school students the principles of manufacturing systems as well as the useof computer simulation to study and analyze manufacturing systems and processes. First, the goals of the researchstudy were defined which include developing simulations for manufacturing systems and associated lesson plans.Then the researchers identified the configuration of the manufacturing system to be studied and how the system willbe modeled. The physical simulation activities are then developed. While running the physical simulation activities,data were collected and analyze to be used in the computer simulations. The physical simulations use Lego blocksand are conducted by groups of high school teachers. Computer simulations are developed in Simio and Arena simulation software (www.simio.com; www.arenasimulation.com). Data collected from the physical simulationinclude process times, number of products produced, and defect rates. Computer simulation models are fine-tunedthrough verification and validation processes to make sure the model is a correct representation of the originalsystem. Once the simulation model is verified and validated, it can then be used to conduct what-if analysis andstudy the impact of different variables on system performance. Lesson plans can be developed to be used in a highschool classroom setting. Examples of lesson plans to be developed: (1) basics of computer simulation and statisticalanalysis, (2) the use of computer simulation to study and analyze manufacturing systems, (3) effect of variability onmanufacturing system performance.Define researchgoalsIdentify systemconfigurationDevelopphysicalsimulationRun simulationactivityCollectsimulation dataDevelopcomputersimulationVerification andvalidationUse simulationto analyzesystemAnalyze resultsDevelop lessonplansFigure 1. Research framework IEOM Society International1453
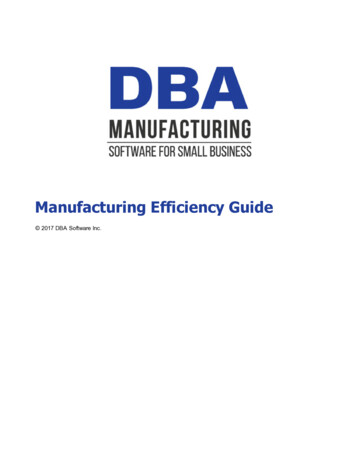
Proceedings of the International Conference on Industrial Engineering and Operations ManagementWashington DC, USA, September 27-29, 20183. Case StudyIn this Section, we present simulations of three manufacturing paradigms, craft, mass, and lean production. Throughthe perspective of a high school classroom context, we developed a series of activities that will become lesson plansfor high school students. By working through these activities, students will gain a deeper understanding of thecharacteristics of craft production and mass production paradigms and the lean philosophies that can be applied. Weplanned five different learning activities to engage students and foster understanding of the two manufacturingparadigms: (1) create process flow charts, (2) perform physical simulation activity, (3) organize data acquisition andanalyze collected data, (4) develop computer simulation models, (5) conduct verification and validation analysis.3.1. Process Flow ChartsThe purpose of the flow chart is to simplify the production process into a visual aid with certain shapes indicating aparticular type of step, as shown in Table 1.Table 1. Flow chart symbols and their meaningSymbolNameDescriptionCircleProcess start/stopArrowConnectors, direction of flowRectangleWork station, action processDiamondDecision pointParallelogramInput/output dataFor craft production, we elected to represent production of Lego cars with two processes: (1) Ordering Process, (2)Building Process. The ordering process highlights the steps involved in craft production from the customer-builderperspective and is represented in Figure 2.Figure 2. Ordering process flow chart for craft production simulation IEOM Society International1454
Proceedings of the International Conference on Industrial Engineering and Operations ManagementWashington DC, USA, September 27-29, 2018The building process highlights the steps involved in craft production from the builder’s perspective. Steps includesupply acquisition and assembly, quality control and packaging, as shown in Figure 3.Figure 3. Building process flow chart for craft production simulationMass production begins with the company pushing the industry based on high volume and profit. The customer doesnot play a role until the point of purchase. The flow chart in Figure 4 highlights the steps involved in massproduction, including steps in an assembly line, inspection checkpoints, performance testing, and packaging. Figure5 shows the flow chart for Lean productionFigure 4. Process flow chart for mass production simulation IEOM Society International1455
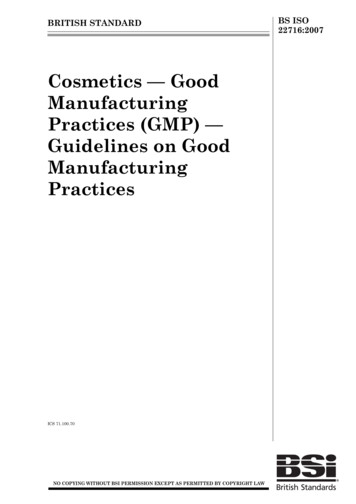
Proceedings of the International Conference on Industrial Engineering and Operations ManagementWashington DC, USA, September 27-29, 2018Figure 5. Process flow chart for lean production simulation3.2. Physical Simulation EventThe physical simulation can be performed by approximately 14 members divided into two groups of to performroles associated with craft production paradigm: five builders, one supplier, and one person collecting data and alsoserves as the customer. We used dice rolls to produce random customer orders. Figure 6 represents the basicclassroom setup for one group. This layout is for the craft production paradigm and other layout can also bedeveloped for the other types of manufacturing paradigms.Figure 6. Group layout for craft production hands-on activity IEOM Society International1456
Proceedings of the International Conference on Industrial Engineering and Operations ManagementWashington DC, USA, September 27-29, 2018The physical simulation of mass production involved 14 members divided into two groups of seven to perform rolesassociated with mass production paradigm: five assembly stations, one inspector traveling to each station, and oneperson doing performance testing and packaging. Each assembly worker recorded time data as they completed theirstep. Inspector then signs off on completion and car moves to next step. Customers were represented by dice roll atthe end of production run time, randomizing purchase volume. Figure 7 represents the basic classroom setup for onegroup for the mass production activity.Figure 7. Group layout for mass production hands-on activityThe physical simulation for lean production (shown in Figure 8) included a floating worker called a processtroubleshooter, three assembly stations, and a performance testing station. Inspection was part of each assembler’sresponsibility. The process troubleshooter kept the parts supply flowing as well as reworked any cars that failedperformance testing so that assembly production flow was never interrupted. Figure 9 shows some pictures of thephysical simulation activities for the manufacturing paradigms.Figure 8. Group layout for lean production hands-on activityInspection and TestFinished ProductFigure 9. Physical simulation activity IEOM Society International1457
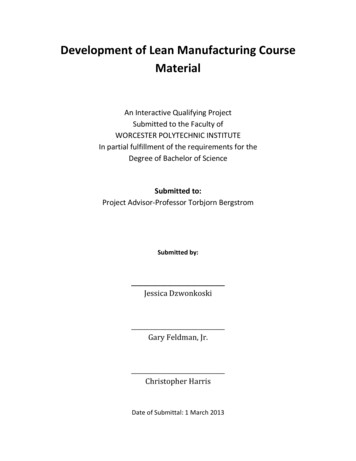
Proceedings of the International Conference on Industrial Engineering and Operations ManagementWashington DC, USA, September 27-29, 20183.3. Data CollectionData collection focused on timing the production steps, quality control pass/fail rates, and production quantities.This data is used later as input for the simulation software that represents the process. An example of the datacollected for process time (in minutes) for the craft production activity is shown below. This data was then fittedinto proper statistical distribution (see Figure 8) to be used as input for the computer simulation model. Other datacollected include failure rates, order arrivals, and throughput.4.87, 4.34, 3.08, 5.89, 4.85, 4.2, 5.00, 6.25, 4.85, 3.95, 7.00, 5.44, 5.44, 3.69, 4.64, 6.73, 1.43, 6.60, 4.94, 4.12, 4.48,6.49, 2.44, 7.03, 4.96, 6.35, 8.14, 4.41, 5.23, 4.05Figure 10. An example of fitting process time data into statistical distributionSimilar to the craft production case study, data collection focused on timing the production steps, quality controlpass/fail rates, and production quantities. This data is used later as input for computer simulation. An example ofthe data collected for process time (in minutes) for one of the assembly stations is shown below. The data was fittedinto statistical distribution as shown in Figure 81.120.380.370.30.20.910.620.64Figure 11. An example of fitting assembly station process time data into statistical distribution IEOM Society International1458
Proceedings of the International Conference on Industrial Engineering and Operations ManagementWashington DC, USA, September 27-29, 2018Tables 2 and 3 show the statistical distributions for the mass production and Lean production process timers,respectively. The p-values of 0.5 indicate that the fitting of the distributions is good.Table 2. Statistical distributions for mass production process timesProcessDistributionP-valueStation 1WEIB(0.972, 2.51)0.087Station 2LOGN(0.748, 0.659)0.195Station 3EXPO(0.365)0.527Station 42.24 * BETA(1.04, 2.93)0.150Station 52.39 * BETA(1.17, 3.08)0.150Station 6 - 1 0.24 1.76 * BETA(1.68, 0.896)0.150Station 6 - 2LOGN(0.394, 0.421)0.121Table 3. Statistical distributions for Lean production process timesProcessDistributionP-valueStation 1 0.17 0.93 * BETA(0.909, 0.839)0.642Station 20.01 0.99 * BETA(1.1, 1.18)0.061Station 3LOGN(0.298, 0.268)0.050Station 41.36 * BETA(1.36, 1.680.144Station 50.02 EXPO(0.206)0.2013.4. Developing Computer SimulationsIn order to develop the computer simulation models, we first developed the conceptual models (shown in Figures 2,3 and 4). Then Simio and Arena software were used to build the models. Figure 12 shows a high level example ofthe computer model in Simio.Figure 12. A simple computer simulation model for craft production using Simio IEOM Society International1459
Proceedings of the International Conference on Industrial Engineering and Operations ManagementWashington DC, USA, September 27-29, 2018For the mass and lean production simulations, we used Arena software. Figures 13 and 14 show examples of thesimulation model in Arena for mass production and Lean production, respectively.Figure 13. A computer simulation model for mass production using Arena softwareFigure 14. A computer simulation model for lean production using Arena software3.5. Models Verification and ValidationSimulation model verification and validation are two techniques necessary to ensure the model is a goodrepresentation of the original system. Model verification, which is the process of ensuring that the model behaves inthe way it was intended according to the modeling assumptions (Silva et al., 2000) is performed using animation andwalkthroughs of model logic 3. Validation, however, is the process of insuring that the model behaves similar to thereal system (Kelton et al., 2007). In order to check the validity of the model, the results obtained from the model arecompared with the results from the real system, see Table 4. The p-values of 0.05 indicate the validity of thesimulation model which means that the simulation model is a good representation of the physical simulation. Aftervalidating the simulation models, they can now be used to study and analyze the manufacturing systems. Forexampl, the number of stations in each system can be increased or decreased to study the impact on the systemperofrmance. Difference scenarios acan also be generated and comapred.Table 4. Verification and validation of mass production simulation modelAverage cycle time Average ThroughputPhysical Simulation6.449Computer Simulation6.548.75% Difference-1.5%2.9%P-value0.790.544. ConclusionsThis study presented a framework for teaching manufacturing systems using simulation. Both physical and computersimulation for the manufacturing paradigms were developed by high school teachers. The developed simulationswill be used to teach high school students about the principles of manufacturing systems. Results from both physicaland computer simulation were obtained and compared. Future work will focus on developing simulations for thedifferent types of manufacturing paradigms (i.e., mass production, Lean production, mass customization, and IEOM Society International1460
Proceedings of the International Conference on Industrial Engineering and Operations ManagementWashington DC, USA, September 27-29, 2018personalized production). Moreover, lesson plans and curriculum modules will be developed and aligned witheducational standards. Virtual reality will be integrated with the simulations and results from physical simulation,computer simulation, and virtual reality will be analyzed and compared.ReferencesAl-Hawari, T., Aqlan, F., Al-Buhaisi, M., and Al-Faqeer, Z., Simulation-based analysis and productivityimprovement of a fully automatic bottle-filling production system: A practical case study, Second InternationalConference on Computer Modeling and Simulation, pp. 195-199, 2010.Aqlan, F., Lam, S.S., and Ramakrishnan, S., An integrated simulation-optimization study for consolidatingproduction lines in a configure-to-order environment, International Journal of Production Economics, 148, pp.51-61, 2014.Gujarathi, N., Ogale, R., and Gupta, T., Production capacity analysis of a shock absorber assembly line usingsimulation, Proceedings of Winter Simulation Conference, Washington, DC, pp. 1213-1217, 2004.Kelton, W.D., Sadowski, R. and Sturrock, D., Simulation with Arena, 4th ed., 2007, New York: McGraw-Hill.Kosturiak, J., and Gregor, M., FMS simulation: Some experience and recommendations, Simulation ModelingPractice and Theory, 6, pp. 423-442, 1998.Owens, S., and Levary, R., Evaluating design alternatives of an extruded food production line using simulation,Simulation, 78(10), pp. 626-632, 2002.Silva, L., Ramos, A., and Vilarinho, P., Using simulation for manufacturing process reengineering- a practical casestudy, Winter Simulation Conference, 2000.Zhiwei, X., and Yongxian, L., Mechanical production line simulation and optimization analysis, Proceedings ofIEEE International Conference on Automation and Logistics, Qingado, China, pp. 2925-2930, 2008.AcknowledgementThis research is funded by the National Science Foundation NSF RET- #1711603: RET Site in ManufacturingSimulation and Automation. Any opinions, findings, or conclusions found in this paper are those of the authors anddo not necessarily reflect the views of the sponsor.BiographiesScott McCurdy is in his 12th year in public education. He earned undergraduate degree and teaching certificationsfrom Grove City College and has worked with students at all levels in the subjects of Physics, Mathematics, andGeneral Sciences. His teaching background includes 11 years in classroom where he worked extensively on STEMrelated initiatives. He connected local employers with his classroom curriculum and helped facilitate STEMprofessional development across the state of Maryland. He has also coached JV and Varsity sports during his career.Along the way, he earned his M.Ed. in School Administration from Liberty University and is currently the AssistantPrincipal and Athletic Director at Cochranton Jr/Sr High School in Pennsylvania. His most recent STEM-relatedambitions focus on piloting school’s first group of students to work through a newly created STEM Academy.John Namey has been a Math teacher and and sports coach at Jefferson High School for 4 years. He obtained hisBS in Mathematics from The Ohio State University. By obtaining a Resident Educator License through ODE, he hastaken the mathematical theory he learned from OSU back to his hometown of Jefferson to try and get studentsinterested in STEM. He has worked on computer programming throughout college and into his professional career.Faisal Aqlan is currently an assistant professor of Industrial Engineering and Master of Manufacturing Management(MMM) at Penn State Behrend. He earned his Ph.D. in Industrial and Systems Engineering from the StateUniversity of New York at Binghamton in 2013. Aqlan has worked on industry projects with Innovation AssociatesCompany and IBM Corporation. His work has resulted in both business value and intellectual property. He is acertified Lean Silver and Six Sigma Black Belt. He is a senior member of the Institute of Industrial and SystemsEngineers (IISE) and currently serves as the president of IISE Logistics and Supply Chain Division, director ofYoung Professionals Group, and founding director of Modeling and Simulation Division. Aqlan is also a member ofAmerican Society for Quality (ASQ), Society of Manufacturing Engineers (SME), and Industrial Engineering andOperations Management (IEOM) Society. He has received numerous awards including the IBM Vice Presidentaward for innovation excellence, Penn State Behrend’s School of Engineering Distinguished Award for Excellencein Research, and the Penn State Behrend’s Council of Fellows Faculty Research Award. Aqlan is the PrincipalInvestigator and Director of the NSF RET Site in Manufacturing Simulation and Automation at Penn State Behrend. IEOM Society International1461
the end of production run time, randomizing purchase volume. Figure 7 represents the basic classroom setup for one group for the mass production activity. Figure 7. Group layout for mass production hands-on activity The physical simulation for lean production (shown in Figure 8) included a floating worker called a process