Transcription
Global AutomotiveSupplier Study2019After years of excellent growth,the market environment is gettingdifficultAugust 2019
actsIncreasinglydifficult environment after recordprofits until lastyearThe transformation of theautomotiveindustry is wellunderwaySuppliers havedifferentopportunities toprepare for thefutureRoland Bergerand LazardAutomotiveteams Roland Berger/Lazard2
Executive Summary (1/2) After record years, the automotive industry is facing a difficult time with multiple market uncertainties and a globalproduction volume decline by -5% in H1/2019 vs. H1/2018 Especially the slowdown in the world's largest market, China, since H2/2018 is causing problems for the globalsuppliers As a result – 2019 will not be a year of recovery, but rather stay challenging for automotive suppliers. The averageindustry margin is expected to fall below 7% for the first time in the last seven years driving sector valuations below10-year average Amidst a weakening market environment some structural changes have taken place: Profitability of China/NAFTA-based suppliers is shrinking. However, it is still better than that of European peers. AlthoughJapanese suppliers improved in comparison with previous years, they remain well below other regionsTire and chassis suppliers are leading in margins. Interior players remain at the bottom of the automotive suppliers fieldProfitability of product innovators came down to 7.3% EBIT margin in the last year, reducing their relative advantage in comparisonwith process specialists Digitization appears to be one of the most important near-term topics for suppliers as it touches multiple dimensions:the potential to create new business models, offer new products and services, and improve the efficiency ofoperational and administrative processes In the long term the mobility landscape of today will change – especially as new market entrants possess a nonautomotive mindset and capture parts of the future automotive businessSource: Roland Berger/Lazard3
Executive Summary (2/2) For traditional automotive suppliers the risks in the market are high: on the one hand, they could potentiallymiss out on new revenue opportunities, and on the other hand, they face increasing price pressure from theOEM side, who have to deal with increasing capital requirements and declining profit pools themselves For traditional suppliers, access to capital may become tougher. Equity investors favor other industries whereasfinancing banks are becoming more cautious about cyclicality and long-term threats, especially for many smalltraditional suppliers. In addition, M&A activities in the sector have gone down recently, with Chinese investors,representing an important buyer group, becoming less active While many small traditional players will face difficult times, new global entrants and technology system integrators aregenerally well-positioned for tomorrow's changes. Performance-improvement programs, accelerated capacityadjustments and pro-active portfolio management are recommended countermeasures for most suppliersSource: Roland Berger/Lazard4
actsIncreasinglydifficult environment after recordprofits until lastyearThe transformation of theautomotiveindustry is wellunderwaySuppliers havedifferentopportunities toprepare for thefutureRoland Bergerand LazardAutomotiveteams Roland Berger/Lazard5
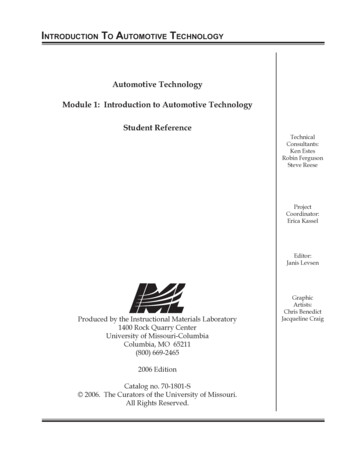
Within the first half of 2019 the global automotive marketssignificantly weakened relative to 2018Recent developments in the automotive industryH1/18 vs. H1/19 [m units]1)Automotive headlines-5%48.4OthersJapan/South KoreaSouth AmericaNAFTA6.046.05.66.61.78.7"Again a Schaeffler profitwarning"Handelsblatt Online – 07/196.5"Insolvency of EisenmannGroup – Next largeautomotive supplier failed"1.7Wirtschaftswoche Online – 07/198.6"Bosch sees car productionfalling 5% in 2019"ReutersNews – 07/19Europe2)China3)11.911.2"Goodyear Tire & Rubber'sProfit, Revenue MissEstimates"Dow Jones Institutional News –07/1913.512.4H1/2018H1/20191) Global light vehicle production volumeDow Jones Institutional News –07/19"Weak automotive economystarting to badger Hella"Dow Jones Newswires Chinese –07/19"Ford's Shrinking ChinaBusiness Is Hurting ItsGlobal Ambitions"Dow Jones Institutional News –07/19"Michelin margins hit by autoslump despite price hikes""There is a storm brewing"ReutersNews – 07/19"Slackness in sales –Automotive economy in thedownturn"Handelsblatt Online – 07/19"Renault Profit Drops, Hit byLower Sales, Nissan Payout"ReutersNews – 07/19Dow Jones Institutional News –07/193) Greater China"Nissan to Cut 12,500 Jobsas Its Profit Plunges"Reuters – 07/19"U.S. auto sales seenslipping in July"2) Excluding CIS and TurkeySource: IHS May/June 2019, Automotive, Roland Berger/Lazard"Lear 2Q Profit Falls AmidGlobal Vehicle ProductionDecline"AUTOMOBIL PRODUKTION –07/19"Due to weakeningautomotive markets presssupplier Schuler cuts 500jobs"Handelsblatt – 07/196
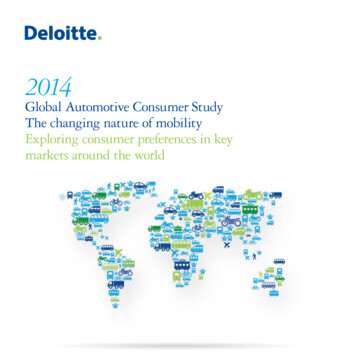
2018 production was lower than 2017, driven by weakness in Triadmarket in H2/2018 – Further decline expected in 2019Global light vehicle production volume1) by region, 2014-2019e [m units]NAFTAEurope3)CAGR2): -0.1%CAGR2): 2.3%-2%18.1China4)18.7-2%18.918.618.117.0 17.5 17.8 17.1 17.0 16.716.92014 2015 2016 2017 2018 2019e2014 2015 2016 2017 2018 2019eSouth AmericaCAGR2): -2.8%WorldCAGR2): 1.9% 4%3.83.12.73.33.43.62014 2015 2016 2017 2018 2019e-3%87.4 88.8 93.1 95.1 94.2 91.4Most recent expectations announcedby many large suppliers as part of theirH1/2019 earnings even -5%.2014 2015 2016 2017 2018 2019eCAGR2): 1.7%23.0 24.0-7%27.4 28.0 26.9 25.02014 2015 2016 2017 2018 2019eJapan/KoreaCAGR2): -0.9%-1%13.7 13.2 12.9 13.2 13.2 13.12014 2015 2016 2017 2018 2019e1) Incl. light commercial vehicles; 2) CAGR 2014-2018; 3) Excluding CIS and Turkey; 4) Greater ChinaSource: IHS May/June 2019, Roland Berger/Lazard7
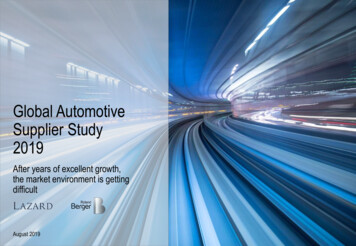
Growth and profit of previous years come to an end – Average 2019EBIT margin likely 7% for the first time in the last seven yearsKey supplier performance indicators, 2012-2019e (n 600 suppliers)Revenue growthEBIT margin [%]Indexed [2012 100]100107113120123126127 120–1256.87.27.37.17.17.27.2 6.0–6.3YoY e: Company information, analyst forecasts, Lazard/Roland Berger supplier database20122013201420152016201720182019e8
The overall sentiment is also reflected in supplier valuation levelsthat trade below their long-term averageEvolution of automotive supplier valuations Valuation multiples of publicly tradedautomotive suppliers are below theirlong-term average values, driven bythe weakening market environmentand the existing uncertainties in thechanging automotive industry, pairedwith investors' cyclical concernsEV/EBITDA NTM1)11xImpacted by theeconomic crisis9x7x6.2x2)10-y-Ø 6,0x10-y-Ø 6.0x2)5,1x5x10-y-Ø 4.4x2)3,5x3xJapanese suppliers3)European suppliers4)Aug 19Aug 18Aug 17Aug 16Aug 15Aug 14Aug 13Aug 12Aug 11Aug 10Aug 091x Recent multiple uplift in early summer2019 also driven by reduced earningsforecasts Many suppliers are currently facingdeteriorating free cashflows, givencomparably high working capital andcapex requirements in addition to theshrinking operating profits Japanese companies continue totrade at a discount to European andNorth American suppliers, reflectingthe stagnation in their home marketNorth American suppliers5)1) NTM Next twelve months; 2) Excluding the distorting impact of the economic crisis (Aug–Dec 2009 multiples); 3) Aisin Seiki, Bridgestone, Denso, Exedy, JTEKT,Keihin, Koito, NHK Spring, NSK, Stanley Electric, Showa, Sumitomo Riko, Tokai Rika, Toyoda Gosei, Toyota Boshoku and TS Tech; 4) Autoliv, Autoneum, Brembo, CIE,Continental, ElringKlinger, Faurecia, Georg Fischer, Haldex, Hella, Leoni, Norma, Plastic Omnium, PWO, SHW, SKF, Stabilus and Valeo; 5) American Axle, BorgWarner,Cummins, Dana, Delphi, Iochpe-Maxion, Lear, Magna, Martinrea, Meritor, Tenneco, Tower and VisteonSource: Factset, Roland Berger/Lazard9
The gap between the valuation of automotive OEMs and suppliers hasnarrowed since the beginning of 2018, driven by suppliers' multiple de-ratingEvolution of automotive OEM and supplier valuationsP/E NTM1)29xImpacted by theeconomic crisis27x25x23x21x19x17x15x13x10-y-Ø 11.0x2)10-y-Ø 9.0x2)8.2x6.8x11x9x7x5x3xSelected automotive OEMs3)Selected automotive suppliers4)Aug 19Aug 18Aug 17Aug 16Aug 15Aug 14Aug 13Aug 12Aug 11Aug 10Aug 091x Supplier valuation multipleshave historically outperformedOEMs, with OEMs' valuationsappearing to have reflectedrisks from disruptive trendsto a larger extent However, the valuationspread has narrowed in2018 and 2019 Investors seem to increasinglyfactor in the headwinds andcost of disruption in theirsupplier valuations, being atthe same time more cautiousabout the cost and paybackof growth areas for thesupplier sector1) NTM Next twelve months; 2) Excluding the distorting impact of the economic crisis (Aug–Dec 2009 multiples); 3) BMW, Daimler, Ford, General Motors, Honda, Toyota and Volkswagen;4) American Axle, Autoliv, BorgWarner, Brembo, Continental, Dana, Delphi, Faurecia, Hella, Magna, Norma and ValeoSource: Factset, Lazard/Roland Berger10
Financial performance of suppliers varies greatly depending onregion, company size, product focus and business modelProfitability trends in the global automotive supplier industry 2018Region1 Company size 2 Product focus 3 Business model 4 Chinese-based suppliers achieved Mid-size suppliers (EUR 1.0 to 2.5 Tire suppliers benefit from their Process specialists are able tothe highest EBIT margins withbn revenues) could realize theaftermarket business and continuecatch up to product innovators in 9.0% in 2018highest EBIT margins with 8.7%to realize high EBIT margins ofterms of EBIT margins 11.3% NAFTA-based suppliers profit from Large suppliers with EUR 10 bn The systematic "lean" focus of thetheir previous restructuring effortsrevenues achieved above average Chassis suppliers alsolast years pays off with 6.6% EBITreaching 8.4% EBIT marginsEBIT margins of 7.3%outperform the market and reachmarginsEBITmarginsof 8.1%drivenby However, in both regionsrecent technology trendsdeterioration expected for 2019 Japanese suppliers have Very large suppliers (EUR 5.0 bnimproved but remain at a low levelto 10.0 bn revenues) fall behindof 5.8% EBIT marginswith an EBIT margin of 6.5% Globally, suppliers expected to Small suppliers (EUR 0.5 bn toface margin declines in 20191.0 bn revenues) fail in terms oftranslating above-average growthinto profitability improvementsSource: Company information, Roland Berger/Lazard, Roland Berger/Lazard supplier database Powertrain suppliers lost groundand achieved below-averagemargins Interior suppliers still trail theirpeers, with recently increasingmargins but still waiting for futurecustomization trends to realize Product innovators are growingstrongly but have difficultiestranslating this further into aboveaverage EBIT margins11
1RegionAutomotive suppliers globally have to deal with declining margins –NAFTA- and China-based suppliers still above averageKey supplier performance indicators by region 2018 [%]RevenueCAGR2012–2018 10.7%9.0 1.9% 4.9% 3.5% 4.3%8.47.12018 Ø 7.26.66.2EBIT margin2018ChinaNAFTAEuropeSouth KoreaSource: Company information, Roland Berger/Lazard, Roland Berger/Lazard supplier databaseJapan China-based suppliers defended theirfar-above-average margins; however,they are expected to suffer from theslowdown in the domestic market sinceH2/18 NAFTA-based suppliers can defendtheir excellent position from previousyears and are still outperformingEuropean players, but will also seefurther declines due to the negativemarket development in H2/18 and 2019 Europe based suppliers fall behind interms of margin development; 2018 andbeginning of 2019 were difficult due tovolume declines and output issues inconjunction with the new WLTP process As in previous years, South Korea–based suppliers' margins are belowaverage Japan-based suppliers proceededwith their recovery in terms ofprofitability but are still far behind theother regions12
2Company sizeFinancially strong multinational suppliers as well as mostlytechnology-focused mid-size suppliers achieve the highest marginsKey supplier performance indicators by company size (EUR bn sales) 2018 [%]RevenueCAGR2012–2018 4.3% 6.5% 3.4% 1.2% 5.3% 4.6%8.72018 7.27.07.07.36.55.7EBIT margin2018 0.50.5-1.01.0-2.52.5-5.0Source: Company information, Roland Berger/Lazard, Roland Berger/Lazard supplier database5.0-10.0 10.0 Large multinational suppliers (aboveEUR 10 bn revenues) can leveragescale effects and benefit from additionalbusiness potentials due to newtechnologies or digital business models Very large suppliers (EUR 5 bn to 10bn revenues) are in a sandwich positionbetween OEM price pressure and highcapital requirements for newtechnologies and further growth Large suppliers (EUR 2.5 bn to 5 bnrevenues) achieve industry-averagevalues for revenue growth and margins Mid-size suppliers (EUR 1.0 bn to 2.5bn revenues) achieve above-averageprofitability, mostly on the back of a veryfocused and technology-enabledproduct portfolio Small suppliers (EUR 0.5 bn to 1.0 bn)seem to have difficulties translatinggrowth into margin improvement13
3Product focusTire suppliers benefit from favorable raw material costs & businessmodel – Chassis suppliers well positioned for future technologiesKey supplier performance indicators by product focus 2018 [%]RevenueCAGR2012–2018 0.4% 2.7% 4.5% 5.4% 3.3% 3.6%11.38.17.42018 7.26.46.95.6EBIT margin2018TiresChassisPowertrainExteriorSource: Company information, Roland Berger/Lazard, Roland Berger/Lazard supplier databaseElectrics/Infotainm.Interior Tire suppliers can benefit from theiraftermarket business; favorable rawmaterials price developments in the pasthelped to achieve far-above-averagemargins Chassis suppliers achieve aboveaverage margins due to advanceddriver assistance and active safety Powertrain margins further pressurizedby intensified competition, the cost of(multiple) innovations and the rise ofelectric vehicles Exterior suppliers have been growingstrongly. Margins benefited from rawmaterials price developments andincreasing importance of light weightwith high-quality material Electrics/infotainment suppliers stillbelow average although importance ofcomponents is increasing – intensifiedcompetition Interior suppliers don't see a recovery14
4Business modelProduct innovators have not kept the high margin levels of theprevious years and have to focus on process efficiency in the futureKey supplier performance indicators by business model 2018 [%]RevenueCAGR2012–2018 5.4% 3.8%7.36.6EBIT margin2018Product innovator1) On average, innovative products featurehigher differentiation potential andgreater OEM willingness to pay higherprices But overall profit margins of productinnovators came under pressure dueto increasing OEM price pressure andintensified competition Efficiency improvements, e.g.subsequent to Industry 4.0 opportunitiesand lean approaches seem to pay offfor process specialists Gap between process specialists andproduct innovators reduced over thelast years; reason to be seen in theMADE3) trends and the resultingfinancial/operational challenges,especially for product innovatorsProcess specialist2)Note: Analysis excludes tire suppliers.1) Business model based on innovative products with differentiation potential; 2) Business model based on process expertise (while product differentiation potential is limited)3) M Mobility A Autonomous D Digitization E ElectrificationSource: Company information, Roland Berger/Lazard, Roland Berger/Lazard supplier database15
4Business modelHowever, the top performers in terms of average margins are stillamong the product innovatorsRevenues CAGR 2012–2018Key performance indicators of top vs. low-performing suppliers1)14131211109876543210Top processspecialistsTop productinnovatorsØ 4.6%Low productinnovatorsLow processspecialists01234 Product innovators outperformprocess specialists in terms ofaverage profitability Top process specialists, though,achieve average revenue growththat is above the top productinnovators Top process specialist growthis also accelerated by M&Aactivities of several players Large difference in growth ratesbetween top and low-performingprocess specialists indicates therelevance of scale economiesØ 7.2%56789 10 11 12 13Avg. EBIT2) margin 20181) Top (low) performance based on above-average (below-average) revenue growth 2012–2018, ROCE 2012–2018 and ROCE 2018; 2) EBIT after restructuring itemsSource: Company information, Roland Berger/Lazard, Roland Berger/Lazard supplier database16
actsIncreasinglydifficult environment after recordprofits until lastyearThe transformation of theautomotiveindustry is wellunderway.Suppliers havedifferentopportunities toprepare for thefutureRoland Bergerand LazardAutomotiveteams Roland Berger/Lazard17
The importance of mobility- and digitization-related business modelssignificantly increased while electrified mobility is becoming normalityMADE temperature check 2017 vs. todayMobilityThe future of movingpeople & goodsAutonomous drivingReplacing drivers to improvesafety, cost & efficiencyDigitizationBig Data analytics,connectivity & AIElectrificationHybrid or electric powertrains,batteries, and electric actuationSource: Roland Berger/Lazard20172019Ride-hailing firmsscaling up. OEMstrying to figure outtheir role.Ride-hailing playersbecome technologydrivers. Key roleas future clients.Autonomous mobilityis the matter of theday. Key topic forsuppliers & OEMs.First players withinautonomous mobilityestablished. Hype hascalmed down.Digitization &connectivity indiscussion. Focuse.g. on Industry 4.0.Digitization of businessmodels fully underway.New sales channels and products.OEMs and suppliersheavily investing inelectrified mobilityas a future marketMore and more car modelson the road. Suppliers needto decide if they intensifytheir activities as well.18
The change in the automotive industry is gaining speed, affecting themarket landscape, product portfolios and required employee skillsCurrent developments within the automotive industryMarket trendsImpactsSource: Roland Berger/Lazard1Prerequisites for electric vehicles constantly getting better, e.g. furtheremission regulations and ICE city bans, decreasing battery costs orimproving infrastructure23Beside new forms of mobility also the mobility mix itself is changing4567Data-based and digital business models enable new business potential89Required employee skill-set is changing dramaticallyUncertainty remains over technical development path and legalframework for autonomous drivingSales potential for certain products likely to fall dramaticallyCustomers continue to push suppliers for cost reductionsNew players enter the automotive business across the entirevalue chainAccess to capital is expected to become tougher given a shrinkingrelative attractiveness of the automotive sector19
Prerequisites for electric vehicles constantly getting better1Sales numbers for electrified cars still low – But, despite the automotive market cool-down in H2/2018, all markets saw growth for xEVEV/PHEV/FCEV sales in 2018 [% of total vehicle 521310 1 12 1 17.15.34.3Average 2.01.0Change since 01/2018xx0.90.50.30.10.00.00.02017Sold units in thousandsSource: EV volumes, IHS, Roland Berger/Lazard20
Prerequisites for electric vehicles constantly getting better1The charging infrastructure for electrified cars is gradually gettingbetter – But still many countries have a long way to goInfrastructure: Charging infrastructure [charging stations per 100 km roadways]Jul -17 / Jul -19410.2401803
Global light vehicle production volume1) by region, 2014-2019e [m units] Source: IHS May/June 2019, Roland Berger/Lazard 1) Incl. light commercial vehicles; 2) CAGR 2014-2018; 3) Excluding CIS and Turkey; 4) Greater China Most recent expectations announced by many la