Transcription
Shiyovich et al. Israel Journal of Health Policy 2020) 9:6ORIGINAL RESEARCH ARTICLEOpen AccessTemporal trends in healthcare resourceutilization and costs following acutemyocardial infarctionArthur Shiyovich1,2* , Harel Gilutz3, Jonathan Eli Arbelle3,4, Dan Greenberg3 and Ygal Plakht3,5AbstractBackground: Acute myocardial infarction (AMI) is associated with greater utilization of healthcare resources andfinancial expenditure.Objectives: To evaluate temporal trends in healthcare resource utilization and costs following AMI throughout2003–2015.Methods: AMI patients who survived the first year following hospitalization in a tertiary medical center (SorokaUniversity Medical Center) throughout 2002–2012 were included and followed until 2015. Length of the in-hospitalstay (LOS), emergency department (ED), primary care, outpatient consulting clinic visits and other ambulatoryservices, and their costs, were evaluated and compared annually over time.Results: Overall 8047 patients qualified for the current study; mean age 65.0 (SD 13.6) years, 30.3% women.During follow-up, LOS and the number of primary care visits has decreased significantly. However, ED andconsultant visits as well as ambulatory-services utilization has increased. Total costs have decreased throughout thisperiod. Multivariate analysis, adjusted for potential confounders, showed as significant trend of decrease in LOS andambulatory-services utilization, yet an increase in ED visits with no change in total costs.Conclusions: Despite a decline in utilization of most healthcare services throughout the investigated decade,healthcare expenditure has not changed. Further evaluation of the cost-effectiveness of long-term resourceallocation following AMI is warranted. Nevertheless, we believe more intense ambulatory follow-up focusing onsecondary prevention and early detection, as well as high-quality outpatient chest pain unit are warranted.Keywords: Acute myocardial infarction; healthcare resource utilization, Costs, Temporal trendsIntroductionSurvivors of acute myocardial infarction (AMI) continueto be at greater risk and utilize more healthcare resources, resulting in increased economic burden [1–3].Moreover, expenditure throughout the first year following an AMI seems to be exceptionally high, estimatedbetween 22,000– 87,000 (European countries and theUnited States) [3–6]. Most aspects of AMI managementhave experienced dramatic changes throughout recentyears, including patient characteristics, presentation,* Correspondence: arthur.shiyovich@gmail.com1Department of Cardiology, Beilinson Hospital, Rabin Medical Center, RabinMedical Center, 39 Jabotinski Street, 49100 Petah Tikva, Israel2Sackler Faculty of Medicine, Tel Aviv University, Tel Aviv, IsraelFull list of author information is available at the end of the articleinvasive procedures, medical therapy, and outcomeswhich overall have improved significantly [1, 7]. However, data dealing with healthcare resource utilizationand expenditure are sparse and inconsistent [8, 9]. Theaim of the current study was to evaluate the temporaltrends in healthcare resource utilization and costsfollowing AMI.MethodsStudy populationThe current study included patients who survived thefirst year following hospitalization with an AMI (indexadmission) throughout 1.1.2002–31.12.2012 in SorokaUniversity Medical Center and who were members ofone of the two largest insurers in Israel (Health The Author(s). 2020 Open Access This article is distributed under the terms of the Creative Commons Attribution 4.0International License (http://creativecommons.org/licenses/by/4.0/), which permits unrestricted use, distribution, andreproduction in any medium, provided you give appropriate credit to the original author(s) and the source, provide a link tothe Creative Commons license, and indicate if changes were made. The Creative Commons Public Domain Dedication o/1.0/) applies to the data made available in this article, unless otherwise stated.
Shiyovich et al. Israel Journal of Health Policy Research(2020) 9:6Page 2 of 10Maintenance Organizations – HMOs): Maccabi Healthcare Services or (Maccabi) or Clalit Health Services(Clalit). For patients who suffered more than one AMIthroughout the investigated period, the first event wasconsidered as the index event.Soroka University Medical Center is a tertiary referralcenter ( 1200 beds), serving the metropolitan area ofBeer-Sheva, Negev, southern Israel. This region comprises approximately 60% of the area of Israel and isinhabited by more than 500,000 residents, Jews over60%. Thus, this hospital and its cardiology departmentface unique challenges: for example management ofacute myocardial infarction transferred after thrombolytic therapy in Eilat (the most southern city in Israel),while all other cardiology departments in Israel can provide primary PCI services for STEMI.The local ethics committees of the participatingorganizations approved the study, which was performedconsistently with the Helsinki declaration.target of complications. In this way, the diagnoses ofDM with renal manifestations were defined as renal diseases, the diagnoses of DM with peripheral circulationmanifestations were grouped with peripheral vasculardiseases. The remaining diagnoses of DM were assignedto DM with no recorded complications.Adherence with medical therapy for the followingguideline-recommended medications: Aspirin, statins,beta blockers and angiotensin-converting-enzyme inhibitors (ACEi) or Angiotensin II receptor blockers (ARBs).The adherence rate was calculated based on the issuedprescriptions during the first year following hospitaldischarge and calculated consistently with the well described proportion of days covered (PDC) parameter [11].Adherence (PDC) of 80% or more for all the evaluatedmedication groups was considered as adherent [12–15].Utilization of the various healthcare services were obtained from the records of the insurers. Per-patient costswere obtained for the year before the index admissionand for each year throughout the follow-up period thereafter. Costs were based on the rates set by the IsraeliMinistry of Health. Costs were obtained in local currency (Israeli Shekel – [ILS]) and converted to UnitedStates Dollar (USD) based on currency exchange rates (1ILS 0.29 USD, 04.01.2020). In this context it should bementioned, that primary clinic visits mainly refers to aphysician-patient encounter while ambulatory visit includes various ambulatory procedures (analyses or treatments) which are charged differently by the HMOs.Mortality data were obtained from the Ministry of theInterior Population Registry.Patient-level data from the records of the abovementioned authorities were linked through the individual personal identification number.Individual follow-up and study outcomesThe personal follow-up of the study participants began 1year after the index admission (i.e. 1 year survivors) andlasted up to10 years (or until the participant’s death).The follow-up period of the study ended in 31.12.2015.Evaluation of healthcare services utilization comprisedthe following: the length of in-hospital stay, all causes,number of emergency department (ED) visits not resulting in hospital admissions, number of primary care andoutpatient clinic visits and other ambulatory services(e.g. various ambulatory diagnostic or therapeutic procedures). In addition, the per-patient total cost was estimated by summing the costs of all the utilized services.Data sources and classificationsData were retrieved from the participating organizations’computerized medical records. The baseline data obtained from the hospitals’ database included patientcharacteristics clinical evaluation and management aspreviously reported for the Soroka Acute MyocardialInfarction (SAMI-II) project [10]. Most variables wereobtained using The International Classification of Diseases, Ninth Revision, Clinical Modification (ICD-9-CM)discharge codes (see Appendix for examples). Furthermore, the diagnosis of anemia was grouped togetherwith low hematocrit and low hemoglobin blood levels atdischarge as following: for men—hemoglobin 13 g/dLand hematocrit 39%; for women—hemoglobin 12 g/dL and hematocrit 36%. Similarly, the diagnosis ofrenal diseases included high creatinine blood levels (atdischarge) 1.2 mg/dL. The diagnosis of diabetes mellitus comprised high levels of Hemoglobin A1C (greaterthan 6.5%). Diagnoses of diabetes mellitus (DM) withcomplications were classified in accordance with theStatistical analysisStatistical analyses were performed with IBM SPSS Statistics 25 software. Baseline characteristics of the studycohort were presented as mean and standard deviation(SD) for continuous variables and n/percent for categorical data. Healthcare service utilization and their costswere calculated for every year throughout 2003–2015and are presented as mean and SD. Comparisons of theinvestigated outcomes between the years throughout thestudy period were performed using Analysis of variance(ANOVA) test for linear trend in the univariate level. Inaddition, generalized estimating equations (GEE) werebuilt separately for each investigated outcome, for thepurpose of controlling for repeated measures for eachpatient. Three level models for each outcome were built.The first level model (“unadjusted”) included the variableof the study year only. The second level model includedthe variable of the study year and the personal timefollowing the AMI (follow-up period). The third level
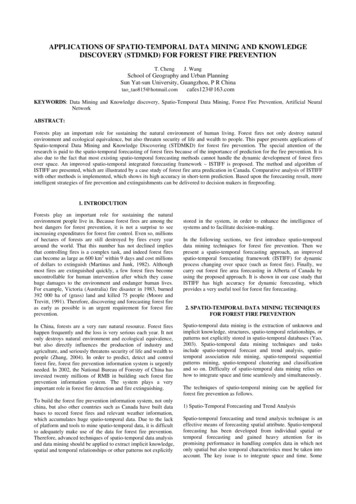
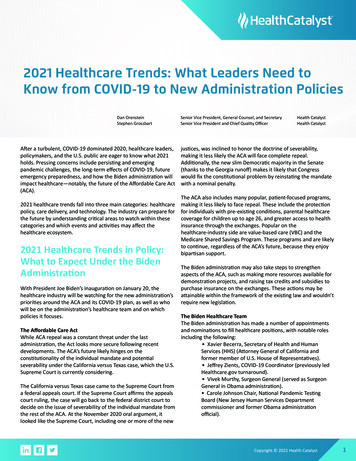
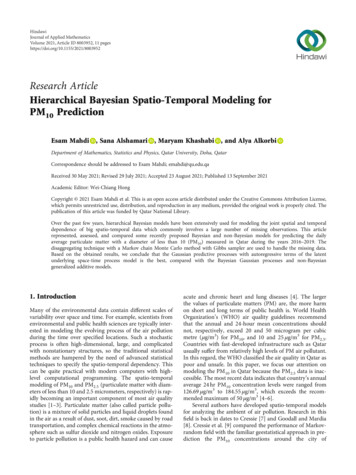
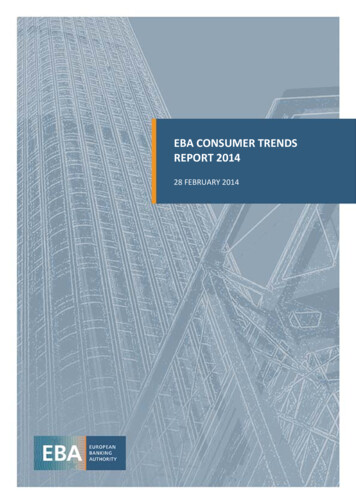
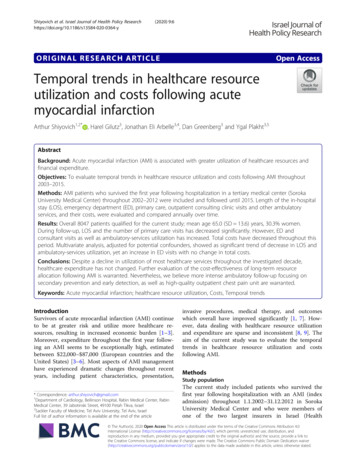
Shiyovich et al. Israel Journal of Health Policy Research(2020) 9:6Page 3 of 10model included all the above variables in addition to thepatients’ baseline characteristics, healthcare serviceutilization 1 year before AMI and adherence with medical therapy during the first year after AMI. The resultsof the models are presented as the coefficients (B) withStandard errors (SE) and 95% confidence intervals (CI).For each test, two-sided p 0.05 was consideredsignificant.adherence with medical therapy during the first yearafter AMI has improved significantly over time.ResultsBaseline characteristicsThroughout 2002–2012 a total of 12,535 patientswere admitted with an AMI and screened for thecurrent study. Overall 8047 patients qualified for thestudy (mean age 64.96 13.58), as the rest were excluded for the following reasons: 2293 (18.3%) werenot insured by the HMOs participating in the study,930 (8.9%) died during the index admission, amongstthe survivors of the index AMI an additional 1265(13.2%) died during the first follow-up year and thuswere excluded from the study. A flowchart displayingthe number of patients as well as inclusion and exclusion for each year is presented in Fig. 1. Baselinecharacteristics of the patients by study year are presented in Table 1.Throughout the later study years, patients’ age waslower and the rate of male patients was greater compared with earlier years. The prevalence of most traditional cardiovascular risk factors increased (exceptdiabetes mellitus) while the prevalence of most other investigated comorbidities decreased over time. Throughout the later period the rates of STEMI - ST segmentelevation myocardial infarction (STEMI) and of 3-vesselor left main coronary artery disease decreased as well.However, the rate of invasive treatments (Percutaneouscoronary intervention or/and Coronary artery bypasssurgery [PCI/CABG]) has increased. The rate ofFig. 1 The study flowchart: number of patients by the study yearTrend of healthcare resources utilization and costs afterAMIHealthcare resource utilization and costs by study yearare displayed in Fig. 2. Throughout the investigated decade the mean length of in-hospital stay and the numberof primary care visits decreased significantly (6.65 days2003 vs. 1.63 days 2015 and 15.6 vs. 11.1 respectively; pfor trend 0.001 for each). During the same period, themean number of ED visits, consultant visits and ambulatory visits increased significantly (0.03 vs. 0.34, p fortrend 0.001; 1.2 vs. 1.5, p for trend 0.001; 6.2 vs. 9.0,p for trend 0.005 respectively). Mean total costs decreased throughout the investigated period (4579 vs.3018 USD, p for trend 0.001).Multivariable analysisThe results of the multivariable models for each investigated outcome are presented in Table 2. The first levelmodels (“unadjusted”) show an increased number of ED,ambulatory and consulting clinic visits, while the yearlylength of hospital stay, number of primary care visitsand the annual total cost decreased during the studyperiod. The second level model, adjusting for time following AMI, shows an increase in the number of EDvisits and a decrease in all other parameters. Finally, thethird level model which included all variables in additionto patients’ baseline characteristics, healthcare serviceutilization 1 year before AMI and adherence with medical therapy during the first year after AMI, shows a significant decrease in the length of hospital stay, primarycare visits and consultant visits, while the yearly numberof ED visits has increased and no significant change wasobserved in the ambulatory visits. No statistically significant difference was found in the adjusted total costs inthe third level model.
Shiyovich et al. Israel Journal of Health Policy Research(2020) 9:6Page 4 of 10Table 1 The baseline characteristics of the study population by study 565052232115p fortrendDemographicsAge at AMI, years;Mean (SD)64.20 64.09 63.76 63.40 63.06 63.02 62.68 62.44 62.23 62.09 61.99 61.78 60.79 0.001(12.97) (12.96) (12.88) (12.84) (12.72) (12.88) (12.94) (12.93) (12.95) (13.00) (13.01) (12.97) (12.74)Sex, 2)4165(73.7)3886(74.4)1579(74.7) 3.8)1367(24.2)1310(25.1)515(24.3) .8)486(9.3)172(8.1) 0.001Pulmonary 4205(83.0)4565(83.3)4761(84.3)4447(85.1)1820(86.1) 0.001AV 3.0)0.092Renal 7.3)1447(25.6)1296(24.8)504(23.8) 0.001Diabetes 70(73.8)3871(74.1)1563(73.9) 414(25.0)1302(24.9)553(26.1) 524(46.0)2616(46.3)2451(46.9)1030(48.7) .4)416(8.0)164(7.8) 0.001Family history of 7(11.2) .5)87(4.1) 670(47.3)2440(46.7)944(44.6)0.530GI bleeding6 phrenia/Psychosis5 )121(2.3)43(2.0)0.430Cardiac diseasesCardiovascular risk factorsOther disordersAdministrative characteristics of the hospitalization
Shiyovich et al. Israel Journal of Health Policy Research(2020) 9:6Page 5 of 10Table 1 The baseline characteristics of the study population by study year 3(78.2)4264(77.8)4401(77.9)4101(78.5)1707(80.7) 0.001Length of hospital stay 232(days), 46.0)2339(44.8)909(43.0) 0.001Type of AMI, .0)2966(52.5)2722(52.1)1130(53.4) 1904(90.0) 0.001Severe 46(7.5)117(6.1) 0.001LV .2)65(3.4) 0.001Mitral 9.7)4418(80.6)4646(82.2)4362(83.5)1774(83.9) 0.001Measure of CAD, Noor 6(5.0)75(4.2) 0.001One 7(27.5)1236(28.3)534(30.1) 0.001 0.001Two 325(28.5)1262(28.9)506(28.5)Three vessels/ 4(38.8)1648(37.8)659(37.1)Type of ansposedto ICCUp fortrendResults of echocardiographyPulmonary hypertensionResults of angiography 0.001Healthcare utilization an year before AMI; Mean (SD)HospitalizationsLOS, days4.28(7.74)4.61(9.79)4.474.38(10.45) 8.34)3.27(8.02)3.03(7.90)2.8(7.76)2.82(8.27) 0.001Number of ED (0.52)0.13(0.49)0.16(0.55)0.12(0.47) 0.001Number of primaryclinic (9.85)10.03 10.23 10.37 10.48(10.06) (10.12) (10.14) (10.2)10.50 10.72(10.16) (9.97)10.76(9.91)10.41(9.90) 0.001Number of ambulatory 5.18clinic visits(8.52)5.153.83(10.64) (8.60)4.795.395.926.126.596.866.836.646.706.61 0.001(10.86) (12.00) (12.39) (12.00) (14.07) (14.96) (14.51) (13.27) (13.08) (12.45)Number of consultingclinic (1.95)1.06(1.96)1.06(1.93)1.05(2.02) 0.001Total cost, )529(25.0) 0.001Follow-upFull adherence tomedical treatment
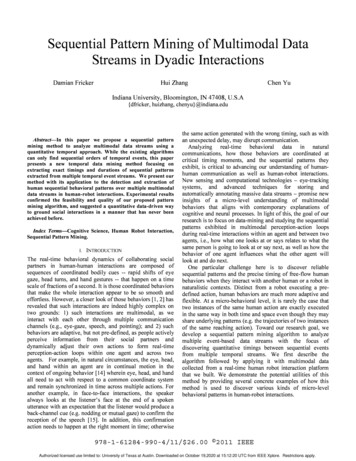
Shiyovich et al. Israel Journal of Health Policy Research(2020) 9:6Page 6 of 10Table 1 The baseline characteristics of the study population by study year 0675482565052232115p fortrendduring the 1st yearAge in the presentyear, years; Mean (SD)64.20 64.74 65.00 65.11 65.23 65.64 65.77 66.00 66.27 66.55 66.65 66.69 67.40 0.001(12.97) (12.95) (12.88) (12.84) (12.71) (12.82) (12.88) (12.85) (12.84) (12.83) (12.83) (12.86) (12.64)Period since AMI,years; Mean )5.14(2.87)5.37(2.75)6.68(2.53) 0.001The data are presented as n (%) unless otherwise stated. Dyslipidemia is defined as recorded diagnosis of dyslipidemia and/or average LDL level 130 mg/dLduring the hospitalization. Anemia is defined as recorded diagnosis of anemia and/or hemoglobin level 14 g/dL or hematocrit level 42% for males andhemoglobin level 12 g/dL or hematocrit level 37% for females during a hospitalizationAbbreviations: AMI Acute myocardial infarction; AV Atrioventricular; CABG Coronary artery bypass surgery; CAD Coronary artery disease; CHF Congestive heartfailure; CIHD Chronic ischemic heart disease; COPD Chronic obstructive pulmonary disease; ED emergency department; GI Gastro-intestinal; ICCU Intensive CardiacCare Unit; IHD Ischemic heart disease; LOS length of (hospital) stay; LM Left main (artery); LV Left ventricular; PCI Percutaneous coronary intervention; PVDPeripheral vascular disease; SD standard deviation; STEMI ST segment elevation myocardial infarction; USD United States DollarsDiscussionThe current study investigated temporal trends inhealthcare resource utilization throughout more than adecade (2003–2015) among post-AMI patients. Mainfindings include: throughout the investigated periodutilization of most health-care resources, particularly thelength of hospital stay and primary clinic visits havedecreased. However, a major increase in ED visits wasobserved. The unadjusted healthcare expenditure has decreased throughout the study period. When this analysisis adjusted for potential confounders no statistically significant change in total cost was observed.It has been widely described that AMI survivors areprone to increased morbidity (compared to matchedgeneral population), healthcare services utilization andeconomic burden which seem to be exceptionally highthroughout the first year after the AMI followed bysome subsequent decline [2–5, 16]. We found asignificant attenuation in the length of hospitalizationsand ambulatory services utilization throughout the lastdecade yet an increase in the rate of ED visits and nochange in total cost. This finding is consistent with thefindings of Chen et al. [17] that showed a decrease inhospitalization of AMI patients (for heart failure) inMedicare beneficiaries 1998–2010 and with those ofChaudhry et al. [18] who reported a decline in the rateof recurrent AMI hospitalization between 1999 and2000. Likosky et al. [9],who investigated readmission ratewithin the first year following AMI, found no differencethroughout 1998–2008. Importantly, our analysis includes all hospitalizations rather than those for a particular cause, while previous reports showed that about30% of readmissions are for reasons unrelated to the original condition [19]. In partial consistency with our findings, a recent report from the US found significantdifferences across the country and between differentFig. 2 Trends of healthcare resources utilization and costs during the study period, by study year. a Length of hospital stay (days). b Number ofhospital emergency department (ED) visits (with no hospital admission). c Number of primary clinic visits. d Number of ambulatory visits. eNumber of consultant visits. f Total cost (United States Dollars - USD)
Shiyovich et al. Israel Journal of Health Policy Research(2020) 9:6Page 7 of 10Table 2 Trends of healthcare resources utilization and costs – multivariate analysisDependent variableModel LevelaB (SE)c95% CI (B)Length of hospital stay (days per patient-year)1 0.075 (0.008)( 0.091; 0.060) 0.0012 0.155 (0.009)( 0.172; 0.137) 0.001ED visits (number of visits per patient-year)bPrimary clinic visits (number of visits per patient-year)Ambulatory visits (number of visits per patient-year)Consultant visits (number of visits per patient-year)Total cost (USD per patient-year)p3 0.142 (0.030)( 0.201; 0.083) 0.00110.276 (0.009)(0.259; 0.293) 0.00120.277 (0.021)(0.236; 0.318) 0.00130.289 (0.014)(0.262; 0.317) 0.0011 0.358 (0.026)( 0.409; 0.307) 0.0012 0.696 (0.026)( 0.746; 0.645) 0.0013 0.612 (0.025)( 0.661; 0.563) 0.00110.009 (0.004)(0.001; 0.018)0.0332 0.012 (0.005)( 0.021; 0.003)0.00830.008 (0.005)( 0.001; 0.016)0.09110.015 (0.003)(0.008; 0.021) 0.0012 0.026 (0.004)( 0.034; 0.019) 0.0013 0.025 (0.004)( 0.033; 0.017) 0.0011 0.015 (0.005)( 0.025; 0.006)0.0012 0.050 (0.006)( 0.061; 0.040) 0.0013 0.005 (0.011)( 0.027; 0.016)0.627The first level models – unadjusted. The second level models - adjusted for the time following the Acute myocardial infarction (AMI). The third level models adjusted for the time following the AMI, age (at the evaluated year), sex, nationality, utilization / cost during an year before AMI, adherence to medical treatmentduring the 1st year, type of AMI, type of treatment and comorbidities (renal diseases, diabetes mellitus, neurological disorders, anemia, supraventriculararrhythmias, Congestive heart failure, Chronic obstructive pulmonary disease and Alcohol/drug addictionbEmergency department (ED) visits with no hospital admissioncBeta coefficient represents the degree of change in the outcome variable for every 1-unit of change in the predictor variable i.e. for every increase of 1 yearthroughout the follow-up period (e.g. 2003–2004 or 2014–2015) the LOS / cost differed by B units (day / USD), on averageAbbreviations: B regression coefficient; CI confidence interval; SE standard error; USD United States Dollarsaservices, in ambulatory and outpatient resourceutilization and expenditure following hospital dischargewith an AMI (31–180 days) between 1999 and 2014 [20].The current study was not designed to determine thecauses for the observed time dependent changes. However, several reasons can be suggested to explain thedecline in hospitalizations and primary medicine servicesutilization. First and foremost, introduction of evidencebased treatments in the acute phase management incorporated into AMI guidelines, improvements in thetimeliness, and in particularly the use of invasive revascularization treatments as also observed in the current study[21, 22]. Furthermore, significant improvements have beenreported in secondary prevention treatments and post discharge management including control of risk factors, theuse of guideline recommended medications and rehabilitation [18, 23]. Improved post-discharge adherence withguideline recommended therapies, as observed in thecurrent study, is also an important factor which has previously been reported to be associated with reduced healthcare resources utilization [14]. It should be mentionedthat individual long-term healthcare resource utilizationtends to decrease after the first year post AMI [16].However, this individual decline does not seem to be aprominent explanation for the observed trend in thecurrent study, since an adjustment for the time from theindex AMI (the second level models) was performed.A trend of increase in ED visits was observed throughoutthe years, consistent with previous reports [20]. This disparity in the trends of ED utilization and the other resourcescould possibly be attributed to increased awareness andcaution by the AMI survivors and their healthcare providers to complaints that could be related to an acute cardiac condition. Alternatively insufficient availability of outof-hospital services could all also cause increased frequencyof ED visits [24]. Furthermore, the exceptionally greater increase in the ED visits overtime should be a focus of furtherinvestigation and intervention; for example, dedicated highquality out of hospital services with utilization of high sensitivity troponin point-of-care essays or the establishment ofchest pain unit for such patient. In addition, a trend of increased age, increased prevalence of cardiovascular risk factors and other comorbidity were reported among AMIpatients. The latter trends could counter-balance a trend ofreduction and support a trend of increase in healthcare resources (e.g. ED visits) utilization [25, 26].
Shiyovich et al. Israel Journal of Health Policy Research(2020) 9:6Page 8 of 10Total annual healthcare expenditure found in thisstudy is lower than that reported in other studies [9–12].This disagreement is probably due to differences inhealthcare and insurance systems and the methodologyfor estimating healthcare expenditure. The unadjusted(the first level model) and the adjusted to time fromAMI (the second level model), total cost has shown asignificant trend of decrease throug
Trend of healthcare resources utilization and costs after AMI Healthcare resource utilization and costs by study year are displayed in Fig. 2. Throughout the investigated dec-ade the mean length of in-hospital stay and the number of primary care visits decreased significantly (6.65days 2003 vs. 1.63days 2015 and 15.6 vs. 11.1 respectively; p