Transcription
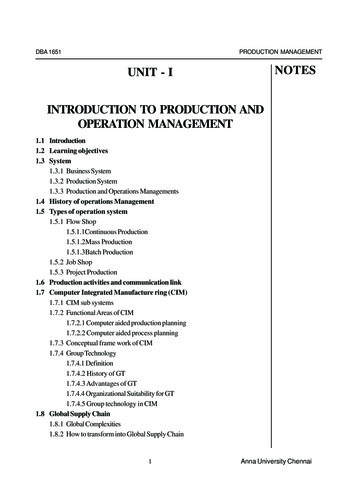
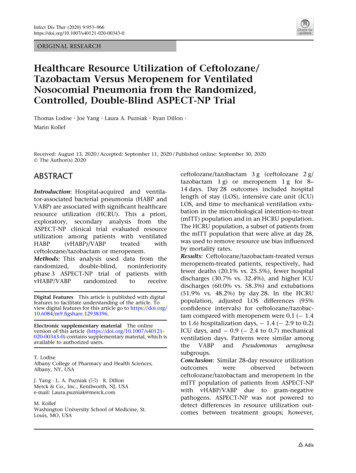
Industrial Production and Capacity Utilization:Historical Revision and Recent DevelopmentsCarol Corrado, Charles Gilbert, and RichardRaddock, of the Board’s Division of Research andStatistics, prepared this article. Carly Kudon provided research assistance.The Board of Governors of the Federal Reserve System has completed a revision of its measures ofoutput, capacity, and capacity utilization for theindustrial sector. The primary feature of the revisionis a new formulation for aggregating the indexes andutilization rates using weights that are updated annually rather than every five years. The new formulation has been used to revise the output, capacity, andutilization rates back to 1977. It provides more accurate current estimates of developments in industrialproduction and capacity utilization and eliminates anearlier, small overstatement of the growth trends ofproduction and capacity.For 1992 and thereafter, the 264 individual industrial production (IP) series also incorporate additionalor updated statistics that are typically available for anannual revision. Moreover, we added or alteredeleven production series to improve their marketclassification, coverage, and reliability; some of theseimprovements were made to pre-1992 figures,depending on the availability of source data.The industrial capacity indexes were reestimatedfrom 1977 onward to be consistent with the revisedIP series and updated measures of manufacturers’capital input. The revisions to both production andcapacity indexes are, of course, reflected in the utilization ratio. Some additional small changes to aggregate capacity utilization rates were made from 1976back to 1967 to improve their consistency with thenew formulation.Besides the reformulation of aggregates, the annualupdating of all measures, and the improvement ofselected series, the revised production and capacityindexes are now expressed as percentages of outputin 1992. This rebasing affects all series from theirNote. Other contributors to the revision and to this article includethe following: Ana Aizcorbe, William Cleveland, ChristopherFurgiuele, Michael Mohr, Cora Moyers, Gerald Storch, and DixonTranum.start date, which is 1919 for total IP, 1948 for manufacturing capacity, and 1967 for total industrial capacity. The Federal Reserve’s accompanying statisticsfor industrial electric power use, which begin in1972, have also been rebased and revised to incorporate previously unavailable data.REVISIONS TO OUTPUT, CAPACITY, ANDUTILIZATIONThe revised indexes of industrial production andcapacity show slower growth, on average, than theearlier estimates, whereas the cyclical patterns of therevised measures are nearly the same as before(chart 1). Both from 1977 to 1987 and from 1987 to1.Industrial production, capacity, and utilization, 1967–96Ratio scale, 1992 output t of 2Note. Seasonally adjusted monthly data through December 1996.1996
681.Federal Reserve BulletinFebruary 1997Revised growth rates of industrial production and capacity, and level of capacity utilization, 1967–96Difference between revised and earlier growth rates(percentage points)Revised growth rate(percent)ItemDue to the –871987–961977–871987–96ProductionTotal industrial . . . . . . . . . . . . . . . . . . . . . .Manufacturing . . . . . . . . . . . . . . . . . . . .Excluding computers . . . . . . . . . . .3.33.43.22.32.72.22.32.52.1 .3 .5.1 .2 .3 .1 .3 .5 .1 .2 .3 .1CapacityTotal industrial . . . . . . . . . . . . . . . . . . . . . .Manufacturing . . . . . . . . . . . . . . . . . . . .Excluding computers . . . . . . . . . . .3.53.63.52.42.82.22.22.52.2 .2 .5.1 .2 .3 .1 .4 .6 .1 .1 .2 .1Capacity utilization(level, end of period)Total industrial . . . . . . . . . . . . . . . . . . . . . .Manufacturing . . . . . . . . . . . . . . . . . . . .Excluding computers . . . . . . . . . . .83.983.383.382.782.782.983.282.282.0 .1 .2 .1 .2 .1.5 .1 .2 .2 .7 .7 .4Note. Growth rates are calculated as the average percentage change in theseasonally adjusted index from the fourth quarter of the first year specified to thefourth quarter of the last year specified. For 1967 the calculations begin in thethird quarter, and for 1996 the calculations in the last column end in the secondquarter. The capacity utilization rates are for the fourth quarter of the last yearspecified.1996, total industrial output grew at an average paceof about 2.3 percent per year—about 1 4 percentagepoint less than previously estimated (table 1). Thegrowth of industrial capacity was revised downnearly as much; consequently, the rate of total industrial capacity utilization was revised down only afraction of a percentage point at the end of 1996. (Seethe summary tables in appendix A for details of therevised indexes.)The downward revisions to production and capacity growth arise primarily from the introduction ofthe new formulation for those measures, which tendsto reduce the influence of the fastest growingindustries—such as computers—on aggregategrowth. In particular, although the revised output andcapacity indexes now show slower growth for totalmanufacturing, growth in manufacturing excludingcomputers is reduced only a bit as a result of introducing the new formulation (table 1).The revisions for 1992-96 not only incorporate thenew annual weighting formulation but also updatesource data. In particular, data from the Annual Survey of Manufactures of the Bureau of the Censusaccount for most of the reduction of 1 percentagepoint in the growth in manufacturing output in 1994(table 2). Since 1992, growth in manufacturing hasaveraged 3.8 percent a year, down 0.5 percentagepoint from the earlier estimates.The largest revisions of the production indexes bymarket group—upward in consumer durable goodsand downward in business equipment—relate to thetreatment of computers; the downward revision in2.Revised growth rates of industrial production and capacity, and level of capacity utilization, 1992–96Revised growth rate(percent)ItemDifference between revised and earlier growth rates(percentage roductionTotal industrial . . . . . . . . . . . . . . . . . . . . . .Manufacturing . . . . . . . . . . . . . . . . . . . .Excluding computers . . . . . . . . . . .3.53.83.25.76.56.01.81.6.73.74.03.1 .4 .5 .2 .9 1.0 .9.2.2.5 .8 .8 .1CapacityTotal industrial . . . . . . . . . . . . . . . . . . . . . .Manufacturing . . . . . . . . . . . . . . . . . . . .Excluding computers . . . . . . . . . . .2.83.12.62.52.72.33.33.73.13.74.13.3 .4 .5 .3 .3 .5 .3 .5 .6 .4 .3 .4 .1Capacity utilization(level, end of period)Total industrial . . . . . . . . . . . . . . . . . . . . . .Manufacturing . . . . . . . . . . . . . . . . . . . .Excluding computers . . . . . . . . . . . . . . . . .84.383.983.983.182.382.183.282.282.0. . . . . . . .4 .4 .2.2.2.5 .2 .1.5Note. Growth rates for 1992 to 1996 are calculated as the average percentage change in the seasonally adjusted index from the fourth quarter of 1992 tothe fourth quarter of 1996. Growth rates for years are calculated from the fourthquarter of the previous year to the fourth quarter of the year specified. Thecapacity utilization rates are for the last quarter of the year.
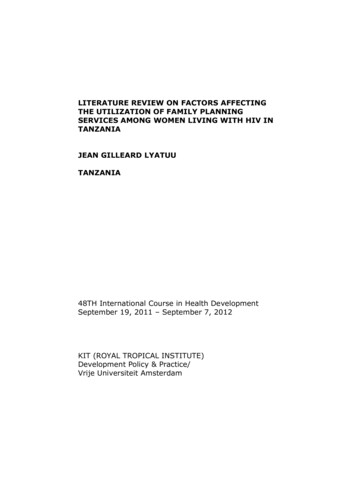
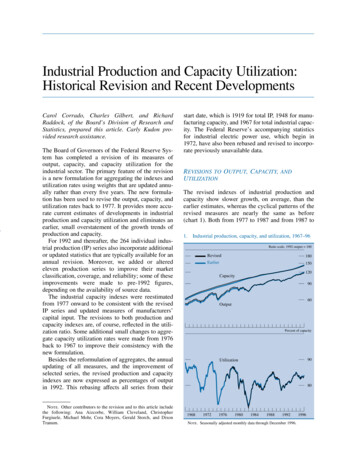
Industrial Production and Capacity Utilization: Historical Revision and Recent Developmentsequipment reflects both the new formulation and thereassignment of a portion of computer output (mainlypersonal computers for home use) from businessequipment to consumer durable goods other thanautomotive products (tables A.3 and A.5). Amongmajor industry groups, the large upward revisions insemiconductors and electrical machinery relate to theuse of quality-adjusted price indexes for semiconductor components to develop new annual productionbenchmarks (tables A.4 and A.6).The slower overall trend growth in production isreflected in the lower trend growth in the revisedestimate of manufacturing capacity, which is also0.5 percentage point below the earlier estimate forthe period from 1992 to 1996. (The effect of revisionsof the production indexes on our capacity indexes isdescribed in the section on methods.) The rate ofmanufacturing capacity utilization—the ratio of production to capacity—in the fourth quarter of 1996 isonly 0.1 percentage point lower than the earlier estimate. Like the earlier estimates, the revised onesshow that capacity utilization reached its most recenthigh at the beginning of 1995 and that pressures onindustrial capacity have been lower since then.Revisions to utilization rates are quite disparateamong industries (table A.7). Substantial upwardrevisions in utilization in the fourth quarter of 1996for miscellaneous manufacturing, apparel, aerospace and miscellaneous transportation equipment,and electrical machinery including semiconductorslargely counterbalance the downward impact on utilization of the new annual weighting formulation andlower utilization rates for motor vehicles and parts,computers, and other industries.INDUSTRIAL DEVELOPMENTS IN THE 1990SThe industrial sector entered the 1990s operating at ahigh level. Then, following the spike in oil prices thataccompanied Iraq’s invasion of Kuwait in August1989, a rather shallow six-month contraction ensued.Output of durable manufactured goods fell 7 percentto a trough in March 1991 and then surpassed itsprevious peak in the fourth quarter of 1992, withthe completion of the gradual recovery from thecontraction.During the four years since then, the industrialsector, led by gains in durable manufacturing, hascontinued to expand, with only a six-month pauseafter January 1995. During this expansion phase,output in durable manufacturing advanced at anannual rate of 6 percent; output at utilities, roughly21 2 percent; nondurable manufacturing, 11 2 percent;69and mining, 1 percent (table A.6). Despite the continuing expansion, productivity advances and theincreased use of temporary employees have limitedthe hiring of permanent employees in industry.Employees on manufacturing payrolls numbered18.3 million at the end of 1996, up only 200,000since 1992 and down 1 million since the late 1980s.Employment in nondurable manufacturing, whereproduction growth had been slow, declined in 1995and 1996.Production in the 1990s by Market GroupThe output of durable consumer goods helped fuelthe recovery and expansion from the 1991 troughuntil 1994, with strong gains in light trucks, automobiles, appliances, and personal computers (chart 2and table A.5). Since then, real output of home computing equipment, adjusted for quality improvements,has risen more than 30 percent per year, while outputof consumer durables other than personal computershas flattened noticeably.Assemblies of autos and light trucks hit a cyclicallow in early 1991, climbed at a double-digit ratethrough early 1994, and then essentially flattened.Domestic assemblies of light vehicles averaged about11.7 million units annually from 1994 to 1996, whiletotal sales, including imports, averaged nearly 15 million units.Underlying the overall trend in U.S. production oflight vehicles during the past decade were severalimportant developments: the growth of U.S. assemblyplants owned by Japanese manufacturers (transplants), which substantially cut imports of vehicles;quality improvements that made American-built vehicles more competitive; and the shift in the composition of overall output to light trucks, especially sportutility vehicles. Assemblies of light trucks in theUnited States, which averaged 33 4 million units inthe late 1980s, reached 51 2 million in the second halfof 1996; in contrast, automobile production hastrended down from 8 million units in 1985–86 to justover 6 million units last year—despite the growth oftransplants.In contrast to the substantial growth in the outputof consumer durables during the 1990s, the production of consumer nondurables grew at an annualrate of only about 11 2 percent. Significant disparitiesin growth rates are apparent among the componentsof this group. Newspaper circulation trended gradually downward. Production of clothing fell aboutone-tenth in 1995 and early 1996 to a level near therecession low of 1990–91. Foods and tobacco grew
702.Federal Reserve BulletinFebruary 1997Industrial production by market groups, 1987–96Index, 1992 100, ratio scaleConsumer goods130Index, 1992 100, ratio scaleIntermediate products130120120110110Construction suppliesDurable100100Business suppliesNondurable90Equipment130Defense and space90Industrial materials130120110120Nondurable goods and energy110Business10090100Durable 6Note. Seasonally adjusted monthly data through December 1996.slowly overall. But production of drugs and medicines and output of paper products for the homeexhibited strong growth.The business equipment group lagged the cyclicalimprovement in overall IP but has been a majorsource of strength since early 1992. Led by a doubledigit annual rate of growth in the output index forinformation processing and related equipment, theoutput of business equipment advanced more thanone-third through the end of 1996. The qualityadjusted output of computers nearly quadrupled overthe period and accounted for more than one-thirdof the growth in business equipment. Excluding computers, output of business equipment grew about25 percent.Growth in the industrial equipment group wasstrong from early 1992 to mid-1995 and then flattened at a level that exceeded its 1989 cyclical peakby about 15 percent; however, the output of construction equipment—the fastest growing component—continued to rise in the second half of 1995 and 1996.The output of the ‘‘other equipment’’ group, whichincludes farm and service industry equipment andoffice furniture, also grew rapidly in 1993 and 1994and then paused before rising in the latter half of1996 to a level about one-tenth above that precedingthe last recession.Of the major subgroups within business equipment, only transit equipment exhibited practically nonet production growth from 1991 to early 1996 asassemblies of business autos stagnated and the outputof commercial aircraft and parts dropped sharply,particularly in 1993. Demand for business trucksstrengthened considerably early in the expansion, butthen in late 1995 and 1996, assemblies of heavytrucks and trailers weakened significantly. The outputof transit equipment eventually pushed to new highs,but not until 1996, with the strong recovery in production of commercial aircraft and parts.The reductions in real federal investment indefense and space equipment have cut the productionindex for such equipment, which includes militaryaircraft and parts, about one-third since mid-1989.The decline, which was quite rapid from 1991through 1995, is estimated to have eased in 1996.The output of construction supplies, which droppedmore than one-tenth during the 1990–91 recession,did not recover to prerecession levels until late 1993and early 1994. The recovery was slowed by highvacancy rates and the related weakness in the construction of multifamily residential buildings andnonresidential structures, particularly office andindustrial buildings, that persisted into 1993. In contrast, single-family starts recovered much sooner and
Industrial Production and Capacity Utilization: Historical Revision and Recent Developmentsmore robustly. From the end of 1993 through late1996, the output of construction supplies advanced atan average annual rate of roughly 4 percent, despite adecline in the first half of 1995 that was correlatedwith a dip in housing starts.The output of business supplies grew slowly in the1990s. Although commercial and other sales of electric and gas utilities expanded solidly, output of paperbusiness supplies and agricultural chemicals grewhardly at all, and newspaper advertising trendedsharply downward.In the 1990s, the production of materials for further industrial processing grew more rapidly than theoutput of finished goods. Producers of industrialmaterials comprise a large, diverse group thataccounts for roughly 40 percent of total industrialproduction. Durable goods materials, such as steel,turbines, semiconductors, and parts used in computers, motor vehicles, and aircraft, account for morethan half of industrial materials. The output ofdurable goods materials has increased more than40 percent since the beginning of the decade. Notsurprisingly, computer parts and semiconductors ledthe advance with double-digit annual growth rates.The strength in the output of durable goods materialswas supported by gains since the 1990–91 recessionin the output of steel, motors, and other parts used tomake motor vehicles, appliances, and heavy equipment. However, the weakness in the aerospace industry was a restraining influence until recently.In comparison with the gains in durable goodsindustries, the growth in the production of nondurable goods materials and energy materials was anemic.The downtrend in crude oil production, particularlyin Texas and Alaska, tended to offset recent gains inthe production and use of natural gas and coal.Declines in the production of residual fuel oil, nuclearmaterials, and coke similarly offset a moderate rate ofincrease in the generation of electricity. Within nondurable goods materials, growth in textile, paper, andchemical materials was quite slow on balance fromearly 1989 until the third quarter of 1993 and thengrew strongly for a time, only to fall back in 1995.From the start of the decade through late 1996, theoutput of this group grew at an annual rate of only11 2 percent. In this group, plastics resins, syntheticrubber, and paperboard were relatively strongperformers.Capacity and Utilization in the 1990sSo far in the 1990s, the rate of capacity utilization intotal industry has reached neither the extreme highsnor the extreme lows of the 1970s and 1980s. This71moderation reflects an acceleration in the growth ofcapacity as well as the relatively mild industrialrecession at the start of the decade and the temperatepace of the expansion that has lasted nearly six years.An acceleration in the growth of capacity in recentyears has accommodated this lengthy expansion without signs of substantial pressures on productivecapacity. The low in utilization, 78.1 percent,occurred at the production trough in early 1991 andwas well above the previous low of 71.1 percent inlate 1982. Over the years of expansion after 1991,utilization reached a high of 84.9 percent in late 1994and early 1995 (table A.1). Although this level wasnear the high recorded in the late 1980s, it wasnoticeably below the cyclical highs of the 1970s.Utilization eased in 1995 and ended 1996 at about831 2 percent—still more than a percentage pointabove the long-term average.Within manufacturing, utilization rates in late 1996were relatively high for industrial machinery andequipment, especially computers, and for a numberof primary-processing industries including petroleumrefining, rubber and plastics products, fabricatedmetal products, and primary metals, such as steel(table A.7). By contrast, apparel products, printingand publishing, and leather and products had utilization rates that were below their longer-run averages.As the current expansion has continued, realinvestment expenditures for industrial plant andequipment have increased rapidly and contributed toa faster rate of growth of capacity. The annual rate ofgrowth of manufacturing capacity roughly doubled,from approximately 2 percent early in the decade tomore than 4 percent in 1996; in durable manufacturing, capacity growth tripled to more than 6 percent(table A.8). High and rising rates of growth of capacity were, of course, most evident for computers andsemiconductors, but the acceleration was large evenfor more slowly growing industries such as steel,fabricated metals, and lumber. Growth in capacity innondurable manufacturing has remained low.In mining, the long-term decline in capacity moderated as the drop in available drilling rigs, whichbegan in 1983, lessened substantially. Utilization inoil and gas well drilling, although far below earlierpeaks, rose to its highest level since 1982. Recentincreases in offshore drilling also helped to maintainreserves and offset the ongoing decline in oil and gasextraction from aging oil fields. Capacity growth inthe rest of mining and in utilities was relativelymodest. Output growth at utilities exceeded capacitygrowth over the past ten years; as a result, the excesscapacity that developed after the energy shocks inthe 1970s and early 1980s has essentially beeneliminated.
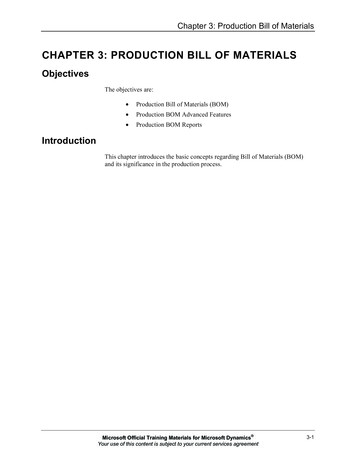
72Federal Reserve BulletinFebruary 1997NEW AGGREGATION METHODSAs indicated, the most important improvement forthis revision is the introduction of new aggregationmethods from 1977 onward. As before, the contribution of an individual industry to total output or capacity is based on the value added by that industry. Now,however, we update the value-added weights annually, rather than quinquennially, and keep them concurrent with production. The aggregation method forIP, a version of the Fisher-ideal index formula, ismore firmly rooted in economic theory and eliminates a source of upward bias in the previous estimates. Some of the same issues are addressed in therecent reformulation of the featured measure of realoutput published by the U.S. Department of Commerce’s Bureau of Economic Analysis (BEA).1Measures of industrial output can be distorted ifthe relative valuations of the component series areout of date by even a few years. In order to minimizethis bias, for the revised production index, annualweights are estimated through the most currentperiods even though comprehensive data on valueadded lag a few years. These estimates are developedfrom related information on producer prices or, ifrequired, by statistical extrapolation.The aggregation of capacity and capacity utilization is accomplished by a generalization of themethod introduced in the 1990 revision of thoseseries. The approach is discussed more fully in theaccompanying box, ‘‘Aggregation of Industrial Production and Capacity Utilization—A TechnicalNote,’’ which presents the algebraic formulations ofthe new industrial production and capacity utilizationmeasures.3.Proportion of computer output in industrial 8198419901996To represent the changing relative price and coststructure of industries, the industrial production indexwas previously built, for the most part, in five-yearchronological segments, each with value-addedweights drawn from the first year of the segment—the year of the quinquennial Census of Manufactures,the underlying data source for value added. Chainingthe segments together formed a continuous indexexpressed as a percentage of output in a referenceyear. Although the periodic introduction of newweight years ensured that the IP index reflected theevolution of relative prices over time, the weights ofvery fast growing industries, such as computers,became outdated quickly and caused output growthto be overstated.In general, a measure of real output based onrelative prices of a more recent year increases lessrapidly than a measure based on relative prices of anearlier year. This characteristic result, which has longbeen observed in the construction of index numbers,exists because the goods for which output growsrapidly tend to be those that are characterized bydeclining relative prices and production costs.2 Economic theory suggests that the preferred measure ofoutput growth between two periods is a geometricaverage of two indexes: one weighted according tothe relative price structure of the earlier period andthe second weighted according to the relative pricestructure of the later period. This result is called aFisher-ideal index. Quantity measures derived asFisher-ideal indexes usually grow more slowly thanquantity measures derived using just the earlier period’s prices as weights. Even though the previous IPindex used a progression of valuation periods, it stilloverstated output growth because it used prices of agiven year to weight quantities for some number ofsubsequent years.An example of how this bias was manifested in theearlier index is illustrated by the pattern of the proportion of computer output in industrial production(chart 3). During the interval between the censuses,1. See J. Steven Landefeld and Robert P. Parker (with Jack E.Triplett), ‘‘Preview of the Comprehensive Revision of the NationalIncome and Product Accounts: BEA’s New Featured Measures ofOutput and Prices,’’ Survey of Current Business, vol. 75 (July 1995),pp. 31–38, and the references contained therein.2. For example, see the discussion and results of the use of alternative weight years for industrial production in Kenneth Armitage andDixon A. Tranum, ‘‘Industrial Production: 1989 Developments andHistorical Revision,’’ Federal Reserve Bulletin, vol. 76 (April 1990),pp. 188–204 (especially pp. 201–03).Industrial Production
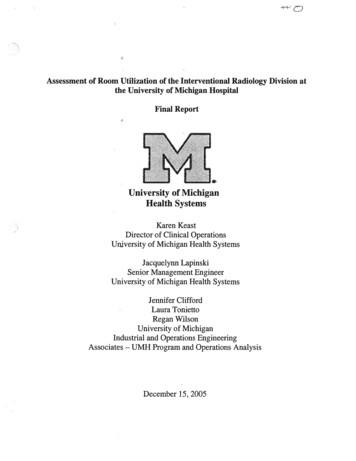
Industrial Production and Capacity Utilization: Historical Revision and Recent Developmentsthe relative proportion of an industry in IP equaled itsbase-period proportion multiplied by its growth sincethe base year relative to the growth of total IP. Thusthe share of an industry grew (or declined) along withits relative gain (or loss) in production, regardless ofrelative price movements. Under the earlier aggregation method, with base-period weights fixed at 1977,1982, 1987, and 1992, the current proportion of computer industry output grew in intervening years alongwith its relative gain in production until a new weightyear was introduced. It would fall back with theintroduction of new weights because the industry’svalue added, measured in current dollars, did not risenearly as steeply as did its real output. The revisedindex eliminates the exaggerated saw-tooth pattern ofthe computer share by updating the industry’s valueadded proportion—and its implied relative price—each year.3 With weights updated annually, anindustry’s share fluctuates much less over time, but itwill rise, for example, when a relative increase in anindustry’s real output is not offset by a proportionaterelative decline in its value added per unit of output.The revised IP index is called an annually weightedFisher index. In the new formulation, the weights areexpressed as unit value added (a ‘‘price’’) to facilitatethe aggregation of IP as an annually weighted Fisherindex for the recent period. Generally, the unit valueadded measures track broad changes in corresponding producer prices and evolve considerably moreslowly than the corresponding real output (or thanvalue added itself, which contains both quantity andprice-cost elements).4 Therefore, even though thevalue-added data are available only after a lag ofabout two years (and sometimes longer), the weightsrequired for aggregating IP in the most recent periodcan be (1) estimated from available data on producerprices through the most recent year and (2) extrapo3. The IP index for computers was first benchmarked to an annualindex of real output derived using a hedonic price index for computersin a revision published in April 1990 that affected data from 1977onward. Although the total IP index and its major industry and marketsubtotals before 1977 remain as previously formulated, total IP growthbefore 1977 is not noticeably overstated from the effects of declines inthe relative price of computers for those years. The growth trend from1967 to 1977 of manufacturing IP and of manufacturing IP excludingcomputers was similar (table 1). Moreover, the results of this revisionsuggest that aside from computers, from 1977 onward relative pricemovements among components of the earlier IP index caused onlya small overstatement of the trend growth of overall industrialproduction.4. For example, for fourteen of the twenty two-digit industrygroups in manufacturing, more than 50 percent of the variance of thechange in value added is explained by the change in the IP index forthe industry, and, in simple regressions, the coefficient on the changein IP is not significantly different from 1 for these fourteen industries.The notable exceptions to this pattern are the food, petroleum, andpaper industries.4.73Relative unit value added in industrial production,1977–96Ratio scale, 1992 100Non-energy materials 1100Non-energy products 190140130Energy, total120110100901978 1980 1982 1984 1986 1988 1990 1992 1994 19961. Non-energy materials and non-energy products exclude computers andsemiconductors.lated for the following year, given the persistence ofmany relative price trends.The relative unit value added of the combinedseries for computers and semiconductors in total IPdeclines about 131 2 percent per year, on average,from 1977 to 1987, and by more than 10 percent, onaverage, since then. If the annual weights for IP werenot estimated through the current period and thisrelative price of computers and semiconductors washeld fixed for three years rather than allowed tocontinue its decline, the most recent IP estimateswould overstate growth by about 1 2 percentage pointat an annual rate. Within the index, aside fromcomputers and semiconductors, the basic trends inrelative unit value added for non-energy products,non-energy materials, and total energy can alsodiverge from one another at times (chart 4), and suchdevelopments are reflected in the timely producerprice figures.The new formulation for monthly IP is computationally more complex than the previous formulation:Each month’s computation involves weights from
74Federal Reserve BulletinFebruary 1997Aggregation of Industrial Production and Capacity Utilization—A Technical NoteIndustrial ProductionAn individual IP series, In, represents a quantity of outputfor a period n expressed relative to the qu
output, capacity, and capacity utilization for the industrial sector. The primary feature of the revision is a new formulation for aggregating the indexes and utilization rates using weights that are updated annu-ally rather than every five years. The new formula-tion has been used to revise the output, capacity, and utilization rates back to .