Transcription
Performance Management ReportingUser Guide for IPMRJanuary, 2015
2015 by Cox Communications.All rights reserved. No part of this document may be reproduced or transmitted in any form or by any means, electronic,mechanical, photocopying, recording, or otherwise, without prior written permission of Cox Communications.CE-IPMRUGA
PurposePurposeThis guide provides Cox Business customers with steps on how to use the Internet PerformanceManagement Reporting portal. The information in this document discusses user-level featuresfor each of the portal views.System RequirementsThe Internet Performance Management Reporting portal supports the following internetbrowsers currently: Mozilla Firefox (versions 3.0 and higher) Google Chrome (versions 12 and higher) Apple Safari (versions 4 and higher) Internet Explorer (versions 8 and higher)
Table of ContentsTable of ContentsInternet Performance Management - Getting Started1Logging in . 1MyAccount Left Navigation Bar . 2Welcome Panel . 3Account Settings . 4Retrieve Password. 5Internet Performance Management - Interface Overview7Menu Bar . 7Menu Column . 7Internet Performance Management - Circuit Manager9Overview Profiles. 10Domain Summary. 10Circuit Health . 13Utilization Graphs . 16Internet Performance Management - Report Manager19Report Summary . 20Report Manager . 20Queue Manager . 21User Subscriptions . 21Performance Reports . 22Utilization Stats. 22Template Reports . 23Usage Report . 23Network Performance Measurement Points25Change Product Views with PMR . 25Understanding Network Performance Measuring Points . 25Internet Performance Measurements . 25i
Internet Performance Management – Getting StartedInternet Performance Management - Getting StartedCox Business Internet Performance Management Reporting (IPMR) service enables you toassess the performance of your circuits via a web-based portal.The IPMR User Guide instructs you on how to access its portal to find information you needabout your company’s domains and circuits.Let’s begin by learning how to log in to the application.Logging inFigure 1. MyAccount Login pageUse the following steps to access PMR.1. Open the MyAccount portal.2. Enter your User ID and Password in the corresponding fields. (Note: As an option, youcan click the Remember User ID checkbox to automatically populate the User ID fieldwith your information the next time you log in.) If you forget your password, click theForgot Password? link and follow the prompts.Note: If you forget your User ID, contact the Cox Business Customer Support Center.3. Click the Sign In button.Result: The MyAccount page displays.Performance Management Reporting User Guide1
Internet Performance Management – Getting StartedMyAccount Left Navigation BarOnce you successfully log in to MyAccount, the main menu bar displays on the left side of thescreen.Figure 2. Internet Performance menu option1. From the Data Tools menu on the left navigation bar, click the Internet Performancelink. See Figure 2.Result: The Welcome page for the selected PMR type appears.2Performance Management Reporting User Guide
Internet Performance Management – Getting StartedWelcome PanelThe Welcome panel opens for the type of service you select. In Figure 3, the Welcome to theCox IPMR Portal page appears. When you click the link, a second dialog box appears thatincludes hyperlink(s) to commonly referenced documents, such as the User Guide.Figure 3. Welcome pagePerformance Management Reporting User Guide3
Internet Performance Management – Getting StartedAccount SettingsUse the Account Settings window to modify personal or account view information.Note: The Account Settings link is in the lower left corner of every page.Figure 4. Account SettingsUse the following steps to modify your user settings.1. From the Welcome page, click the Account Settings link in the lower left corner.Result: The Edit User window displays.2. Change any User Settings field(s) as necessary. (Note: The field names are definedbelow.) Timezone: reflects real-time data capture value (check the DST box to includeDaylight Savings Time for that time zone)Default Level: the option you choose to auto display when you log in to thesystemDefault Domain: the pre-selected area you want to view in the OverviewDomain. For example, if the Default Domain value is “My Circuits,” all of thecircuits in a domain will display3. Click the Save Settings button.4. Log out and log back in to confirm the new settings.4Performance Management Reporting User Guide
Internet Performance Management – Getting StartedRetrieve PasswordIf you forget your MyAccount password, follow the steps below to reset and create a new one.If you forget your User ID, you must contact the Cox Business Customer Support Center.Figure 5. Password ResetUse the following steps to reset your password.1. From the MyAccount Sign-In home page, click the Forgot Password? link locatedbelow the Password text field.2. Enter your E-mail Address and click the Reset Password link.Result: A temporary password will be emailed to the address assigned to yourusername.Performance Management Reporting User Guide5
Internet Performance Management – Interface OverviewInternet Performance Management - Interface OverviewThis section describes the headings found in the Internet Performance Management menu barand discusses the functions of the Circuit Manager.Menu BarThe Menu Bar is located at the top of the window and contains links to Circuit Manager andReport Manager.Figure 6. Menu BarMenu ColumnThe menu column for Circuit Manager and Report Manager depends on which link you click.(The default view is Circuit Manager.) If you click the Circuit Manager link, you will see detailsof the health and performance of circuits in a domain(s). If you click the Report Manager link inthe menu bar, you will see the types of reports that are available in the menu column.Performance Management Reporting User Guide7
Internet Performance Management – Circuit ManagerInternet Performance Management - Circuit ManagerCircuit Manager provides near real-time on-screen views or “profiles” of the health andperformance of all circuits in a domain.There are two default profiles in the Circuit Manager: Overview Profiles and OverviewDomain. Additional profiles that show performance-related data for circuits may be available inthe Circuit Manager column. This is based on the settings that have been established by theCox Internet Performance Management Reporting (IPMR) administrator(s) for your companyand/or individual user permission levels.Each profile contains links that you can click to view information about the health of a circuit andthe amount of utilization and throughput circuits between points.Figure 7. Menu column for Circuit ManagerNote: Enter a full or partial Circuit ID number in the search field to quickly locate aspecific circuit by entering a full or partial Circuit ID value.Performance Management Reporting User Guide9
Internet Performance Management - Circuit ManagerOverview ProfilesDomain SummaryFigure 8. Circuit Manager – Domain Summary window10Performance Management Reporting User Guide
Internet Performance Management - Circuit ManagerDomain MapsDomain Maps allows you to view the geographic location, health and some performance data foryour company’s circuits. To enable the mapping function, the Cox Business IPMRadministrator(s) configures the location of the circuit end points (latitude and longitude) when acircuit is added to the portal.Figure 70 is an example the Cluster Mode Map Options that shows how many circuits are ingeographic regions.Figure 9. Domain Map – Cluster ModeUse the steps below to view circuit information.1. Click the Circuit Manager menu option in the left navigation bar.2. Click the Domain Summary link.3. Click the blue map icon in the table, shown in Figure 7, to open the mapping function.(Note: Domains that do not have an icon are not configured for mapping.)Result: A map appears that shows how many circuits in a domain are located in aparticular geographic area.4. Check that the Cluster Mode radio button is selected in the Map Options section. (It istypically the default choice.) See Figure 8.5. Click the circuit number (for example, “1” in the figure above) repeatedly to zoom in onthat circuit’s specific location and view additional details about the circuit.Result: Building and cell tower icons (the nodes) appear and show the circuit lineconnection (displayed as a green line) between each. In addition, the Map Option radiobutton changes from Cluster Mode to the Circuit Mode setting. See Figure 9.Performance Management Reporting User Guide11
Internet Performance Management - Circuit ManagerFigure 10. Domain Map – Circuit Mode*Note: The Distance field shows the aerial mileage between locations. It does notrepresent the actual fiber route mileage. When you double click the Distance line, theCircuit Details for the selected circuit are loaded. If there is more than one circuitbetween two locations, a drop-down menu appears. Here, you can select the circuityou want to view.6. Hover over a node and click to view the Common Language Location Identifier Codes(CLLI, pronounced “silly”) location; e.g., NWNWVAMB shown in Figure 9. This term isused in the North American telecommunications industry to specify the location andfunction of telecommunications equipment.7. Drag the figure icon, also referred to as the “yellow pegman”, (located above the zoom in/ out bar) over a node to see the Google map street view, if available.12Performance Management Reporting User Guide
Internet Performance Management - Circuit ManagerCircuit HealthThe Circuit Health window displays a status of the circuit’s condition within a domain. See Figure10. It also provides information about the circuit, such as: the name of the domain to which the circuit belongs the circuit’s identifier a description of the circuit (if provided) a visual representation (green line) of the health of the circuit between two nodes. SeeFigure 11 for a legend of line colors.Figure 11. Circuit Health (sample)Use the following steps to open and view the Circuit Health screen.1. Click the Circuit Health link in the left menu bar.Result: The Summary page appears.2. From the Status column, place your mouse over the connector symbol.Result: A dialog box displays the circuit’s (color-coded) health status and the date andtime that Ethernet and Utility Statistics were last updated. (Note: To ensure thatinformation is up-to-date, the Circuit Overview profile page refreshes automaticallyevery 60 seconds.)Performance Management Reporting User Guide13
Internet Performance Management - Circuit ManagerFigure 12. Circuit Health LegendCircuit DetailsCircuit Details are accessed by clicking the Circuit ID wherever it displays in the application. SeeFigure 12. It provides in-depth information about a circuit within a domain, such as:14 the domain to which the circuit belongs the circuit’s identifier the identifiers and physical locations for a circuit’s System A and System Z points;technically known as User Network Interfaces (UNIs) Committed Information Rate (CIR), the average transmission rate in megabits persecond (Mbs) for a virtual circuit a visual representation of the health of the circuit between two points graph(s) that depict a point’s (e.g., “System A”) usagePerformance Management Reporting User Guide
Internet Performance Management - Circuit ManagerFigure 13. Circuit Details (sample)Use the steps below to access Circuit Details.1. Click the Circuit Health menu option.Result: The Circuit Health Summary window appears.2. Click the Circuit ID value in the Visualization//Circuit section to view charts and graphsrelated to that circuit.Performance Management Reporting User Guide15
Internet Performance Management - Circuit ManagerUtilization GraphsUtilization graphing allows you to customize graphs based on your needs. These graphsshow port-level metrics such as Accepted Statistics (In/Out), Dropped Statistics (In/Out),and Computed Statistics (In/Out).Figure 14. Utilization Graph (sample)Figure 15. Utilization Graphing (sample)The top portion of the Utilization Graphing section displays a time bar which allows you to selectranges of dates and times to drill down on specific usage intervals. The option to set a Minimumor Maximum (Min / Max) or to Auto-Size Time Range is available.16Performance Management Reporting User Guide
Internet Performance Management - Circuit ManagerThe various sections of Utilization Graphing allow you to self-select metrics of interest based ona specified time period. Once the selections have been made and you click the Graph button,the graph will appear beneath the statistics selection template.Accepted Statistics (In /Out)The Accepted Statistics (In / Out) allows the users to view the following, in graphical format,when the corresponding box is checked:Field LabelDescriptionInput / Output Accept PacketsData points that visually reflect the amount of packets accepted for theselected time periodInput / Output Accept BytesData points that visually reflect the amount of bytes accepted for theselected time periodInput / Output Accept MinData points that visually reflect the minimum amount of acceptedpackets for the selected time periodInput / Output Accept AvgData points that visually reflect the average amount of acceptedpackets for the selected time periodInput / Output Accept MaxData points that visually reflect the maximum amount of acceptedpackets for the selected time periodInput / Output CIRStraight line data point that visually reflects the Committed InformationRateInput / Output EIRStraight line data point that visually reflects the Excess InformationRateThe Dropped Statistics (In /Out)The Dropped Statistics (In / Out) allows the users to view the following, in graphical format,when the corresponding box is checked:Field LabelDescriptionInput / Output Drop PacketsData points that visually reflect the amount of packets dropped for theselected time periodInput / Output Drop BytesData points that visually reflect the amount of bytes dropped for theselected time periodInput / Output Drop MinData points that visually reflect the minimum amount of droppedpackets for the selected time periodInput / Output Drop AvgData points that visually reflect the average amount of droppedpackets for the selected time periodInput / Output Drop MaxData points that visually reflect the maximum amount of droppedpackets for the selected time periodPerformance Management Reporting User Guide17
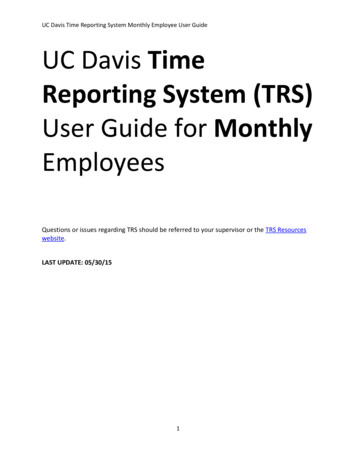
Internet Performance Management - Circuit ManagerThe Computed Statistics (In /Out)The Computed Statistics (In / Out) allows the users to view the following, in graphical format,when the corresponding box is checked:Input / Output Accept Avg 95%Straight line data point that visually reflects the average 95thpercentile of accepted for the selected time periodInput / Output Drop Avg 95%Straight line data point that visually reflects the average 95thpercentile of dropped for the selected time periodInput / Output Util%(Utilization Percent)You can select and graphically view byte data, utilization packet data and utilization data or anyother combination of selections. For example, if you select Input CIR, Input Accept Max, andOutput Accept Max, you will see a graph of the maximum amount of packets traversing thecircuit for the selected time period, in addition to their CIR which should always be representedby a straight line.Additionally, a customer signed up to burst could also select Input and Output Accept 95% tosee their peak usage based on the 95th Percentile and the graph will appear underneath theexisting graph.For the one day period shown, the upstream usage peaked to around 50 percent shortly after 6p.m. However, this customer is not a bursting customer and whether they selected Input andOutput Accept 95% or Input and Output Util%, they would see the same data.Figure 16. Upstream Usage graph (sample)18Performance Management Reporting User Guide
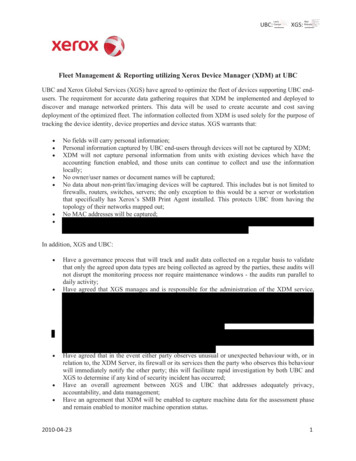
Internet Performance Management – Report ManagerInternet Performance Management - Report ManagerThe Report Manager heading provides a Report Summary menu bar that consists of theReport Manager, Queue Manager, and User Subscription links.The Performance Reports heading includes a link to a Utilization Stats report (e.g., CircuitID, Accept Min Rate, Accept Avg Rate, and Accept Max Rate) in an on-screen tabularformat with the option to export the data, if desired.The Template Reports provide usage information specifically related to the 95th percentile.Figure 17. IPMR Report Manager left menu barPerformance Management Reporting User Guide19
Internet Performance Management - Report ManagerReport SummaryReport ManagerThe Report Manager tab allows you to create and manage reports as desired. As noted inFigure 17, Report Manager provides performance metrics based on the reporting of circuits in aspecific domain.You can configure the reports based on date and time filtering as well as on-screen tabular dataviews or the option to export the data.When you click one of th
Cox Business Internet Performance Management Reporting (IPMR) service enables you to assess the performance of your circuits via a web-based portal. The IPMR User Guide instructs you on how to access its portal to find information you need about your company’s domains and circuits.