Transcription
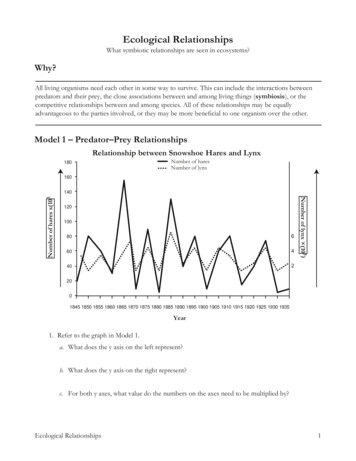
CH01 v2.qxd8/5/0410:42 AMPage 11Asquith, G., and D. Krygowski, 2004, Basic Relationships of Well Log Interpretation, in G. Asquith andD. Krygowski, Basic Well Log Analysis: AAPG Methods in Exploration 16, p. 1–20.Basic Relationships ofWell Log InterpretationINTRODUCTIONThis chapter provides a general introduction to welllogging principles and methods that will be usedthroughout the book. Succeeding chapters (2 through6) introduce the reader to specific log types. The textdiscusses how different log types measure variousproperties in the wellbore and surrounding formations,what factors affect these measurements, where on astandard log display a particular curve is recorded, andhow interpreted information is obtained from the logsusing both charts and mathematical formulas. Unlikemany other logging texts, the logging tools aregrouped according to their primary interpretation target, rather than their underlying measurement physics.Spontaneous potential (SP) and gamma ray logs arediscussed first, as their primary use is correlation andtheir primary interpretive target is gross lithology (thedistinction between reservoir and nonreservoir). Theporosity logs (i.e., sonic, density, and neutron logs) arecovered next, then the resistivity logs. Nuclear magnetic-resonance logs, although they provide porosity(among other quantities of interest), are presented afterresistivity logs. This is due in part to their recentarrival and to their relative absence in historical dataarchives.The final four chapters again deal with interpretation of the data, this time in detail with example problems and their solutions. These chapters bring theintroductory material of Chapter 1 together with thespecific measurement information and are intended toprovide a coherent view of the interpretation process.The reader is encouraged to work the examples to gainfamiliarity with the interpretation techniques and tobegin to understand the limitations on interpretationthat are present due to the nature of subsurface information.The use of charts and simple calculations throughout the text, rather than the use of petrophysical com-puter software, is intentional. It is only through experience with such manual methods that the reader cangain an appreciation for the effects of parameters onthe calculations, and gain a better understanding of theaccuracy and precision of the techniques discussedhere.When the first edition of this book was published,virtually all well-logging data were acquired throughthe use of wireline-conveyed tools; that is, loggingtools lowered in the borehole on a 7-conductor cableover which power, operating instructions, and datawere sent. Since the mid-1980s, a second formationevaluation technique, measurement while drilling(MWD) or logging while drilling (LWD), has developed. In this method, the logging sensors are imbedded in the thick-walled drill collars used at the bottomof the drill string (near the bit), and measurement offormation properties is done continuously during thedrilling process (hence the name, MWD). Initially,MWD logging technology borrowed heavily fromwireline technology, with the goal being to produceLWD measurements comparable to wireline measurements. As LWD technology has progressed, sensordesign and other features of LWD have been incorporated back into wireline technology, for the improvement of those measurements.Unless specifically noted in the text, the interpretation of borehole data is the same irrespective of thesource of the data, either wireline or LWD sensors andmeasurement systems. The techniques shown here areapplicable to both data sources and can even beextended to incorporate equivalent core measurements.GENERALAs logging tools and interpretive methods aredeveloping in accuracy and sophistication, they areplaying an expanded role in the geological decision-1
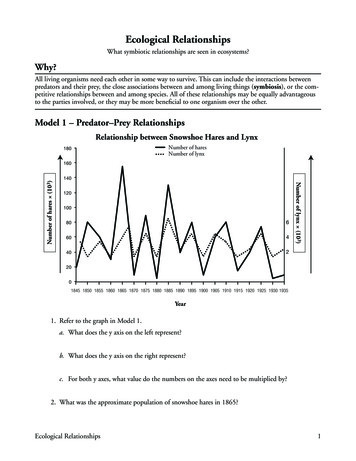
CH01 v2.qxd8/5/04210:42 AMPage 2ASQUITH AND KRYGOWSKImaking process. Today, petrophysical log interpretation is one of the most useful and important toolsavailable to a petroleum geologist.Besides their traditional use in exploration to correlate zones and to assist with structure and isopachmapping, logs help define physical rock characteristicssuch as lithology, porosity, pore geometry, and permeability. Logging data are used to identify productivezones, to determine depth and thickness of zones, todistinguish between oil, gas, or water in a reservoir,and to estimate hydrocarbon reserves. Also, geologicmaps developed from log interpretation help withdetermining facies relationships and drilling locations.Increasingly, the importance of petrophysics and welllog analysis is becoming more evident as more attention is being devoted to the ongoing management ofreservoirs. The industry is realizing the importance ofdetailed petrophysical analyses, based on the details ofthe available data in monitoring, simulating, andenhancing reservoir performance to maximize thereturn on investment.Of the various types of logs, the ones used most frequently in hydrocarbon exploration are called openhole logs. The name open hole is applied becausethese logs are recorded in the uncased portion of thewellbore. All the different types of logs and theircurves discussed in this text are of this type.A geologist’s first exposure to log interpretationcan be a frustrating experience. This is not onlybecause of its lengthy and unfamiliar terminology, butalso because knowledge of many parameters, concepts, and measurements is needed before an understanding of the logging process is possible.Perhaps the best way to begin a study of logging isby introducing the reader to some of the basic concepts of well log analysis. Remember that a boreholerepresents a dynamic system; that fluid used in thedrilling of a well affects the rock surrounding the borehole and, therefore, log measurements. In addition, therock surrounding the borehole has certain propertiesthat affect the movement of fluids into and out of it.The two primary parameters determined from welllog measurements are porosity and the fraction of porespace filled with hydrocarbons (i.e., hydrocarbon saturation). The parameters of log interpretation are determined directly or inferred indirectly and are measuredby one of three general types of logs: electrical nuclear acoustic or sonic logsThe names refer to the sources used to obtain themeasurements. The different sources create records(logs), which contain one or more curves related tosome property in the rock surrounding the wellbore(see Society of Professional Well Log Analysts, 1984).For the reader unfamiliar with petrophysical logging,some confusion may develop over the use of the wordlog. In common usage, the word log may refer to a particular curve, a suite or group of curves, the physical(paper) record of the measurements, a logging tool(sonde), or the process of logging.Rock properties or characteristics that affect logging measurements are: porosity, lithology, mineralogy, permeability, and water saturation. Additionally,the resistivity of the rock is important because it isdirectly measured and is an essential part in the interpretation process. It is essential that the reader understand these properties and the concepts they representbefore proceeding with a study of log interpretation.PorosityPorosity can be defined as the ratio of voids to thetotal volume of rock. It is represented as a decimalfraction or as a percentage and is usually representedby the Greek letter phi, φ.porosity, φ volume of porestotal volume of rock1.1The amount of internal space or voids in a givenvolume of rock is a measure of the amount of fluid arock will hold. This is illustrated by Equation 1.1 andis called the total porosity. The amount of void spacethat is interconnected, and thus able to transmit fluids,is called effective porosity. Isolated pores and pore volume occupied by adsorbed water are excluded from adefinition of effective porosity but are included in thedefinition of total porosity.Lithology and MineralogyIn well-log analysis, the terms lithology and mineralogy are used with some ambiguity. Lithology is oftenused to describe the solid (matrix) portion of the rock,generally in the context of a description of the primarymineralogy of the rock (e.g., a sandstone as a description of a rock composed primarily of quartz grains, ora limestone composed primarily of calcium carbonate). In the early days of log interpretation (with limited measurements), this was usually a sufficientdescription. Probably the first instances of lithologiceffects on the logs were observed in shaly or clay-containing sandstones. With the advent of multiple porosity measurements and the development of moredetailed interpretive methods, it has become possibleto estimate the primary solid constituents, normally asa mineral pair or triad.
CH01 v2.qxd8/5/0410:42 AMPage 3Basic Relationships of Well Log InterpretationThe literature has tended to follow the improvedunderstanding of the constitution of the solid part ofthe formations of interest, with most current literaturereferring to the determination of mineralogy instead oflithology. When one considers the physics of loggingmeasurements, the ambiguity continues. Some measurements (primarily nuclear) are made as the result ofmolecular-level interactions between the formationand the logging tool. These might be considered asbeing affected by the formation’s mineralogy. Others,especially the acoustic measurements, interact withthe formation on a bulk or framework level, and couldbe considered to be more affected by lithology (S. L.Morriss, 1999, personal communication).The ambiguity between lithology and mineralogy isbest seen in porosity crossplots which, through time,have moved from estimating lithology to estimatingmineralogy, while the underlying measurements andinterpretive techniques have remained essentially thesame.As noted above, the first lithologic effects wereprobably due to the presence of clays and shales in formations of interest. One parameter that has been usedconsistently to account for these effects has been shalevolume. As our understanding of geological processesmatured, it became understood that shale and claywere different, and that shaly sands were usually notjust sands with shales mixed in, but sands that contained clays — clays that could be very different fromthe clays present in the shales near those sands ofinterest. Again, the literature and our interpretive techniques often use the terms shale volume and clay volume interchangeably. In this text, shale volume will beused preferentially because most of the interpretivetechniques in which the volumes are used derive thosevolumes from the properties of nearby shales.PermeabilityPermeability is the ability of a rock to transmit fluids.It is related to porosity but is not always dependentupon it. Permeability is controlled by the size of theconnecting passages (pore throats or capillaries)between pores. It is measured in darcys or millidarcys(md) and is represented by the symbol K. The abilityof a rock to transmit a single fluid, when it is completely saturated with that fluid, is called absolute permeability. Effective permeability refers to the ability ofthe rock to transmit one fluid in the presence of another fluid when the two fluids are immiscible.Formation water (connate water in the formation)held by capillary pressure in the pores of a rock servesto inhibit the transmission of hydrocarbons. Stated dif-3ferently, formation water takes up space both in poresand in the connecting passages between pores. As aconsequence, it may block or otherwise reduce theability of other fluids to move through the rock.Relative permeability is the ratio between effectivepermeability of a fluid at partial saturation and the permeability at 100% saturation (absolute permeability).When relative permeability of a formation’s water iszero, the formation produces water-free hydrocarbons(i.e., the relative permeability to hydrocarbons is100%). With increasing relative permeabilities towater, the formation produces increasing amounts ofwater relative to hydrocarbons.Water SaturationWater saturation is the amount of pore volume in arock that is occupied by formation water. It is represented as a decimal fraction or as a percentage and hasthe symbol Sw.water saturation, S w formation water occupying porestotal pore space in the rock 1.2Although hydrocarbon saturation is the quantity ofinterest, water saturation is usually used because of itsdirect calculation in equations such as Archie’s equation, discussed in a later section in this chapter. Hydrocarbon saturation is usually determined by the difference between unity and water saturation:Sh 1 Sw1.3Irreducible water saturation or Sw irr is the termused to describe the water saturation at which all thewater is adsorbed on the grains in a rock or is held inthe capillaries by capillary pressure. At irreduciblewater saturation, water does not move and the relativepermeability to water is zero.ResistivityResistivity is the rock property on which the entirescience of logging first developed. Resistivity is theinherent property of all materials, regardless of theirshape and size, to resist the flow of an electric current.Different materials have different abilities to resist theflow of electricity.While the resistance of a material depends on itsshape and dimensions, the resistivity is an invariantproperty; the reciprocal of resistivity is conductivity.In log interpretation, the hydrocarbons, the rock, andthe fresh water of the formation are all assumed to act
CH01 v2.qxd8/5/04410:42 AMPage 4ASQUITH AND KRYGOWSKIas insulators and are, therefore, nonconductive (or atleast very highly resistive) to electric current flow. Saltwater, however, is a conductor and has a low resistivity.The measurement of resistivity is then a measurement,albeit indirect, of the amount (and salinity) of the formation water. The unit of measure used for the conductor is a cube of the formation, one meter on eachedge. The measured units are ohm-meters2/meter andare called ohm-meters.R r AL1.4where:R resistivity (ohm-m)r resistance (ohms)A cross-sectional area of substance being measured (m2)L length of substance being measured (m)Resistivity is a basic measurement of a reservoir’sfluid saturation and is a function of porosity, type offluid (i.e., hydrocarbons, salt water, or fresh water),amount of fluid, and type of rock. Because both therock and hydrocarbons act as insulators but salt wateris conductive, resistivity measurements made by logging tools can be used to detect hydrocarbons and estimate the porosity of a reservoir. During the drilling ofa well, fluids move into porous and permeable formations surrounding a borehole, so resistivity measurements recorded at different distances into a formationoften have different values. Resistivity is measured byelectric logs, commonly known (in the West) as laterologs and induction logs.Conrad Schlumberger in 1912 began the first experiments which led, eventually, to the development ofmodern-day petrophysical logs. The first electric logwas run September 5, 1927, by H. G. Doll in AlsaceLorraine, France. In 1941, G. E. Archie with Shell OilCompany presented a paper to the AIME in Dallas,Texas, which set forth the concepts used as a basis formodern quantitative log interpretation (Archie, 1942).Archie’s experiments showed that the resistivity ofa water-filled formation (Ro) could be related to the resistivity of the water (Rw) filling the formation througha constant called the formation resistivity factor (F):Ro F R waφm RS w o Rt1 n 1.7where n is the saturation exponent, whose value typically varies from 1.8 to 2.5 but is most commonlyassumed to be 2.By combining equations 1.6 and 1.7, the water-saturation formula can be rewritten in the following form:1 F Rw n S w Rt 1.8This is the formula that is most commonly referred toas the Archie equation for water saturation (Sw). Allpresent methods of interpretation involving resistivitycurves are derived from this equation. In its most general form, Archie’s equation becomes: a Rw S w m R φ t1n1.9Table 1.1 illustrates the range of values for a and m.In first-pass or reconnaissance-level interpretations, orwhere there is no knowledge of the local parameters,the following values can be used to achieve an initialestimate of water saturation:a 1.0; m n 2.0Now that the reader is introduced to some of thebasic concepts of well log interpretation, our discussion can continue in more detail about the factors thataffect logging measurements.1.5Archie’s experiments also revealed that the formation factor (F) could be related to the porosity of theformation by the following formula:F where m is the cementation exponent whose valuevaries with grain size, grain-size distribution, and thecomplexity of the paths between pores (tortuosity),and a is the tortuosity factor. The higher the tortuosityof the formation, the higher the value of m. The tortuosity factor (a) is commonly set to 1.0, but is allowedto vary by some petrophysicists.Water saturation (Sw) is determined from the waterfilled resistivity (Ro) and the actual (true) formationresistivity (Rt) by the following relationship:1.6BOREHOLE ENVIRONMENTWhere a hole is drilled into a formation, the rockplus the fluids in it (the rock-fluid system) are alteredin the vicinity of the borehole. The borehole and therock surrounding it are contaminated by the drillingmud, which affects logging measurements. Figure 1.1
CH01 v2.qxd8/5/0410:42 AMPage 5Basic Relationships of Well Log Interpretation5Table 1.1. Different coefficients and exponents used to calculate formation factor (F). (Modified after Asquith, 1980.)a: Tortousityfactor1Mostm: 0Consolidated sandstones10.622.15Unconsolidated sands (Humble formula)11.451.54Average sands (after Carothers, 1968)1.651.33Shaly sands (after Carothers, 1968)1.451.70Calcareous sands (after Carothers, 1968)0.852.14Carbonates (after Carothers, 1968)2.451.08Pliocene sands, southern California (after Carothers and Porter, 1970)1.971.29Miocene sands, Texas–Louisiana Gulf Coast (after Carothers andPorter, 1970)1.0φ(2.05-φ)Clean granular formations (after Sethi, 1979)commonly usedis a schematic illustration of a porous and permeableformation that is penetrated by a borehole filled withdrilling mud.Some of the more important symbols shown in Figure 1.1 are:Hole Diameter (dh)The borehole size is determined by the outsidediameter of the drill bit. But, the diameter of the borehole may be larger than the bit size because of washoutand/or collapse of shale and poorly cementedporous rocks, or smaller than the bit size because of a build up ofmud cake on porous and permeable formations(Figure 1.1).Common borehole sizes normally vary from 7-7/8in. to 12 in., and modern logging tools are designed tooperate within these size ranges. The size of the borehole is measured by a caliper log.Drilling mud Resistivity (Rm)Today, most wells are drilled with rotary bits andthe use of a special fluid, called drilling mud, as a circulating fluid. The mud helps remove cuttings fromthe wellbore, lubricate and cool the drill bit, and maintain an excess of borehole pressure over formationpressure. The excess of borehole pressure over forma-tion pressure prevents blowouts. The density of themud is usually kept high enough so that hydrostaticpressure in the mud column is greater than formationpressure. This pressure difference forces some of thedrilling fluid to invade porous and permeable formations. As invasion occurs, many of the solid particles(i.e., clay minerals from the drilling mud) are trappedon the side of the borehole and form mud cake (havinga resistivity of Rmc; Figure 1.1). Fluid that filters intothe formation during invasion is called mud filtrate(with a resistivity of Rmf; Figure 1.1). The resistivityvalues for drilling mud, mud cake, and mud filtrate arerecorded on a log’s header (Figure 1.2), and are usedin interpretation.Invaded ZoneThe zone in which much of the original fluid isreplaced by mud filtrate is called the invaded zone. Itconsists of a flushed zone (of resistivity Rxo) and atransition or annulus zone (of resistivity Ri). Theflushed zone occurs close to the borehole (Figure 1.1)where the mud filtrate has almost completely flushedout a formation’s hydrocarbons and/or water (Rw). Thetransition or annulus zone, where a formation’s fluidsand mud filtrate are mixed, occurs between the flushedzone and the uninvaded zone (of resistivity Rt). Theuninvaded zone is defined as the area beyond theinvaded zone where a formation’s fluids are uncontaminated by mud filtrate.The depth of mud-filtrate invasion into the invaded
CH01 v2.qxd8/5/04610:42 AMPage 6ASQUITH AND KRYGOWSKIzone is referred to as diameter of invasion (di and dj;Figure 1.1). The diameter of invasion is measured ininches or expressed as a ratio: dj/dh (where dh represents the borehole diameter). The amount of invasionthat takes place is dependent upon the permeability ofthe mud cake and not upon the porosity of the rock. Ingeneral, an equal volume of mud filtrate can invadelow-porosity and high-porosity rocks if the drillingmuds have equal amounts of solid particles. The solidparticles in the drilling muds coalesce and form animpermeable mud cake. The mud cake then acts as abarrier to further invasion. Because an equal volume offluid can be invaded before an impermeable mud-cakebarrier forms, the diameter of invasion is greatest inlow-porosity rocks. This occurs because low-porosityrocks have less storage capacity or pore volume to fillwith the invading fluid, and, as a result, pores throughout a greater volume of rock are affected. Generalinvasion diameters in permeable formations aredj/dh 2, for high-porosity rocks;dj/dh 5, for intermediate-porosity rocks; anddj/dh 10, for low-porosity rocks.Flushed zone Resistivity (Rxo)The flushed zone extends only a few inches fromthe wellbore and is part of the invaded zone. If invasion is deep or moderate, most often the flushed zoneis completely cleared of its formation water by mudfiltrate (of resistivity Rmf). When oil is present in theflushed zone, the degree of flushing by mud filtratecan be determined from the difference between watersaturations in the flushed (Sxo) zone and the uninvaded(Sw) zone (Figure 1.1). Usually, about 70% to 95% ofthe oil is flushed out; the remaining oil is called residual oil [Sro (1.0 - Sxo), where Sro is the residual oilsaturation, (ROS)].Uninvaded zone Resistivity (Rt)The uninvaded zone is located beyond the invadedzone (Figure 1.1). Pores in the uninvaded zone areuncontaminated by mud filtrate; instead, they are saturated with formation water (Rw), oil, and/or gas.Even in hydrocarbon-bearing reservoirs, there isalways a layer of formation water on grain surfaces.Water saturation (Sw; Figure 1.1) of the uninvadedzone is an important factor in reservoir evaluationbecause, by using water saturation data, a geologistcan determine a reservoir’s hydrocarbon saturation.Equation 1.3 expresses the calculation and is repeatedhere:Sh 1 – Swwhere:Sh hydrocarbon saturation (i.e., the fraction ofpore volume filled with hydrocarbons).Sw water saturation of the uninvaded zone (i.e.,the fraction of pore volume filled with water).The ratio of the uninvaded zone’s water saturation(Sw) to the flushed zone’s water saturation (Sxo) is anindex of hydrocarbon moveability.INVASION AND RESISTIVITY PROFILESInvasion and resistivity profiles are diagrammatic,theoretical, cross-sectional views of subsurface conditions moving away from the borehole and into a formation. They illustrate the horizontal distributions ofthe invaded and uninvaded zones and their corresponding relative resistivities. There are three commonlyrecognized invasion profiles: step transition annulusThese three invasion profiles are illustrated in Figure1.3.The step profile has a cylindrical geometry with aninvasion diameter equal to dj. Shallow-reading resistivity logging tools read the resistivity of the invadedzone (Ri), while deeper reading resistivity loggingtools read true resistivity of the uninvaded zone (Rt).The transition profile also has a cylindrical geometry with two invasion diameters: di (flushed zone) anddj (transition zone). It is probably a more realisticmodel for true borehole conditions than is the step profile. At least three resistivity measurements, each sensitive to a different distance away from the borehole,are needed to measure a transitional profile. Thesethree measure resistivities of the flushed (Rxo), transition (Ri), and uninvaded zones (Rt) (see Figure 1.3).By using these three resistivity measurements, thedeep reading resistivity measurement can be correctedto a more accurate value of true resistivity (Rt), and thedepth of invasion can be determined.This ability to estimate the invasion in a formationarrived with the wide introduction of the dual induction and dual laterolog tools in the 1960s. As thenames imply, each tool made two induction or two laterolog measurements. These two measurements investigate different distances into the formation and arereferred to as medium and deep measurements. Theword dual in the names of these logging tools can be
CH01 v2.qxd8/5/0410:42 AMPage 7Basic Relationships of Well Log Interpretation 7confusing, because each tool also made a third measurement, which was shallower than the medium anddeep measurements. In the 1980s, array resistivitytools made their appearance. Through the use of moresensors, they investigate more distances into the formation (usually 5 to 7), which provides for a moredetailed picture of the formation and its invasion.An annulus profile is only sometimes recorded on alog, because it rapidly dissipates in a well. The annulus profile is detected only by an induction log runsoon after a well is drilled. However, it is very important to a geologist, because the profile can only occurin zones that bear hydrocarbons. As the mud filtrateinvades the hydrocarbon-bearing zone, the hydrocarbons are moved out first. Next, formation water ispushed out in front of the mud filtrate, forming anannular (circular) ring at the edge of the invaded zone(Figure 1.3). The annulus effect is detected by a higher resistivity reading on a deep induction log than byone on a medium induction log.Log resistivity profiles illustrate the resistivity values of the invaded and uninvaded zones in the formation being investigated. They are of particular interestbecause, by using them, a geologist can quickly scan alog and look for potential zones of interest such ashydrocarbon zones. Because of their importance,resistivity profiles for both water-bearing and hydrocarbon-bearing zones are discussed here. These profiles vary, depending on the relative resistivity valuesof Rw and Rmf. All the variations and their associatedprofiles are illustrated in Figures 1.4 and 1.5.Water-bearing ZonesFigure 1.4 illustrates the borehole and resistivityprofiles for water-bearing zones where the resistivity ofthe mud filtrate (Rmf) for a freshwater mud is muchgreater than the resistivity of the formation water (Rw),and where resistivity of the mud filtrate (Rmf) for a saltwater mud is approximately equal to the resistivity ofthe formation water (Rw). A freshwater mud (i.e., Rmf 3 Rw) results in a wet log profile where the shallow(Rxo), medium (Ri), and deep (Rt) resistivity measurements separate and record high (Rxo), intermediate (Ri),and low (Rt) resistivities (Figure 1.4). A saltwater mud(i.e., Rw Rmf ) results in a wet profile where the shallow (Rxo), medium (Ri), and deep (Rt) resistivity measurements all read low resistivity (Figure 1.4). Figures1.6 and 1.7 illustrate the resistivity curves for wet zonesinvaded with either freshwater or saltwater mud.Hydrocarbon-bearing ZonesFigure 1.5 illustrates the borehole and resistivityprofiles for hydrocarbon-bearing zones where theresistivity of the mud filtrate (Rmf) for a freshwatermud is much greater than the resistivity of the formation water (Rw), and where Rmf of a saltwater mud isapproximately equal to Rw. A hydrocarbon zone invaded with freshwater mud results in a resistivity profilewhere the shallow (Rxo), medium (Ri), and deep (Rt)resistivity measurements all record high resistivities(Figure 1.5). In some instances, the deep resistivity ishigher than the medium resistivity. When this happens,it is called the annulus effect. A hydrocarbon zoneinvaded with saltwater mud results in a resistivity profile where the shallow (Rxo), medium (Ri), and deep(Rt) resistivity measurements separate and record low(Rxo), intermediate (Ri) and high (Rt) resistivities (Figure 1.5). Figures 1.8 and 1.9 illustrate the resistivitycurves for hydrocarbon zones invaded with eitherfreshwater or saltwater mud.BASIC INFORMATION NEEDEDIN LOG INTERPRETATIONLithologyIn quantitative log analysis, there are several reasons why it is important to know the lithology of azone (i.e., sandstone, limestone, or dolomite). Porosity logs require a lithology or a matrix constant beforethe porosity (φ) of the zone can be calculated. The formation factor (F), a variable used in the Archie watersaturation equation, also varies with lithology. As aconsequence, the calculated water saturation changesas F changes. Table 1.1 is a list of several different values for calculating formation factor and illustrates howlithology affects the formation factor.Formation TemperatureFormation temperature (Tf) is also important in loganalysis, because the resistivities of the drilling mud(Rm), the mud filtrate (Rmf), and the formation water(Rw) vary with temperature. The temperature of a formation is determined by knowing: formation depth bottom hole temperature (BHT) total depth of the well (TD) surface temperature
CH01 v2.qxd8/5/04810:42 AMPage 8ASQUITH AND KRYG
zero, the formation produces water-free hydrocarbons (i.e., the relative permeability to hydrocarbons is 100%). With increasing relative permeabilities to water, the formation produces increasing amounts of water relative to hydrocarbons. Water Saturation Water saturation is the amount of pore volume in a r