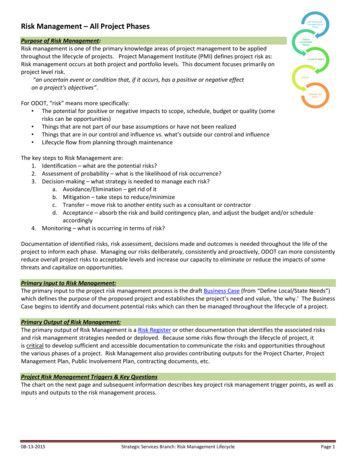
Transcription
Solving for Project RiskManagement: Understandingthe Critical Role of Uncertaintyin Project ManagementbyChristian B. Smart, PhD, CCEA1Presented to IT CASTSeptember 17, 2020
IT’S ALWAYS RISKIER THAN YOU EXPECTEVEN TAKING INTO ACCOUNT IT IS RISKIER THAN YOU EXPECT!COMPUTER CHESSComputer programs were first developed in the 1950sBelief was that, in ten years, a computer program would be able todefeat the world championThis prediction was continually updated to be ten years awayDid not occur until the 1990sHOFSTADTER’S LAWInspired by this example, the cognitive scientist DouglasHofstadter coined the recursive and eponymous Hofstadter’sLaw:It always takes longer than you expect, even when you takeinto account Hofstadter’s LawCONNECTION WITH COST AND RISK2As time is money, Hofstadter’s Law applies to costEntropy is the general tendency towards disorder in theuniverse – more can (and does) go wrong than go rightDue to entropy, a similar law applies to risk
PROJECT RISK MANAGEMENTOPPORTUNITY IN RISKPROJECTS ARE INHERENTLY RISKYProjects of all types, large and small, experience regularamounts of significant cost and schedule growthThis growth is strong evidence not only of risk, but lack ofproper risk managementRisk is often considered just another a four-letter wordQUANTITATIVE RISK ASSESSMENTProjects need to conduct quantitative cost and schedule riskanalysisThe application of quantitative methods is fraught withobstaclesHOW TO DO IT BETTERThis book, written for a general project managementaudience, discusses these problems and prescribes solutionsThere is the opportunity to achieving a competitiveadvantage by adopting credible risk management practices3Available now for pre-order on Amazon:http://tiny.cc/j7xbpz
AGENDAHIGH COST AND SCHEDULEGROWTHCost and schedule growth is universalacross all types of projects – it isfrequent, high, and extremeWHY COST AND SCHEDULEGROWTH OCCURCost and schedule growth occur for amultitude of reasons – we discuss a fewand provide examplesFunding for government systemsrelies on a portfolio effect, which likea “free lunch,” does not existHERE BE DRAGONS –CONSIDERING THE RIGHTTAIL IN RISK MANAGEMENT?Risk measurement does not typicallyincorporate the right tail, which iswhere the risks we want to guardagainst lurk (“dragons”)THE QUANTITATIVE RISKMANAGEMENT IMPERATIVETRYING TO DO TOO MUCHWITH TOO LITTLEAverages are not enough, nor arequalitative methods – quantitativerisk assessment is a must, not just anice to havePortfolio management is notconducted consistentlyResults in organization shootingthemselves in their own proverbialfoot due to trying to fund too manyprograms with too few dollarsCOVERED WITH OIL: REALISMIN RISK ANALYSISPoll: Is uncertainty analysisa crucial step in thedevelopment of a credibleestimate?Even when risk is measured, it isunrealistically low4THE PORTFOLIO EFFECT ANDTHE FREE LUNCHTHINKING STRATEGICALLYA little strategic thinking could go along way – incentives can achievebetter outcomesImage Source: James Ford Bell Library
COST AND SCHEDULE GROWTHA LEGACY OF DISASTER512COMMONMultiple Industries ExperienceSignificant Cost and ScheduleGrowth – Has Been a Problemfor a Long TimeFREQUENT70-80% of Projects ExperienceCost and Schedule Growth34HIGHCost: 50% or More on Average(Mean)Schedule: 30% or More onAverage (Mean)EXTREME (FOR COST)Cost Growth in Excess of 100%Is a Common Occurrence inMost Projects (1 in 6)
Why Cost and Schedule GrowthOccurNumerous Reasons, BothInternal and External: Optimism Cost, Schedule, andTechnical Misalignment Errors in Estimation Moore’s Law Black Swans“The Non-Secret of Good Cost[and Schedule] Estimating:Don’t Drink the Kool-Aid”Lawrence Goeller, OSD CostAnalysis Improvement Group612345OPTIMISMInnate bias - Planning FallacyProspect Theory - Project managersare risk-seekingCOST, SCHEDULE,TECHNICAL MISALIGNMENTLike a three-legged stool, all need tobe consistent in order for a project tobalanceMOORE’S LAWExponential growth in technologyPaired with projects that take adecade or longer to completemeans that either requirements arecontinually updated or the productis obsolete on deliveryBLACK SWANSUnpredictable, rare, unprecedentedevents that have a huge impactLAKE WOBEGONProject managers and their staff arenot like the children of GarrisonKeillor’s fictional town – they are notall above average
SOFTWARE DEVELOPMENT EXAMPLES7PHOENIX FEDERAL PAYSYSTEMHEALTHCARE.GOVDENVER AIRPORTBAGGAGE SYSTEMFOX MEYER ERPIncorporated COTSAgile project; system wasPoor planning, aggressive 5 billion pharmaceuticalelements, intended torolled out before it wasschedule, and technicalwholesale giant went bankruptsave money; bug inready; technical issues, notcomplexity caused this projecttrying to implement an ERPsystem underpaid civildesigned to handle theto delay the new airport’ssystemservants, cost billions toexpected number of users;opening and was ultimatelyfixrequired billions to fixcancelled
12348RISK IS A MUST, NOT AN OPTIONHigh degree of cost and schedulegrowth in completed projects meansthat there is a great deal of resourceriskCOST AND SCHEDULE RISKIMPERATIVEMORE THAN JUST AVERAGESIt is not sufficient to develop a singlepoint estimate of cost or schedule“Projects that are based onaverages are, on average, behindschedule and beyond budget.” –Sam Savage, The Flaw of AveragesNEEDS TO BE QUANTITATIVEQualitative risk assessment results insignificant underestimation of riskNeed to move beyond the riskmatrix and robustly assess cost andschedule risk with a quantitativeanalysisS-CURVESCost and schedule risk are typicallydisplayed graphically as “S-curves”Provides probability thatcost/schedule will not exceed aspecified value“Repent, while thereis still time.”Stephen A. Book,Ph.D.Poll: Have you conducteda quantitative cost orschedule risk analysis for aproject?
TRACK RECORD FOR RISKANALYSISWORSE THAN RANDOMIt’s hard to improve if youdon’t know how well youhave done in the past.91234SCARCEThe results of risk analysis are rarelycompared to the actual outcome –like a darts player that turns awayfrom the board after throwing a dartWHAT LITTLE EXISTS IS NOTGOODThe limited data available is mainlyfor costThe 90 percent confidence levelmeans there is only a 10%probability that this level will beexceededOPPOSITE OF EXPECTEDHowever, for the 10 risk analyses inthe table, for only one was theactual cost less than the 90 percentconfidence levelEXTREMELY UNLIKELYWhile a small data set, the odds ofsuch an occurrence is extremelyremote – 1 in 2.7 millionYou are more likely to be struck bylightning
123104“ALL OF THOSE TOURISTSCOVERED WITH OIL”Jimmy Buffett, in writing the songMargaritaville, probably neverimagined that beach goers wouldbe covered with crude oilGulf of Mexico oil spill in 2010 setrecordsCOVERED WITH OIL: REALISM INRISK ANALYSISRISK UNDERESTIMATION ISPREVELANTVariety of reasons – correlation,overreliance on normal distribution,etc.We do not have a good track recordof estimating riskPERCEPTION VS. REALITYPlato Vs. DiogenesHome Economicus and the Iron BowlNotion is risk decreases over time,but actually risk perceptionincreases up to critical design asrisks are discovered/admitted, andthen decreases as these risks areaddressedCALIBRATION IS THE ANSWERCan calibrate cost risk analyses tohistorical cost and schedule growthProvides a cross check on therealism of quantitative risk analysesIt is always riskier than you think,even taking into account that it isriskier than you think.Poll: If you havedone aquantitative riskanalysis, whichdistributions haveyou used? Selectall that apply.a. Triangularb. Gaussianc. Lognormald. Other
THE PORTFOLIO EFFECT AND THEFREE LUNCHEconomics in nine words –There ain’t no such thing asa free lunch.111234JIM CRAMER – “MAD MONEY”Describes diversification as the onlyfree lunch on Wall StreetBut as economist Milton Friedmanwas fond of saying “There’s no suchthing as a free lunch.”PORTFOLIO EFFECTNotion that you can fund to a lowconfidence level for individualprojects but achieve highconfidence for the portfolioExample – fund 10 individualprograms to 60% confidence levelto achieve 80% confidence for thetotal portfolioHYPOTHESIS VS. REALITYWhen you incorporate realisticassumptions, the portfolio effectvanishesEven possible to have a negativeportfolio effectDEVIL IS IN THE TAILSWhen funding to percentiles, it isalways at the 80% confidence levelor belowThis is not in the tails – real risks areat the 90-95% confidence levels andabove
123412A NOBEL IDEAHarry Markowitz pioneered the ideaof the benefits of diversificationLed to the notion of trading risk withrewardTHEORY VS. REALITYPrior to Markowitz, diversificationwas frowned upon on Wall StreetHighly successful investors likeWarren Buffet only hold a fewinvestments at a timeTHE BENEFITS OF DIVERSIFICATIONDEPEND ON RISK VS. REWARDPoll: Does yourorganizationconduct portfoliorisk analysis?a. Yesb. NoINVESTING IN JUNKMichael Milken sold investors on theidea that if you invest in enoughhigh-risk investments, your overallinvestment is not riskyThis approach led to the failure ofExecutive Life Insurance Companyin 1990SKEWED RISKSMore can go wrong than go right entropyFunding below the mean leads to anegative portfolio effect – addingprograms increases risk ofoverrunning total budget“Behold the fool saith, ‘Put not all thine eggs inthe one basket’ - which is but a manner ofsaying, ‘Scatter your money and your attention;’but the wise man saith, ‘Put all your eggs in theone basket and -WATCH THAT BASKET.’”- Mark Twain
HC SVNTDRACONESHunt-Lenox Globe is one of theoldest known still in existenceContains the Latin phrase “HCSVNT DRACONES” (Here BeDragons) near the eastern coastof AsiaRepresents unknown areas,which have risk and uncertainty13
123414CONFIDENCE LEVEL FUNDING ISFLAWEDOnly measures riskDoes not provide any riskmanagementConsequence of extreme events isignoredPASCAL’S WAGERConsequence vs. likelihoodEven if perceived likelihood of God’sexistence is low, consequence ofunbelief if He exists is hugeRational bettor should bet on GodTHE LOGNORMAL PARADOXLognormal is riskier than theoverused “normal” distributionWhen funding to low levels (below84% confidence level), “normal”appears riskier than the lognormalBEYOND S-CURVESConfidence levels do not take tail risksinto accountCoherent measures of risk take intoaccount tail risk and provide riskmanagementExamples – Expected Shortfall, SemiDeviationHERE BE DRAGONS –CONSIDERING THE RIGHT TAIL INRISK MANAGEMENTPoll: To what riskmeasure does yourorganization fundprojects?a. Meanb. 50th Percentilec. 80th Percentiled. Othere. N/AImage: Courtesy of the James Ford Bell LibraryFunding to the 80th percentile islike playing Russian Roulette –consequence is more importantthan likelihood.
TRYING TO DO TOO MUCH WITHTOO LITTLE15“We have met the enemy andhe is us” cartoon characterPogo, by Walt Kelly1234TRAFFIC JAMSTraffic jams in big cities are oftencaused by too many cars on theroad at peak times (rush hour)TOO MANY PROJECTSTrying to fund too many projects withlimited information is like too manyvehicles on the roadOrganizations start new programswith little money but as theyprogress they need more fundsCheaper to conceive a child than toraise oneRESULT – COST ANDSCHEDULE GROWTHToo many programs cause fundingconstraintsFunding constraints cause scheduledelays, resulting in cost growthPORTFOLIO MANAGEMENTThere is a critical need for portfoliorisk managementRarely done at all
123416MONEY ALLOCATED ISMONEY SPENTTHINKING STRATEGICALLYWriting a contract to a high confidencelevel will lead to all the funds gettingspentNeed to hold some of the funding inreservePerverse incentives in cost-plus contractsASYMMETRY OF INCENTIVESAND INFORMATIONHidden informationIncentive for contractor but none forgovernment (“skin in the game”)MONOPOLY IN PRODUCTIONGovernment does not purchasedata rights, so system developer is amonopoly producerLeads to higher cost and lowerquantities – deadweight lossMECHANISM DESIGNTurns game theory on its headDesign game to achieve desiredoutcomesCan be used to achieve lower pricesand higher quantities in bargainingwith monopoly“There is all the difference betweendeliberately creating a system within whichcompetition will work beneficially aspossible and passively accepting institutionsas they are.” Friedrich Hayek, The Road toSerfdom
WHAT CAN BE DONETHREE KEYS TO SUCCESS1: RECOGNIZE THEPROBLEMRecognize that lack of planning for risk leads tohinders projects successDon’t plan for best caseRealize that you are prone to biases such asoptimism – don’t drink the Kool-Aid!Look for independent and critical input2: MEASURE RISK MOREACCURATELYRecognize that risk is underestimated, especiallyearly in planningQuantitative risk measurement is a necessity –3: MANAGE RISKEFFECTIVELYProjects need to manage risk, not justmeasure itNeed a measure of risk plus ways to addressmatrices and qualitative methods are notsignificant growthenough!Calculate risk at the portfolio levelUse methods such as calibration to ensureAssess the impact of potential new missionsrealismover a long time frameMeasure risk coherently – S-curves are notThink strategicallysufficient! Take the right tail into account17Projects must do things differently in risk management if they want to be more successful
ABOUT THE AUTHOR Chief Scientist with Galorath Federal Former Cost Director for Missile DefenseAgency Twenty years of experience with cost andschedule risk analysis, predictiveanalytics, probabilistic reliability analysis,and machine learning Exceptional public service medal fromNASA Named Parametrician of the Year by theInternational Society of ParametricAnalysts Ph.D. in Applied Mathematics Contact: csmart@galorath.com18
proper risk management Risk is often considered just another a four-letter word QUANTITATIVE RISK ASSESSMENT Projects need to conduct quantitative cost and schedule risk analysis The application of quantitative methods is fraught with obstacles HOW TO DO IT BETTER This book, written for a general project management audience, discusses these .


