Transcription
Insert Picture Here Adding Risk Measurement to Enterprise PerformanceManagement AnalyticsA short demonstration of Oracle Crystal Ball and Hyperion Planning – DriverBased Forecasting
In this example, we use Hyperion Planning to calculate our Cost of Sales for nextyear. We’ve calculated our cost of sales for FY10 at 1,925,227,236. Presentingthis to Management, we’ve been asked two questions:1) How likely is it that cost of sales will exceed this number?2) Which drivers are the most important in this model?Let’s apply two simple risk analysis techniques to answer these questions.
First, we know that many of the inputs in this model are uncertain. For instance,we don’t know for sure, what the market size is, or what the commodity priceindex will be. Instead of using just a single number, these inputs – assumptions –would be better represented by ranges of numbers.So let’s do that. Let’s define assumptions for all the inputs that are uncertain.
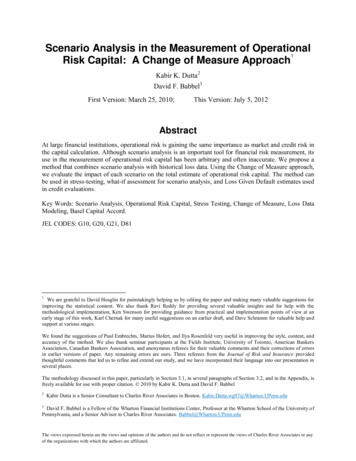
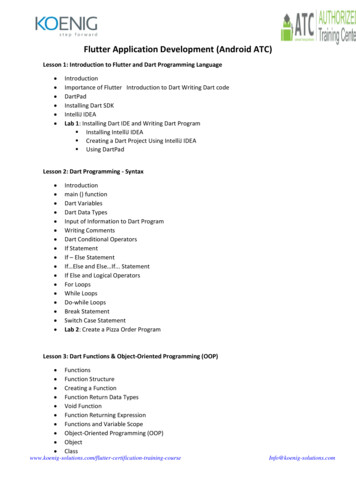
We’ve defined our firstassumption (Q3 market size)as a triangular distributionwith parameters as shown forminimum, likeliest andmaximum.We can define these parameters in two ways: first, if we have historical data for market size, we could use varioustools in the software to automatically define the distribution and its parameters. Or, if we have no data, we can usesubject matter expertise – our best estimates – to manually enter the parameters in the pop-up.We define assumptions for:Market size; Market share; Renewal rate; Number of new contracts; Utilization rate of consultants; Training as a % ofsales and Commodity price index.
Next, we tell the software which output – the forecast – we’re interested intracking. In this case, we want to analyze the cost of sales. If we can compute theprobability of that calculated metric, we can answer our first question – how likelyis it that costs will exceed the number?In our example, we’re forecasting the FY10 year total cost of sales.
We define this cell as the Forecast.
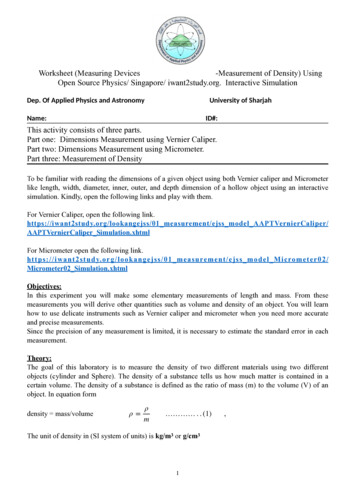
Now we’re ready to run our risk analysis. We’re going to use a statistical techniquecalled Monte Carlo simulation to calculate hundreds or thousands of trials. Eachtrial will be a different permutation of the inputs. Sort of like looking at thousandsof different possible future results. The software will track all of these trials andfrom them, compute the probabilities and statistics we need to finish our analysis.We can see just from the first 10 trials that thereis quite a range of possible outcomes. Let’sfinish running all 500 trials.
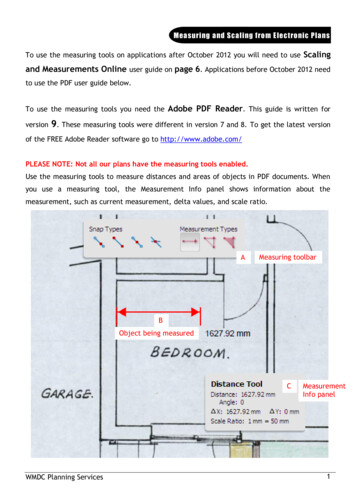
The forecast chart shows the results of all the 500 trials. This is the full range ofpossible outcomes for Cost of Sales, given the uncertainty inherent in our modelinputs.Now let’s answer that first question:How likely is it that cost of sales will exceed this 1.925B?
The answer:There’s a 66% likelihood that our costs will in fact exceed our estimate. This couldhave a serious impact on the business. We need to understand more.It’s time to answer the second question: Which drivers are the most important inthis model? If we can get a better handle on those, we would know where tofocus our efforts to reduce the risk.
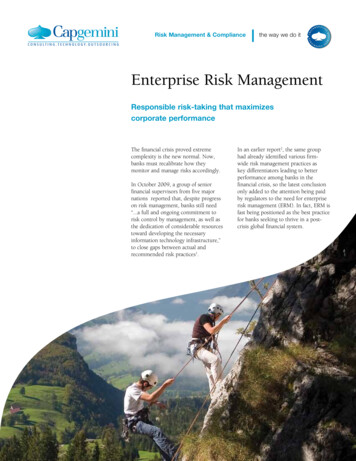
Let’s open another chart, called a sensitivity chart.
We see that of all our variable assumptions, training and market share account for 90% of the variability –the risk – in the cost of sales.Now we know that if we can reduce the uncertainty around those factors, we will reduce the risk ofexceeding our planned costs.So in a few short minutes we’ve substantially enhanced our planning capabilities by adding a measure of riskas well as using the results of the simulation to gain insight into the most important drivers.Additional elements of the risk analysis software, which we are not showing in this particular demo, can helpus optimally choose scenarios – such as exactly how much to spend on advertising to customers to boostthose training classes.
In our demonstration, we’ve just seen thatadding the ability to measure the uncertainty– the risk – around forecasting numbers willimprove the accuracy and confidence aroundthose numbers, as well as give insight intowhich drivers are truly important.
FOR MORE INFORMATION CALL US:888-879-8440 (Toll-Free) 514-278-2221 (Local) 514-278-5060 (Fax) VISIT US ON THE WEB:www.technologypartnerz.com
Adding Risk Measurement to Enterprise Performance Management Analytics A short demonstration of Oracle Crystal Ball and Hyperion Planning -Driver Based Forecasting. In this example, we use Hyperion Planning to calculate our Cost of Sales for next year. We've calculated our cost of sales for FY10 at 1,925,227,236.