Transcription
Introduction to Operational RiskModelling21 September 2015
DisclaimerThe views expressed in this presentation arethose of the presenters and not necessarilyof the Society of Actuaries in Ireland
Agenda Scope, Context, Basel II and Solvency IISome observations on UK experienceAdvanced Measurement ApproachOperational risk modelling in InsuranceExample of Loss Distribution ApproachOther considerations
Context“We made too many wrong mistakes” –Lawrence ‘Yogi’ Berra NY Yankees
People : Systems : Processes : External Events Operational risk events can damage/destroya company Good Governance, Control and Avoidance ofop risk is the first remedy Assessing exposure and capital is important– Operational risk modeling is about more thanjust that
Scope What’s in a model?– Internal Model– Standard formula/approach– Risk Scores– Scenario input/output Why Model .– Manage Monitor Rank Risks Risk Appetites/Mandates– Set Capital/Reserves– Assess and manage (Re) Insurance needs– Assess suitability of Standard Formula under Solvency II– Regulatory requirement/pressure for line of business
So many papers .Where to Start?An Operational Risk Profile: The Experience of British Firms Imad Moosa and Li LarryOperational risk management – a statistical perspectiveFrancesca Ieva; Anna Maria Paganoni; Stefano ZillerOperational Risk Management for InsurersTorre-Enciso, Maria Isabel Martínez; Barros, Rafael HernandezOperational Risks in Financial SectorsE. Karam; F. PlanchetInformation asymmetry around operational risk announcementsBarakat, Ahmed; Chernobai, Anna; Wahrenburg, MarkOperational risk Jarrow, Robert AOperational risk quantification: a risk flow approachFinke, Gandolf R; Singh, Mahender; Rachev, Svetlozar TTHIS IS JUST A SAMPLE!!Review of the Principles for the Sound Management of Operational RiskBank for International SettlementOctober 2014Operational Risk – Supervisory Guidelines for theAdvanced Measurement ApproachesBasel Committee of Banking SupervisionPrinciples for the Sound Management of Operational Risk- final documentBank for International SettlementPrinciples for effective risk data aggregation and risk reportingBasel Committee of Banking SupervisionScenario analysis in the measurement of operational risk capital: a changeof measure approachDutta, Kabir K; Babbel, David FA Theoretical Framework for Incorporating Scenarios into Operational Risk ModellingScenario analysis forBakhodir A. Ergashevmodelling operational losses in theCombining scenario analysis with loss data in operational risk quantificationabsence of data: the Spanish bank inCope, Eric WperspectiveModelling operational risk in financial institutions using hybrid Jiménez-Rodríguez, EnriqueJosé; Feria-Domínguez, Josédynamic Bayesian networkManuel; Martín-Marín, José LuisMartin Neil, Lasse B, Andersen, David Hager
Basel II Op Risk Capital ChargeRevisions proposed Oct 2014 not reflected above
Basel II CalibrationSo how did they come up with the a and bfactors?Working Paper on the Regulatory Treatment ofOperational RiskSept 2001 BIS.org Considered Median Ratio of op risk economiccapital to overall economic capital c 15% andminimum regulatory capital 12.8% (MRC 8 % ofreported risk-weighted assets )
Basel II Calibration Basic Indicator Approach Assume capital charge 12% minimumregulatory capital QIS data MRC and Gross income (GI) forbank j time t (1998-2000) 355 banks αj,t 0.12*MRCj,t / GIj,t α range 17-20%
Basel II Calibration Standardized Approach Assume capital charge 12% minimumregulatory capital, allocate to Lines ofBusiness βj,i 0.12*MRCj *OpRiskSharej,I / GI j,i OpRiskSharej,i is the share of bank j’soperational risk economic capital allocatedto business line i GIj,i is the volume of gross income inbusiness line i for bank j 30 banks
Solvency II SCRoperational
Solvency II Calibration CEIOPS-SEC-40-10 , 15 April 2010 4 Analyses/References considered, allindicated QIS4 factors too low1. Internal model data from 32 entities, 5 EUcountries - pre diversification charge2. CRO Forum Study double QIS4 parameters3. ABI study - QIS4, ICA 7 life 6 non-life, extensivespread of data including for example #FTE4. FSA - ICA data from 15 life 13 non-life
Solvency II Calibration Analysis 1 output (CEIOPS recommended)
Potentially useful observations“You can observe a lot just by watching” –Yogi Berra NY Yankees
Some Observations from UK Firms’ experience 163 major op losses 1999-20081. Loss Severity and frequency depend on business line andentity type2.3.4.5.6.The decline in the market value of a firm following the announcementof an operational loss may or may not be greater than the lossamount.Loss severity and the decline in market value relative to the lossamount are not necessarily greater when the loss results frominternal fraud.Loss severity does not depend on the announcing firm’s size.The decline in market value does not depend on the loss amount.The decline in market value relative to the loss amount is unrelated toleverage but it is positively related to size.Source An Operational Risk Profile: The Experience of British FirmsImad Moosa and Li Larry 2013
Some Observations from UK insurance experience #Events is proportional to Entity Size #Events is proportional to GWP– GWP up by Stn deviation ( 3.7bln) E(N) upby 25%– Low GWP p(N 9) 4%– High GWP p(N 9) 12% Severity is proportional to Entity Size Severity is proportional to FTE– 1% rise in FTE 0.8% increase in E(X)Source ABI Research Paper No. 16.pdf 2009
Basel II Advanced Measurement Approach1.2.3.4.Internal DataExternal DataScenario AnalysisBusiness Environment Internal ControlFactors (BEICF) Requirements–––––Data period (5 years)99.9% 1 year confidence intervalRules & Cap on insurance mitigationOther mitigation rulesGovernance frameworks, independent auditSupervisory Guidelines forthe Advanced Measurement Approaches (Basel Committee, 2011)
AMA: Internal Loss Data Estimation of loss frequencies Inform the severity distribution(s) to theextent possible Input into scenario analysis Limited tail events external /scenario
AMA: External Loss Data Complement internal data to model severity More tail info Input into scenario analysis
AMA: Scenario Analysis Inputs include– Internal data– External data– BEICFS Forward looking view of op risk exposures Requires scenario framework Deal with Bias – e.g. anchoring
AMA: Business Environment & Internal Control Factors Internal/External data retrospective BEICF are operational risk managementindicators Provide forward-looking assessments of– business risk factors– internal control environment To assist parameterizationInform Ex-post adjustmentsServe as inputs into Scenario AnalysisJudgement
Basel II Insurance optionsSome Options Bankers Blanket Bond Commercial GeneralLiability Computer Crime Cyber D&O Electronic Insurance Keyman Kidnap & Ransom ProfessionalIndemnity/Civil Liability Property Terrorism Unauthorised TradingAMA requirements Policy term minimum 12 months Cancellation period not less than 90 days No exclusions triggered bysupervisory/receiver’s/liquidator’sactions Claims paying ability of “A” or equivalent [Clear cancellation and non-renewalperiods] Policy coverage mapped to the actualoperational risk exposure being modelled Coverage by 3rd parties.Mitigation allowance capped 20% capital
Insurance Modelling ApproachesNinety percent of this game is half-mental –Yogi Berra NY Yankees
Modelling Approaches Hybrid Models - Scenario Analysis combinedwith loss data analysis Solely Scenarios Solely Loss Data Analysis based model Single loss estimate (sum of scenario lossestimates) Bayesian Networks (address dependency issues)
Back to data
Loss Data Internal loss database External– Consortium based ORIC (insurers UK, mostly Life) ORX (banks mostly)– Vended databases (public, proprietary)– Publicly available data
Loss Data Issues Internal loss database– Limited data– Bias External– Truncated data (losses below threshold notrecorded e.g. ORIC 10k)– Mix of risk profiles not matching Firm’s– Scaling issues– Selection biases– Classification inconsistencies
Data Adjustments & Scaling– Internal Inflation Changes to business Changes to control framework impacting onincidence/severity Classification changes Consistency treatments for groups e.g. currency– External Scaling for Entity size Inflation Risk Profile of entity
Some Distributions Frequency– Poisson– Negative Binomial– Others – Binomialetc Severity ed ParetoGeneralised Beta– Parent (body)– Child (heavy tail)EVT
Loss Distribution Approach Discrete frequency distribution Conditional severity distribution Convolution to put them together
LDA how to1. Fit distributions to loss data and decide onparameters1. Freq2. Severity2. Decide on simulation count e.g. 100k3. Get random numbers4. Inverse transform functions for Freq andSeverity from random number set5. Model outcomes for each sim6. Take stats
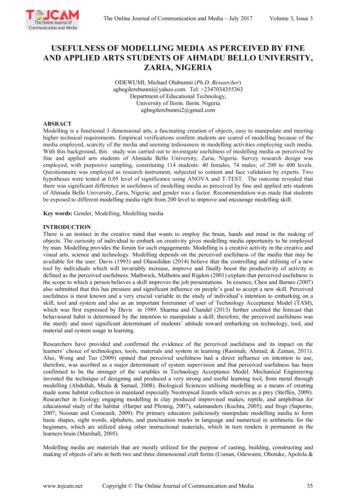
LDA simulation kernel: frequency For each simulation Frequency: 101112131415161718Lookup the frequency by referencing the CDFusing the uniformly distributed random numbergenerated for that Simulation iterationSay the random number is .54This corresponds with a frequency of 2 - it’sbetween F(2) .406 and F(3) .676So we need to simulate the severities for 2losses
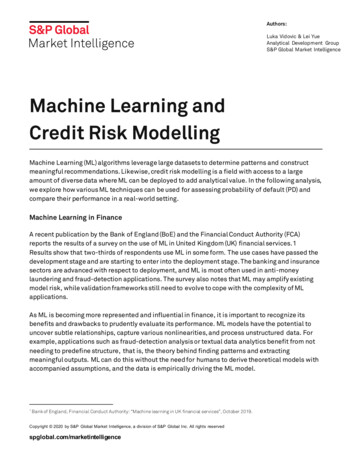
LDA simulation kernel: severity We have 2 losses for this simulation Inverse transform on a new random number togenerate the loss in each case– Bit more complicated than the frequency partSeverity: LogNormalMeanStd DevMinMaxParameters100005000600020000Loss Generator Function- LogMean- LogSD- ln(min)- .014720.999350.98464Exp(LogMean LogSD * NORMSINV(qMin DeltaQ*RAND()))
LDA simulation kernel: severity Record and sum the 2 losses to get the result forthat simulationSim #SimulatedNumber of lossesResult120,156.35Simulated Loss for each Simulated Loss Event123210,2179,9404 Repeat for number of simulations Sim #SimulatedNumber of 35.7210,132.4310,034.239,917.1625611101Simulated Loss for each Simulated Loss Event1234510,2179,9409,8679,8669,941 10,214 ,91769,908
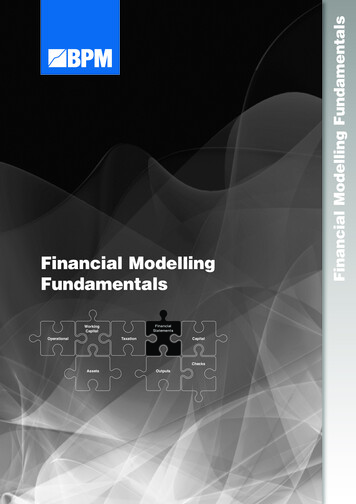
LDA: Results : LogNormalMeanStd DevMinMaxAverage #Max #Lossesfrom any sim2.004Min LossMax Loss6,00019,993S ResultsS # LossesMean 0600020000Loss Generator Function- LogMean- LogSD- ln(min)- .014720.999350.98464Exp(LogMean LogSD * NORMSINV(qMin DeltaQ*RAND()))Frequency: 101112131415161718
Tail ‘Child’ Distribution Extreme Value Theory (‘EVT’)Binary Events: Low probability High impact
EVT: Blocks
EVT: Peaks Over Threshold
CheckpointWe’re lost but we’re making good time –Yogi Berra NY Yankees
Scenario Analysis Internally Generated Scenarios– Delphi– Interviews External– Group Scenario database– Regulator list of scenarios– 3rd party scenario database
Scenario Analysis Expert Risk Identification– Risk identification via workshops etc– ILD/ELD - risk assessments Scenario Analysis– Frequency– Modal loss– Worst Case Loss Capital modelling based on Scenario Analysis Review and rework
Aggregation Var/covarGaussian copulaSumT-copulaOther (expert judgement hybrid methods)
Allocation Across Business lines Across Entities Scalar Risk adjusted (KRIs, RCSAs)
Validation Approaches Plausibility checks - do results/changes inresults tie up with what’s happened to thebusiness/in the world Sensitivity Analysis Back Testing Replication - independent model /data toget similar results Expert Review
Questions?If you ask me a question I don't know,I'm not going to answer–Yogi Berra NY Yankees
Introduction to Operational RiskModelling21 September 2015
Combining scenario analysis with loss data in operational risk quantification Cope, Eric W Modelling operational risk in financial institutions using hybrid dynamic Bayesian network Martin Neil, Lasse B, Andersen, David Hager Scenario analysis for modelling operational losses in the absence of data: the Spanish bank in perspective