Transcription
Operational Risk Metrization andScenario AnalysisHidetoshi NakagawaGraduate School of Innovation Management, Tokyo Instituteof TechnologyA Workshop on Scenario AnalysisJuly 18, 2006A part of this lecture has been derived from “A Theoretical Study and Empirical Analysis ofthe Operational Risk Metrization Approach,” a joint research project with Japan TrusteeServices Bank, Ltd. However, it does not mean that the technique described in this paperis Japan Trustee Services Bank’s risk metrization method. The views and details given inthis paper all belong to the author himself and do not represent the official views of theorganization to which the author belongs nor those of Japan Trustee Services Bank.
OUTLINE An Outline of the Advanced Measurement Method Practical Problems– A Review of the Extreme Value Theory-BasedApproach Is Scenario Analysis Effective?– Scenario Building An Example of the Scenario Utilization Method UsingExtreme Value Theory– Application of the POT Approach and theProbability-Weighted Moments Method2006/7/182
Relationship Between Nakagawa andOperational Risks While working at the MTB Investment Technology Institute(presently the Mitsubishi UFJ Trust Investment TechnologyInstitute Co., Ltd.), I proposed analyses of accident data and anoperational risk measurement model related to the parentcompany’s operational risks.– I also proposed and verified a model equipped with theOperationalRiskBrowser developed by Numerical TechnologiesIncorporated. I was responsible for writing Chapter 5 of and an appendix to“The Practice of Operational Risk Management,” compiled bythe Operational Risk Research Institute, Mitsubishi Trust andBanking Corporation.– I have delivered lectures and have written papersconcerning the contents of the above book.2006/7/183
An Outline of the Advanced Measurement Approach (1) Advanced Measurement Approach (AMA)– This approach is also referred to as the Loss DistributionApproach (LDA).– It is here defined as a method of measuring thevolume of operational risks, which are to beaccounted for in accordance with Basel II, with the99.9% Value at Risk (VaR) by identifying thedistribution of accumulated losses during a certainperiod of time, using internal accident data (orincluding external data and scenarios as the casemay be).2006/7/184
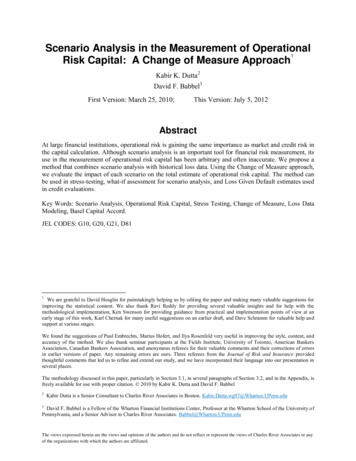
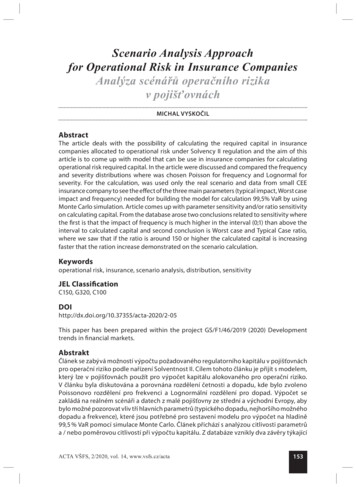
An Outline of the Advanced Measurement Approach (2) A Rough Flow Up To 99.9 VaR Measurement– Accident Frequency Rate (the Number of Accidents during a Given Period): For example, the number of accidents for six months or for one year isassumed to follow the Poisson distribution.– Amount of Loss (per Accident) during an Accident: For example, parametric distributions such as the logarithmic normaldistribution, the Weibull distribution and the Gamma distribution areapplied. An alternative approach is based on extreme value theory (EVT) toexpress a distribution of excess losses in excess of a certain thresholdusing the Generalized Pareto Distribution (GPD). An empirical distribution (a non-parametric distribution) is sometimesassumed.– By combining the above two factors, a distribution of cumulative losses for acertain period of time is assumed and the 99.9% point of this distribution isobtained as the operational risk VaR.– Methods to obtain the accumulated loss distribution include: A method of generating numerous random number scenarios foraccumulated losses through the Monte Carlo simulation technique andobtaining a histogram of cumulative losses A method of obtaining a stochastic distribution of cumulative losseswith a mathematical technique (approximately) using Panjer’s recursionformula and the characteristic function2006/7/185
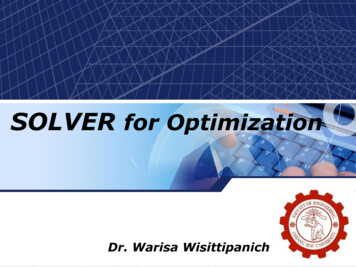
An Outline of the Advanced Measurement Approach (3)LN(1,2) Frequency Rate Distribution: – Poisson Loss Distributions:– Logarithmic normaldistribution– Weibull distribution– Gamma distribution– .250.20.150.10.050012345456Gamma(4,1)0.259 10 11 12 13 14 � GPD(POT approach)applies to a high lossportion.– A non-parametric method00Cumulative Loss ModelComposite Poisson ModelMonte CarloSimulation123456GPD (Probability Weighted Moments 5318603456764959460106
An Outline of the Advanced Measurement Approach (4) Method of Measurements of Operational Risks with theAdvanced Measurement Approach*In a preliminary step, it is necessary to determine whether the methodapplies to each business line/event type or measurements are madethroughout the bank.① Determination of a Model:– Determination of the Accident Frequency Rate and a Distribution ofLosses– Determination of a Method to Calculate a Distribution of CumulativeLosses– If the POT approach is used, a threshold to distinguish between lowlosses and high losses should be determined.② Estimation of Parameters Contained in a Model:– Average ( Dispersion) Parameter for the Poisson Distribution– Parameter for a Distribution of Losses2006/7/187
Practical Problems (1) Questions Concerning Determination of a Model:– Is it proper to consider that the average accident frequency rate foreach period of time is constant? ( Is the use of distributions otherthan the Poisson distribution not possible?)– What distribution is a proper distribution of losses?– Is it right to consider that the frequency rate, the amount of lossesor the continuous amount of losses is independent?– When risks are calculated for each cell, what is the dependentrelationship between cells?– When the POT approach is used, how is a threshold established?2006/7/188
Practical Problems (2) Questions Concerning Estimation of ParametersContained in a Model:– Should the number of accidents be considered on an actual lossbasis or should we include deemed accidents?– How should we consider the cases where the figures for losses areremaining at an unchanging level?– Given that few data are available in the first place, is the accuracyof estimation with the maximum likelihood method assured?– If other parameter estimation methods are used, to what extentwould these methods allow an estimated value to be obtained?– Can we apply the POT approach in a situation when we do nothave ample data on large amounts of losses?2006/7/189
Practical Problems (3) As possible solutions to some of the questions:– Is the use of scenario analysis effective?– Or when we consider combining the advanced method withscenario analysis, can we determine a proper model and anestimation technique as a matter of course? From my own personal viewpoint,– Scenario analysis and the measurement method using internal lossdata should essentially be considered separately and shouldpreferably be treated as complementary to each other.– Combination with scenario analysis may not make it easy to apply aparametric method.– However, a method of combining scenarios (including scaledscenario of external cases) with internal data and calculating theoperational risk 99.9% VaR with a parametric technique may not betotally impossible.An example of an EVT-based approach to calculate the VaR of operational risksusing external data and high-loss data including scenarios only will be explainedlater.2006/7/1810
Scenario Building (1)Three Pillars of Basel II: – Minimum capital requirements - Refinement of risk measurements– Supervisory review - Banks’ own risk identification, assessment,surveillance and management systems– Market discipline - Reinforcement of information disclosureThe same holds true for market and credit risks and particularly as foroperational risks, we cannot benefit much from solely looking into riskquantification techniques.It is important that the bank should formulate a risk managementframework and adopt a positive stance toward information disclosure.Quotations from the Conclusion by Embrechts-Furrer-Kaufmann(2003):Keeping in mind that most serious operational risk losses can not bejudged as mere accidents, it becomes obvious that the only way to gaincontrol over operational risk is to improve the quality of control overthe possible sources of huge operational losses.It is exactly here that Pillar 2, and to a lesser extent Pillar 3, becomesextremely important.2006/7/1811
Scenario Building (2)Purposes of Scenario Building:–(Directly) to supplement scarce data (particularly on highlosses): –Are scenarios consistent and affinitive with internal data?Is it sufficient to think in terms of scenario data only withoutregard to internal data?(Indirectly) to identify the sources of risks and their effectsin the bank’s operational processes: It is this purpose that is essentially important.To build a scenario going beyond the mere objective of riskmeasurementsSteps of Scenario Building:1.2.3.2006/7/18Collection of data from a bottom up perspective:–Data on loss accidents– Statistical data on workloads in each business unitCollection of external cases and consistency checks and scalingScenario building12
Scenario Building (3) Collection of Data from a Bottom Up Perspective:– Collecting and organizing internal data is essential for scenario building.– Building a proper scenario is impossible without an understanding of theinternal situation.– Although data on loss accidents should naturally be gathered, what is ratherneeded to build a scenario is statistical data on the gross workload in eachbusiness unit.– For example, data on the following components of operations in eachbusiness unit should be collected: Items of work for the operation Working hours and years of experience for employees engaged in theoperation Number of work processes and working hours per unit of item of work– Close relations between operations, if any, need attention.– Then, Past cases of accidents must be associated with the above elements;and Occurrence dates of accidents, approximate amounts of direct damage,and long-term indirect effects must be determined.These data should be recorded in a loss database.2006/7/1813
Scenario Building (4) Collection of External Cases and Consistency Checkups andScaling:– Not only the cases of financial institutions but external casesinvolving huge losses should also preferably be used as data tobuild a scenario, including background and results. Human errors may largely depend on the characteristics offinancial operations but can also be considered in terms ofgeneral factors, such as fatigue and overconfidence. Likewise systems errors may be attributable to the specialcharacteristics of systems used in the financial industry butstability may be considered to show a certain tendency like theso-called bathtub curve.– Consistency checkups are conducted in order to examine the extentto which the background and the causes of the external casescollected will occur at the bank.– Scaling is carried out when adjustments in the amount of losses inthe external cases are desirable after consideration of the bank’sworkloads and the amount of its transactions. The conservativeposition may allow using the large amount of losses as it is.2006/7/1814
Scenario Building (5) Scenario Building– Even if risk management is to build a scenario, theaccounting staff should be held responsible for the building ofa scenario.– Scaled external loss data are to be compared with thefrequency rate. It is necessary to estimate the frequency rate of at least “once inso-and-so years.” Data such as systems errors may be associated with the timeelapsed since the startup of systems. Events that may occur simultaneously or in succession can bealso taken into consideration.– For quantitative data, at least the following four items needattention:・Business line ・ Event type ・ Amount of losses・ Frequency rate– If possible, Dependent relations, etc.2006/7/1815
Scenario Building (6) Scenario Building (Specific Examples and Interpretation)– For example, a scenario assuming that “the presumed amount of loss comesto 1 billion and this loss is likely to occur once in every twenty years” isestablished in a cell (a combination of a business line and event type): This scenario is quite different from the assumption that “the presumed amount ofloss is 50 million and this loss is likely to occur once a year or so.” Supposing that the average number of accidents per year in this cell is 50 cases, itis interpreted that approximately 1,000 accidents are expected to occur in twentyyears’ time and one of the accidents (the worst case) causes 1 billion in loss.– A natural interpretation is that the probability of the amount of loss from theaccident exceeding 1 billion is 0.1% or so.– Conversely speaking, does it mean that the 99.9% VaR for the cell is literallyset at 1 billion? An ideal approach should allow giving the anticipated frequency of “once in everyso-and-so cases processed” or “once in every so-and-so working hours” from thebottom-up analysis, rather than “once in so-and-so years” .– A possible approach is to analyze the accident occurrence pattern from theperspective of the study of failure.– Is overwork or inattention the cause of error?– Is a newly installed system unstable?– What about a planned change in the business style?2006/7/1816
Scenario Building (7) Scenario Building (How to Use Data)– How to use scenario data: A risk audit system that allows you to build a good scenario may well bean important asset for risk management. An extreme case should be considered through stress testing byincluding correlativity. A distribution of losses per case is estimated in combination with internaldata.– It is doubtful whether the two factors could be used on an equal footing. A proposed method is (although it is not statistically recognized):– First of all, internal data are arranged in ascending order of the amount ofloss and a probability based on the corresponding cumulative experiencedistribution is given to each loss data.– Since scenario data are based on the assumption that the anticipatedprobability corresponding to the amount of loss is given, the pair of theamount of loss and the anticipated probability are fused with internal data.– Based on the fused data set, a distribution of losses is estimated. However,attention should be given to the possibility of difference between the scenariodata and the estimates.2006/7/1817
An Example of the Scenario Utilization Method UsingExtreme Value Theory (1) 2006/7/18When VaR is regarded as a measure of risks, a major influencemay come not from an accident involving low losses but from a“huge” loss accident, if it occurs infrequently.In this case, it may be reasonable to focus critically on the lowerright part of the distribution, rather than to build a refined modelfor the whole distribution of losses.Application of Extreme Value Theory (EVT)This is a common theme in papers discussing the metrization ofoperational risks from the perspective of a statistical approach.A model that applies a method called the Peak-Over-Threshold(POT) approach is described here.18
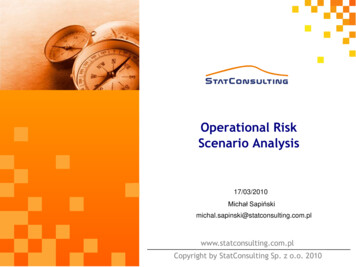
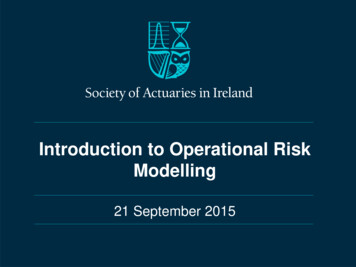
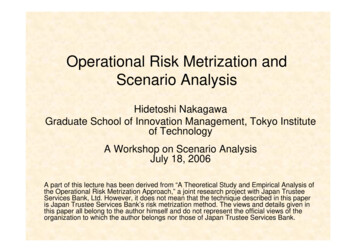
An Example of the Scenario Utilization Method UsingExtreme Value Theory (2)Whole DataA Schematic Description of the POT Approach12000010000080000Only data in excess of thethreshold set at 10,000 relativeto a certain data set arehandled.6000040000200000An excess above the thresholdof 10,000 is shown.Excess Data Set (Threshold 10,000)12000010000080000600004000020000An empirical distribution ofexcesses is prepared byarranging excesses inascending order and assigningappropriate probability to theseexcesses ( in the figure).0Excess Above Threshold and Empirical 6/7/1880000GPD(0.25,13000)100000120000140000This empirical distribution ofexcesses is approximated bythe Generalized ParetoDistribution (GPD).19
An Example of the Scenario Utilization Method UsingExtreme Value Theory (3) Distribution function in the Generalized Pareto Distribution: ξ 11 β G ( x; ξ , β ) 1 exp ξ1x (ξ 0) x (ξ 0)β x 0 (ξ 0) , β 01 x0(ξ0) ξ – Asξ increases, the base becomes thicker (even the average doesnot exist when ξ 1). Excess distribution function (relative to u):X : As a probability variable representing the amount of loss from the accident :P( X x u ) P( X u )P( X u x X u ) P( X u )2006/7/1820
An Example of the Scenario Utilization Method UsingExtreme Value Theory (4) Theoretically no matter what original loss distributionmay be, the excess distribution function relative to asufficiently high threshold u can be approximated byGPD (as long as certain conditions are satisfied).P ( X u x X u ) G ( x; ξ , β )for x u– However, a threshold must be determined carefully becausethe theory does not specify the degree of u.– For the sake of accuracy, it is desirable to verify the validityof the empirical distribution of high loss data and GPD bycarrying out goodness-of-fit tests such as KolmogorovSmirnov and Anderson-Darling tests.2006/7/1821
An Example of the Scenario Utilization Method UsingExtreme Value Theory (5) What to do with a method of estimating parameters for GPD ・・・– Maximum Likelihood Method: If numerous samples are available, an estimate will have a theoreticallydesirable nature but what if small samples and identical numbers areobtained in clusters? When estimating parameters using a scenario, it is difficult to simplyapply this method if scenario data are treated similarly to internal data.– Moments Method: This method is often used to estimate parameters when few data areavailable. This method cannot apply to some distributions in which moments ofhigher degree do not exist (e.g., when ξ 1 in GPD). When estimating parameters using a scenario, it is difficult to simplyapply this method if scenario data are treated similarly to internal data.– Least Square Method (calibration rather than estimation): Given an equal weight, entire goodness of fit increases but there mayrather be a larger discrepancy to occur at the low-frequency and highloss portion that is important in risk management. If a scenario is used, this method distinguishes it from internal data bythe size of “an empirical cumulative probability.”2006/7/1822
An Example of the Scenario Utilization Method UsingExtreme Value Theory (6) Probability-Weighted Moments Method– This is a method of obtaining a parameter as a solution to an equation, aswith the Moments Method, by determining an expected value that isweighted by the exponentiation of the probability of a value exceeding avalue calculated from the presumed probability distribution (this probabilityshould be very low) and comparing it with a value derived similarly fromactual data.– This method is applicable when moments of higher degree do not exist. Itis reportedly empirically effective when small samples are given. However, it is difficult to apply this method unless the followingexpected value can actually be calculated:E[ Z (1 F ( Z ;θ )) r ] ( Z: Probability variable, F: Distribution function that Z follows)– The way “an empirical cumulative probability” is determined has aninfluence on the results (arbitrariness is involved): It is related to an assessment of the frequency rate of external data. The results of estimation with a scenario incorporated may likely bedifferent from the original scenario.2006/7/1823
Conclusion (1) An optimum combination of a distribution and anestimation method cannot be presented in generalterms:– Supporting with a statistical theory is difficult.– There are no absolute criteria. Is it good to remain at the same level as it was or should itbe overestimated? Difficult estimation of a distribution of losses usingexternal cases and scenarios:– Can scaling and an assessment of the incidence rate beimplemented properly?– The application of a huge loss case may have a very largeimpact on the estimation process and result in leaving amodel out of consideration.2006/7/1824
Conclusion (2) There may probably be no complete model.– Continuous discussion about an operational risk metricmodel will lead to gradual improvements in methods.– The business process should be scrutinized and, at thesame time, the forecasting of errors based on the study offailure, psychology and systems theory must be adopted.– In the final analysis, it is necessary to fully analyze the dataon accidents both qualitatively and quantitatively. Theremust be a system under which wisdom is shared to addressthe issue not as a problem for individual financial institutionsbut as a problem for the financial industry as a whole.2006/7/1825
REFERENCES 2006/7/18Embrechts, P., Klüppelberg, C., Mikosch, T., “Modelling ExtremeEvents”, Springer (1997)Embrechts, P., Furrer, H., Kaufmann, R., “Quantifying RegulatoryCapital for Operational Risk. Derivatives Use”, Trading & Regulation9(3), 217-233 (2003)Frachot, A., Georges, P., Roncalli, T., “Loss Distribution Approach forOpérational Risk”, Working Paper, Groupe de RechercheOpérationnelle, Crédit Lyonnais (2001)King, J. L., “Operational Risk: Measurement and Modelling” , JohnWiley & Sons (2001)– “Operational Risk Management,” translated by Saito, Haruhiko,Oguro, Naoki, Sigma Bay’s Capital (2002)Operational Risk Research Institute, Mitsubishi Trust and BankingCorporation, “The Practice of Operational Risk Management,” ToyoKeizai Shinposha (2002)26
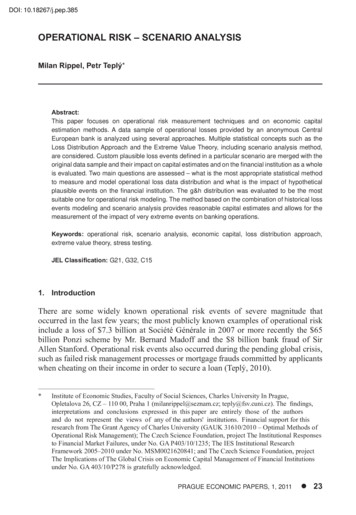
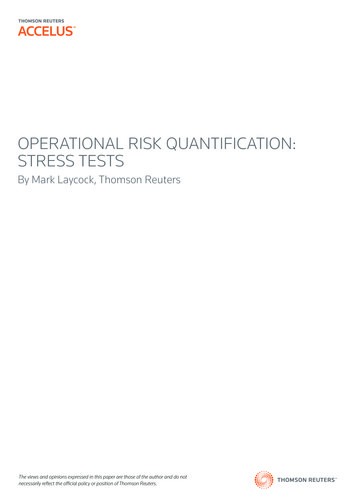
Reference: Poisson Distribution Probability of an event taking place k times:P (k ) e λ λkλ 0,k!The Poisson distribution is used as a demonstrative frequency ratemodel when the probability of an event is low and the event occurs dueto an independent factor or factors.The average and dispersion parameters both are expressed by theintensity parameter λ.Possible extended applications are to make the intensity parametertime-dependent such as λ(t) and to use the estimates of external data.– Seasonality, the startup of a new business, and the expansion of businessoperations are taken into /18123456789 10 11 12 13 14 1527
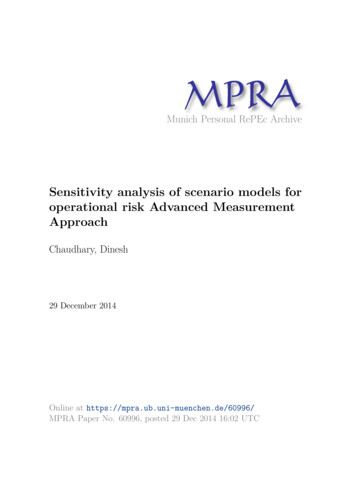
Reference: Logarithmic Normal Distribution (log x µ ) 2 f ( x; µ , σ ) exp 22σ2π σ x log x µ F ( x; α , β ) N x 0, σ 0 σ 1 This distribution is used, for example, to represent a distribution offuture stock prices in financial engineering.It is easy to handle for a model that has a distribution with a thick tail.LN(1,2)0.60.50.40.30.20.1002006/7/18123428
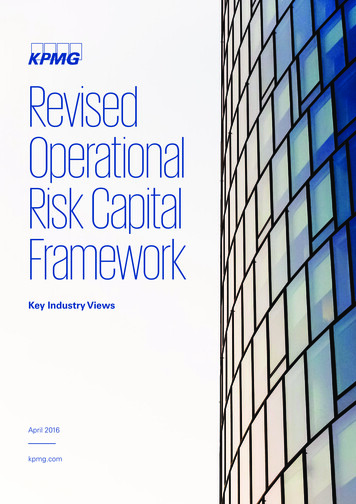
Reference: Weibull Distribution x α α 1f ( x;α , β ) α xexp β β α xF ( x ; α , β ) 1 exp β α x 0, α 0, β 0It is used for survival analysis, for example.The density function shows a tendency that the greater α is, the steeper theslope becomes, and the smaller β is, the greater the degree of 0.05002006/7/1812345629
Reference: Gamma Distributionf ( x;α , β ) Γ( x ) 0 x α 1xexp αβ Γ (α ) β 1x 0, α 0, β 0e u u x 1duIt is used for survival analysis, for example.The density function shows a tendency that the greater α is, the gentler theslope becomes and the thicker the tail 45630
Reference: POT Approach (1)The distributi on function for the whole is given as F(x).(Although F(x) must meet some conditions , a well - knownfunction poses almost no problem. ) A threshol d is given as uand the excess distributi on function for H relative to u isconsidered :F ( x u ) F (u )Fu ( x ) 1 F (u )Then, when Fu (x) is u x F : a theoretic al end,it is known that a certain ξ, β can be uniformly approximat edby GPD : ξG ( x; ξ , β ) 1 1 β2006/7/18 ξ1x (u x x F )31
Reference: POT Approach (2)Here, for x u, the distributi on function can be expressed bythe approximat e expression :F ( x ) (1 F (u ))G ( x u; ξ , β ) F (u )When the number of data for the whole is given as N andthe number of data exceeding the threshold u is set as n(u),n(u)then F(u) can be approximat ed by 1 NUsing this, the function is approximat ed as :n (u ) x u F ( x) 1 1 ξN β 2006/7/18 1ξ( x u)32
Reference: POT Approach (3) An Estimation Approach Using the Probability-WeightedMoments (PWM) Method Relative to GPDF(x; ξ, β) is given as the distribution function for GPD.Z is the probability variable that follows this distributionfunction. Thus it should be noted that for the natural numberr(the number satisfying r 1 ξ 0) the following equationholds true :βE[ Z (1 F ( Z ; ξ , β )) r ] (r 1 ξ )(r 1)On the other hand, the data x1 , L , x N (arranged in ascending order)is assumed to follow GPD. Where,1wˆ r N2006/7/18N x (1 F ( x ; ξ , β ))nrnn 133
Reference: POT Approach (4)Here when the uniform random number sequence U1 L , U N (arrangedin ascending order) on (0, 1) is taken, it is known that the following nature holds true(Quantile transformation lemma) :(d )( F ( x1 ; ξ , β ),L , F ( x N ; ξ , β )) (U1 L , U N )Therefore, it can be considered as :1 Nwˆ r xn (1 U n ) rN n 1Actually, instead of the uniform random number sequence,the plotting points :pn N n δnN n 0.5or generally pn NN γ nare given as appropriate values.2006/7/1834
Reference: POT Approach (5)Finally,1 Nwˆ r xn (1 pn ) rN n 1is regarded as " the probability weighted moment of the sample" ,a theoretical value and an equation are generated, and a solutionto this equation is given as an estimate.In the present analysis, ξ 1 is assumed (namely theaverage exists), and with r 0,1, an equation is created. An estimatecan be obtained as :2 wˆ 0 wˆ 1wˆ 0, β 2 ξ 2 wˆ 0 2 wˆ 1wˆ 0 2 wˆ 12006/7/1835
- Combination with scenario analysis may not make it easy to apply a parametric method. - However, a method of combining scenarios (including scaled scenario of external cases) with internal data and calculating the operational risk 99.9% VaR with a parametric technique may not be totally impossible. Practical Problems (3)