Transcription
Calculating Forest ValuesSummarizing timber value by stand typeand accessibility—by Glen JordanIntroductionProblemHow valuable is the Woodlot's standing timber, and how is that value distributed across types ofstands and between accessible and inaccessible stands?To answer these questions, you'll analyze the Woodlot's inventory of stands, looking for amounts ofsawlogs (pine, spruce, hemlock, white birch, tolerant hardwood) and pulpwood (spruce, fir,tolerant hardwood, intolerant hardwood). You'll use recent market prices for these products incompiling a summary of the value of broad stand types (softwood, hardwood, mixedwood).LocationA small, 1,400-hectare (ha) woodlot in the Acadian-New England forest region of North AmericaTime to complete the labThree hoursPrerequisitesA basic working knowledge of ArcGIS software and GIS data, including use of a geodatabase, and abasic working knowledge of Microsoft Excel, including pivot table calculation; some knowledge ofcomputer programming, Visual Basic (VB) in particular, and some familiarity with forest inventorydata and terminology helpful but not essentialKeywords: timber value; forest products; stand types; characterizing by a single number and a numerical distribution; selectingfeatures by attribute and location; using VB code in Field Calculator; summarizing an attribute
Calculating Forest Values: Summarizing timber value by stand type and accessibilityGlen JordanData used in this lab Feature classes and rasters for a forest woodlot (personal geodatabase)Geographic coordinate system: NAD 1983 CSRS New Brunswick StereographicDatum: NAD83 datumProjection: New Brunswick Double Stereographic Grid (unless otherwise stated)Student activityStanding timber values in a forest are often measured in terms of prevailing market prices forprimary wood products, such as pulpwood and sawlogs.Pulpwood is cut from smaller trees between 10 and 20 centimeters (cm) in diameter and deliveredin 2 to 2.5 meter (m) lengths to mills for debarking and processing into pulp and eventually paperproducts. Sawlogs, on the other hand, are cut from larger trees in lengths exceeding 2 m for deliveryto sawmills where they are debarked and processed into dimension lumber, such as two-by-fours.Any slab material is chipped and sent to a pulp (and paper) mill.Market prices for primary products vary by type of product and species of tree. For example, pinesawlogs usually fetch a higher price than spruce sawlogs and certainly more than hardwoodpulpwood.Not all standing timber in a forest is necessarily accessible, however. In assessing the value ofstanding timber in the Woodlot, you'll consider spatial distribution as well as product distribution,and then summarize your findings.Results expectedAn Excel summary table and chart summarizing Woodlot timber values by accessibility and broadstand types2
Calculating Forest Values: Summarizing timber value by stand type and accessibilityGlen JordanData available Cover types feature class: coverStand volumes table: volumesSecondary roads feature class: roadsSolution steps1.2.3.4.Calculate gross stand timber values.Calculate accessible timber values.Classify stands by type and access.Summarize timber values.C ALCULATE GROSS STAND TIMBER VALUESYour initial task is to calculate an overall timber value for the Woodlot, regardless of accessibility.To begin with, you'll need a dollar estimate of timber value in each stand, which can be calculatedby summing the product of stand area (ha), volume yields (m3/ha), and market prices ( /m3) foreach species or product type present. Where do you find these hectare, cubic meters per hectare,and dollars per cubic meter amounts?The volumes table in the Woodlot geodatabase provides cubic meters per hectare amounts byspecies and product type for each Woodlot stand, while the cover feature class provides stand areasin square meters. On the other hand, dollars per cubic meter amounts depend on prevailing marketdemand for the various species products.This means you have several things to do before you can compute stand timber values and then anoverall Woodlot value: you'll join the volumes and cover tables; convert square meter amounts tohectares; and finally, incorporate market prices (dollars per cubic meter).R ELATED C ONCEPT : C HARACTERIZING BY A SINGLE NUMBER1Start ArcMap and, if you haven't already done so, use Environment Settings to set the Woodlotgeodatabase in both the Current Workspace and Scratch Workspace boxes.2Add the cover feature class as a layer.Why is it useful to join the volumes table to the Cover Types attribute table? The volumes tablecontains, among other things, volume amounts (m3/ha) by species and three product types3
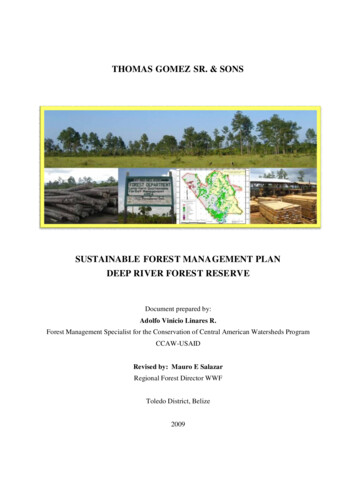
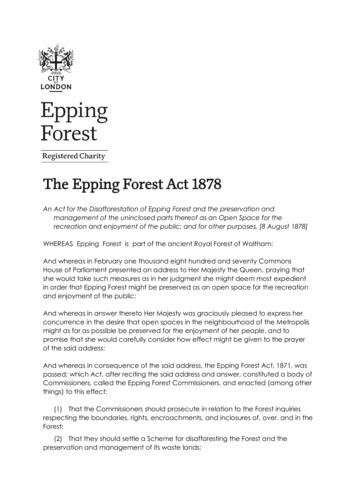
Calculating Forest Values: Summarizing timber value by stand type and accessibilityGlen Jordan(pulpwood, sawlog, and veneer) for each of the Woodlot's 533 stands. Attributes S P, S S, andS V indicate the volume yields (m3/ha) of spruce pulpwood, sawlog, and veneer, respectively.3By way of the STAND ID and Stand# fields, respectively, join the volumes table to the Cover Typesattribute table.Figure 1. Joining the volumes table to the Cover Typesattribute table.Now you're ready to calculate a dollar estimate of timber value in each Woodlot stand.As noted previously, you can determine a stand's timber value by summing the product of itssize (ha), volume yield (m3/ha), and market price ( /m3) for each species and product type.With the volumes and Cover Types tables joined, the first two measures for each stand areavailable, but you must refer to table 1 for the third, the current market prices ( /m3) for thevarious species products.4
Calculating Forest Values: Summarizing timber value by stand type and accessibilityProduct description(volumes query expression)White pine sawlogsGlen JordanMarket price( /m 3 ) 48.00(Ewp s and Ewp v 0.0)Red pine sawlogs 46.00(Rp s and Rp v 0.0)Jack pine sawlogs 37.00(Jp s and Jp v 0.0)Spruce species sawlogs 37.00(S s and S v 0.0)Tolerant hardwood species sawlogs 45.00(Yb s, Yb v, Be s, Be v, Sm s and Sm v 0.0)Hemlock sawlogs 39.00(Ehe s and Ehe v 0.0)White birch sawlogs 40.00(Wb s and Wb v 0.0)Spruce-fir-Jack pine pulpwood 30.00(S p, Bf p, Bf s, Bf v and Jp p 0.0)Tolerant hardwood species pulpwood 25.00(Yb p, Be p, and Sm p 0.0)Intolerant hardwood species pulpwood 25.00(Rm p, Rm s, Rm v, Wb p, A p, A s, and A v 0.0)No commercial value 0.00Table 1. Market prices by product type4In the Cover Types attribute table, add a new Float field named Dollar Value with alias DollarValue.Recall that spaces and a number of other special characters are not permitted in field names, but you canalways assign an alias that includes spaces or special characters.5
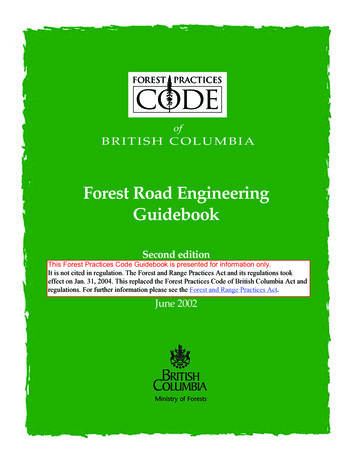
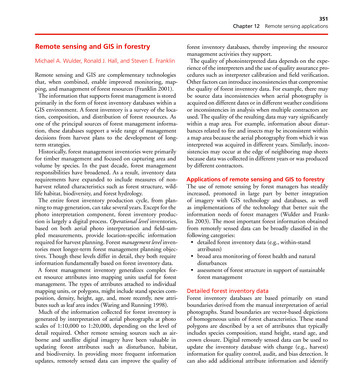
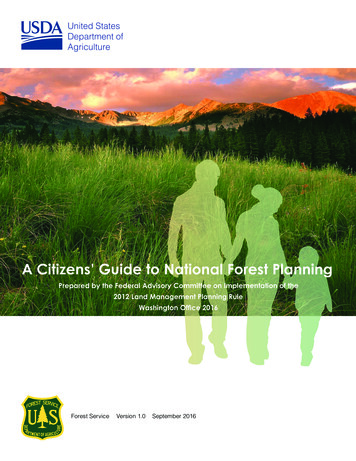
Calculating Forest Values: Summarizing timber value by stand type and accessibility5Glen JordanUse Field Calculator to calculate timber values for each Woodlot stand using the followingexpression. (Note how at the end of this expression, stand areas in square meters are convertedto hectares by dividing by 10,000.)((([volumes.S S] [volumes.S V]) * 37) (([volumes.S P] [volumes.BF P] [volumes.BF S] [volumes.BF V] [volumes.JP P]) * 30) (([volumes.EWP S] [volumes.EWP V]) * 48) (([volumes.JP S] [volumes.JP V]) * 37) (([volumes.RP S] [volumes.RP V]) * 46) (([volumes.EHE S] [volumes.EHE V]) * 39) (([volumes.SM S] [volumes.SM V] [volumes.YB S] [volumes.YB V] [volumes.BE S] [volumes.BE V]) * 45) (([volumes.WB S] [volumes.WB V]) *40) (([volumes.SM P] [volumes.YB P] [volumes.BE P]) * 25) (([volumes.A P] [volumes.A S] [volumes.A V] [volumes.RM P] [volumes.RM S] [volumes.RM V]) * 25)) * [cover.Shape Area] /10000Question 1: What purpose do brackets ( ) serve in a Field Calculator expression like the oneabove?In a few seconds, timber values are calculated for each of the Woodlot's 533 stands.Figure 2. Computed timber values (Dollar Value field).Values range from zero for recently cutover stands to several thousand dollars for higheryielding stands composed of highly valued tree species. What's the timber value of the entireWoodlot?6Right-click the Dollar Value field and select Statistics.The report reveals a wealth of summary information about the Dollar Value field, plus ahistogram showing the distribution of values.6
Calculating Forest Values: Summarizing timber value by stand type and accessibilityGlen JordanFigure 3. Summary of dollar value of standing timber in the Woodlot.Most stands are valued at less than 10,000. The Sum statistic, however, tells you that theoverall timber value in the Woodlot is 2,159,873.72. That's pretty good.On the other hand, the Maximum statistic tells you that the stand of highest value is worth 78,371.94. Why is it so valuable?7Close the statistics report.8Sort the Dollar Value field in descending order.Figure 4. The highest valued stand is number 202 at 78,371.95.Stand number 202 (Stand ID) appears at the top of the table with the highest value. Scanningthe stand's fields explains why it's valued so highly. It's a 16 ha stand (Shape Area) withsignificant spruce sawlog content (86.2 m3/ha) recorded in the S S field.Now you can move on and tackle the issue of accessibility. If a stand isn't accessible, it's lessvaluable than one that is, all other things being equal.7
Calculating Forest Values: Summarizing timber value by stand type and accessibilityC ALCULATE ACCESSIBLEGlen JordanTIMBER VALUESHow many Woodlot stands are not adjacent to or intersected by a road? In other words, how muchof the timber value of the Woodlot, which is upward of 2 million, is inaccessible?ArcMap can easily locate features that are intersected by or adjacent to other features in the sameor another layer using Select By Location. In this case, you want to isolate Woodlot standsintersected by or adjacent to at least one road to facilitate your reassessment of timber value.You find Woodlot roads in two feature classes in the Woodlot geodatabase. Main roads, with rightsof-way, exist as polygon features in the cover feature class with a TYPE value of RD. All lesser, orsecondary, roads exist as line features in the roads feature class with CLASS values of C2, C3, and C4.Identifying road-accessible stands is a two-step process: find stands accessible by main road, andthen add those accessible by secondary road.Since you already have cover added as a layer in ArcMap, start with main roads.R ELATED C ONCEPT : C HARACTERIZING BY A SINGLE NUMBER1Remove the volumes join.It's not mandatory to remove a join. However, when working with a large feature class that has hundredsof features, removing a join when it's no longer needed improves efficiency in subsequent processing.2In Cover Types, select the main road features (TYPE 'RD').You should see 15 main roads in the map display and selected in the table.Figure 5. Main road rights-of-way features (15).8
Calculating Forest Values: Summarizing timber value by stand type and accessibility3Glen JordanUse Select By Location to select stands that are adjacent to (or intersect) the 15 main roads.Figure 6. Selecting features adjacent to main road rights-of-way.This adds all features adjacent to the 15 main roads originally selected. You should now have211 of 569 Woodlot features selected.Figure 7. Main road rights-of-way and adjacentfeatures selected (211).It's easy to miss, but main road features are part of the 211 currently selected features.4Using Select By Attributes, click Remove from current selection to drop main roads from theselected set, if you want to.9
Calculating Forest Values: Summarizing timber value by stand type and accessibilityGlen JordanFigure 8. Removing main road rights-of-way features.You are left with 196 features.Bear in mind that even with main roads removed, some of the 196 features are nonforestedfeatures, such as ponds or gravel pits. Don't worry about excluding nonforested features at thispoint; you can do that once you have added features accessible by secondary roads.Locating stands accessible (intersected by) secondary roads involves using essentially the sameSelect By Location procedure you used to locate stands accessible by main roads.5Add secondary road features, roads, as an additional ArcMap layer.Turning off Cover Types makes it obvious there's no shortage of secondary roads in the Woodlot.Figure 9. The Woodlot's secondary road network.How many additional stands will these secondary roads access?10
Calculating Forest Values: Summarizing timber value by stand type and accessibility6Glen JordanUsing Select By Location, with the add to the currently selected features in option selected, addstands adjacent to or intersected by secondary roads.Figure 10. Adding features intersected by secondaryroads to those adjacent to main roads.Opening the Cover Types attribute table shows that you've gone from 196 to 374 featuresselected.7Use Select By Attributes to remove nonstand features, [AGE] -99.Figure 11. Removing nonstand features from the selection.In the Woodlot, 353 stands are now selected. These are the ones accessible by main orsecondary roads. Considering the Woodlot's total of 533 stands, this means that 180 stands areinaccessible. What effect does that have on your estimate of Woodlot timber value?8In the Dollar Value field, recalculate statistics for a new timber value estimate that includes onlyaccessible stands.11
Calculating Forest Values: Summarizing timber value by stand type and accessibilityGlen JordanFigure 12. Summary of dollar value of accessible timber in the Woodlot.Excluding inaccessible stands reduces the gross value of the Woodlot ( 2,159,873.72) by 23percent ( 501,157.98), leaving the timber value of the Woodlot now at 1,658,715.74. Such areduction is larger than would be predicted on casual inspection.For more detailed insight into timber value in the Woodlot, you can refine your analysis evenfurther. What if you wanted to compare timber values by types of stand, still taking accessibilityinto account?C LASSIFYSTANDS BY TYPE AND ACCESSTo break down timber values by accessible and inaccessible softwood, hardwood, and mixedwoodstands and by treed bogs, how would you proceed?The solution involves reclassifying stands using a nominal attribute. You'll label stands with labels,such as AS for accessible softwood, AH for accessible hardwood, and AM for accessible mixedwood;and likewise for IS, IH, and IM for inaccessible stands; and finally, TB for treed bog and NF fornonforested.After classifying stands in this manner, you can summarize timber values (Dollar Value) by theseven categories.R ELATED C ONCEPT : R ECLASSIFY USING LOCATIONAL AND THEMATIC ATTRIBUTES TO LABEL1Add a new text field of width 2 named Access.2Assign the alias Access Types.Before using Access Types to label stands by accessibility and type, you'll need to rejoin thevolumes table to Cover Types. The volumes table records softwood and hardwood percentages foreach Woodlot stand in fields SW and HW , respectively.3Join volumes to Cover Types via their shared stand identifiers. Keep only matching records.12
Calculating Forest Values: Summarizing timber value by stand type and accessibilityGlen JordanNow you can label stands using your Access Types field.4Use Field Calculator to label all accessible stands (the 353 you already selected in Cover Types)with an "A" in the Access Types field. Make sure you use double quote marks around the "A",or you will get an error message.5Switch the selection, and in the Access Types field, label inaccessible stands with an "I".You are ready to begin refining the labels to distinguish among softwood stands, hardwoodstands, mixedwood stands, and treed bogs, as detailed in table 2.1OperationSeparate treed bogsQueryType 'BG'LabelAccess "TB"2Separate nonforested featuresAge -99Access "NF"3Label accessible softwood standsAccess 'A' and SW 70Access "AS"4Label inaccessible softwoodstandsAccess 'I' and SW 70Access "IS"5Label accessible hardwood standsAccess 'A' and HW 70Access "AH"6Label inaccessible hardwoodstandsAccess 'I' and HW 70Access "IH"7Label accessible mixedwoodstandsAccess 'A' and SW 70and HW 70Access "AM"8Label inaccessible mixedwoodstandsAccess 'I' and SW 70and HW 70Access "IM"Table 2. Labeling stands by accessibility and typeThe process could require several well-choreographed operations of querying and calculating.On the other hand, a little Visual Basic coding in Field Calculator would get the job done muchfaster. Try that instead.6Clear selected features.7Right-click Access Types to open Field Calculator.8In the dialog box, select VB Script and Show Codeblock.9Enter the VB statements that follow (figure 13).If you've never coded in VB before, the logic of the code here might be a bit hard to follow, but itfollows the manual procedure provided in table 2.10 Calculate Access Res.13
Calculating Forest Values: Summarizing timber value by stand type and accessibilityGlen JordanCopying and pasting the code into Field Calculator will work only if you build the code in Notepad.Dim Res'label treed bogsIf [cover.TYPE] "BG" ThenRes "TB"‘ classify nonforested featuresElseIf [cover.AGE] -99 ThenRes “NF”' classify stands by type' accessible and inaccessiblesoftwoodElseIf [volumes.SW ] 70 ThenIf [cover.Access] "A" ThenRes "AS"ElseRes "IS"End If' accessible and inaccessiblehardwoodElseIf [volumes.HW ] 70 ThenIf [cover.Access] "A" ThenRes "AH"ElseRes "IH"End If' accessible and inaccessiblemixedwoodElseIf [cover.Access] "A" ThenRes "AM"ElseRes "IM"End IfEnd IfFigure 13. Labeling stands by accessibility and typeusing VBScript.Field Calculator very quickly calculates Access Types values, but how long did it take you toassemble the VB code? Would manually calculating Access Types values have taken less time?Now you can summarize the Access Types field to compute Dollar Value totals for each access type:AS, AH, AM, IS, IH, IM, TB, and NF.14
Calculating Forest Values: Summarizing timber value by stand type and accessibilityGlen JordanS UMMARIZE TIMBER VALUESWhat summary Dollar Value stats would be the most useful?You could compile the minimum, maximum, average, sum, standard deviation, and variance ofDollar Value values for each unique Access Types value AH, AM, AS, and so forth. Values for the sumof Dollar Value is the obvious choice.But you might also include the sum of stand areas (Shape Area field) and average volume yields(MEAN VH field) for each Access Types value. This would show you how dollar values aredistributed across the seven categories as well as, in each case, how dollar value is influenced byvolume yields and location. For example, dollar value in an accessible category might be high, but ifits stands are low yielding and distributed across a large area, harvest operations would beexpensive.R ELATED C ONCEPT : C HARACTERIZE USING NUMERICAL DISTRIBUTION1Summarize the Access Types field by Dollar Value Sum, Shape Area Sum, and VH Average.2Name the resulting table Access Sum.3Save the table inside your Woodlot geodatabase (rather than outside as a DBF file).Watch out. You may have records still selected in Cover Types. If Summarize on the selected records only ischecked, the summarizing function is applied to just those records, and not all records.Using the Summary Statistics tool (AnalysisTools Statistics), instead of the summarizingfunction accessible via the attribute table, canresult in some different output field names.Figure 14. Summarizing the Access field by Dollar Value Sum, Shape Area Sum, and VH Average.15
Calculating Forest Values: Summarizing timber value by stand type and accessibilityGlen JordanFrom what your summary table reveals about timber value distribution across inaccessible andaccessible stands, decision making about harvesting can begin. For example, significant timbervalue resides in softwood stands that are accessible. But individual softwood stands arerelatively low yielding (87 m3/ha) when compared with the inaccessible softwood stands (123m3/ha). This would increase the cost of harvesting operations. A decision to earmark softwoodfor harvesting across the board could hike the cost of operations more than it is worth.23Figure 15. Dollar value, area (m ), and mean volume yield (m /ha) by accessibility and stand type.To make tables that are produced by ArcMap presentation ready, you can control variousdisplay characteristics. You can hide fields, substitute aliases for field names, and set the formatof field values.In this case, hide a couple of fields in Access Sum, and then format and substitute aliases forothers.4Double-click Access Sum to access its properties.5In the dialog box, click the Fields tab and edit field parameters as shown in figure 16.Figure 16. Formatting the summary table: hiding fields, adding field aliases, andsetting number type and decimal places.This is better, but you need to convert those square meter area values in SUM Shape Area tohectares.16
Calculating Forest Values: Summarizing timber value by stand type and accessibilityGlen Jordan6Use Field Calculator to convert square meter values in the Area (ha) field to hectares by dividingby 10000.7Sort timber values (Value ( )) from largest to smallest.Figure 17. Summary table ready for presentation.Another option for table formatting and presentation is Microsoft Excel.8Start Excel.9Open the Access Sum table in the Woodlot geodatabase (Data From Access).Figure 18. Opening the Access Sum table using Microsoft Excel.You now have the Access Sum table open as an Excel spreadsheet to edit for final presentation.17
Calculating Forest Values: Summarizing timber value by stand type and accessibilityGlen JordanFigure 19. Access Sum table imported as an Excel spreadsheet.10 Drop the NF row.11 Hide columns A and C and relabel other columns.12 Sort DollarValue largest to smallest.13 Reduce decimal places to just 2 for all.14 Choose a table format similar to the one in figure 20.Figure 20. Formatted summary spreadsheet.A chart of one or more of the table variables might also be useful. That's also easily done inExcel.18
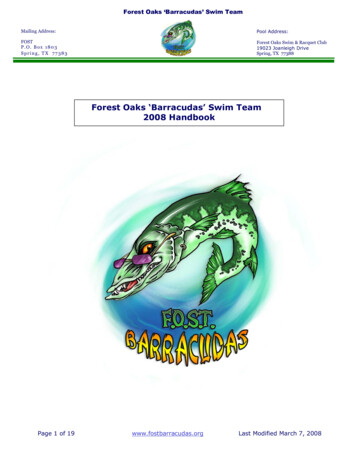
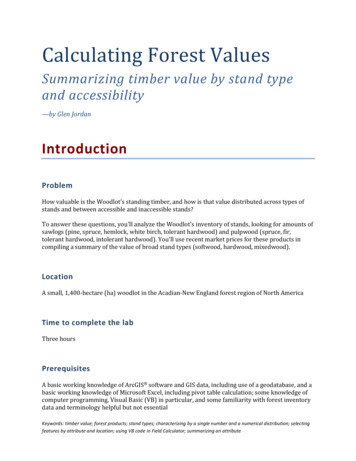
Calculating Forest Values: Summarizing timber value by stand type and accessibilityGlen Jordan15 In Excel, compose a pie chart of Dollar Value by Access, similar to the one in figure 21.Figure 21. Excel pie chart of timber value in the Woodlot.The chart makes the relative dollar values of the different stand types much more obvious. Forexample, it's immediately apparent that accessible softwood and mixedwood types account forthe lion's share of the Woodlot's timber value.However, you can't tell how the more than 736,000 of accessible softwood is distributed byproduct type sawlog versus pulpwood, for example. That would require further analysis usingvolumes table attributes.The chart also doesn't tell you how timber values are distributed geographically across theWoodlot, except to indicate that much more timber value exists in accessible stands thaninaccessible ones. But are higher-valued accessible stands more concentrated in one area thananother?A map of the Dollar Value field for accessible stands might answer that.16 Use Definition Query to limit Cover Types to just accessible stands with the query expressionAccess LIKE 'A*', and then use a graduated color scheme to map Dollar Value.Question 2: What purpose does the asterisk (*) serve in query expressions like this one?Your map should look something like the following, where timber values for the 350 accessiblestands increase from light to dark green. Do you see any patterns?19
Calculating Forest Values: Summarizing timber value by stand type and accessibilityGlen JordanFigure 22. Map of stand timber values ( ) foraccessible stands least valuable (light green)to most valuable (dark green).ConclusionYour analysis began where most analyses begin—with a question. Sometimes answers are foundwith simple or complex queries. Most of the time, some form of reclassification and quantitativesummary proves more informative, and that was the case here.In this exercise, you used locational attributes of proximity (Select By Location), as well as thematicattributes, to reclassify stands. Visual Basic programming in the Field Calculator proved helpful inthe latter.Based on your analysis results, what's your assessment of the economic value of the Woodlot?Submit your work Summary table of timber values by accessibility and stand type categories market value( ), area (ha), and average stand yield (m3/ha); a pie chart of timber values byaccessibility and stand typeBased on lab results, a paragraph detailing an assessment of value in the Woodlot from aneconomic perspective (Is it good news or bad?)Answers to the questions posed in the exercise:1. What purpose do brackets serve in a Field Calculator expression?2. What purpose does the asterisk serve in query expressions?20
Calculating Forest Values: Summarizing timber value by stand type and accessibility Glen JordanA summary of the exercise, indicating where and how the related reclassify andcharacterize concepts and analysis techniques are used (Your summary could take theform of a table that checks off each of these elements.)Calculation of timber value in another forest property using techniques similar to thoseused in this exerciseCreditsSources of supplied dataCourse DataData\cover, courtesy of University of New Brunswick Faculty of Forestry and EnvironmentalManagementData\highway, courtesy of University of New Brunswick Faculty of Forestry and EnvironmentalManagementData\newprop, courtesy of University of New Brunswick Faculty of Forestry and EnvironmentalManagementData\tin, courtesy of University of New Brunswick Faculty of Forestry and EnvironmentalManagementData\Woodlot.mdb, courtesy of University of New Brunswick Faculty of Forestry andEnvironmental ManagementData\Codes\Woodlot Codes.xls, courtesy of University of New Brunswick UNB Faculty of Forestryand Environmental ManagementData\Coordinate Systems\ATS 1977 New Brunswick Stereographic.prj, courtesy of ESRIData\Coordinate Systems\NAD 1983 CSRS New Brunswick Stereographic.prj, courtesy of ESRIData\GPS\Knowledge.shp, courtesy of University of New BrunswickData\GPS\towers.xls, courtesy of University of New Brunswick Faculty of Forestry andEnvironmental ManagementData\Layer Files\Age Classes.lyr, courtesy of Glen JordanData\Layer Files\Air Photo Centre Points.lyr, courtesy of Glen JordanData\Layer Files\Main Roads.lyr, courtesy of Glen JordanData\Layer Files\Mgt Compartments.lyr, courtesy of Glen JordanData\Layer Files\Non-forested.lyr, courtesy of Glen JordanData\Layer Files\Secondary Roads.lyr, courtesy of Glen JordanData\Layer Files\Streams.lyr, courtesy of Glen Jordan21
Calculating Forest Values: Summarizing timber value by stand type and accessibilityGlen JordanData\Mass Points\DTM.txt, courtesy of Service New BrunswickData\Models\Clearcutting.tbx, courtesy of Glen JordanData\Models\Forest Analysis.tbx, courtesy of Glen JordanData\Models\Forest Values.tbx, courtesy of Glen JordanData\Orthophotos\Z45856650.tif, courtesy of Service New BrunswickData\Orthophotos\Z45856660.tif, courtesy of Service New BrunswickData\Orthophotos\Z45856670.tif, courtesy of Service New BrunswickData\Orthophotos\Z45906650.tif, courtesy of Service New BrunswickData\Orthophotos\Z45906660.tif, courtesy of Service New BrunswickData\Orthophotos\Z45906670.tif, courtesy of Service New BrunswickData\Orthophotos\Z45956650.tif, courtesy of Service New BrunswickData\Orthophotos\Z45956660.tif, courtesy of Service New BrunswickData\Orthophotos\Z45956670.tif, courtesy of Service New BrunswickData\Photos\l18 178.TIFF, courtesy of University of New Brunswick Faculty of Forestry andEnvironmental ManagementData\Photos\l18 178.tiffw, courtesy of University of New Brunswick Faculty of Forestry andEnvironmental ManagementData\Photos\l18 178r.tif, courtesy of University of New Brunswick Faculty of Forestry andEnvironmental ManagementData\Photos\l18 180.TIFF, courtesy of University of New Brunswick Faculty of Forestry andEnvironmental ManagementData\Photos\l18 180.tiffw, courtesy of University of New Brunswick Faculty of Forestry andEnvironmental ManagementData\Photos\l18 180r.tif, courtesy of University of New Brunswick Faculty of Forestry andEnvironmental ManagementData\Photos\l18 182.TIFF, courtesy of University of New Brunswick Faculty of Forestry andEnvironmental ManagementData\Photos\l18 182.tiffw, courtesy of University of New Brunswick Faculty of Forestry andEnvironmental ManagementData\Photos\l18 182r.tif, courtesy of University of New Brunswick Faculty of Forestry andEnvironmental ManagementData\Photos\l18 184.TIFF, courtesy of University of New Brunswick Faculty of Forestry andEnvironmental ManagementData\Photos\l18 184.tiffw, courtesy of University of New Brunswick Faculty of Forestry andEnvironmental ManagementData\Photos\l18 184r.tif, courtesy of University of New Brunswick Faculty of Forestry andEnvironmental ManagementData\Photos\l19 61.TIFF, courtesy of University of New Brunswick Faculty of Forestry andEnvironmental Management22
Calculating Forest Values: Summarizing timber value by stand type and accessibilityGlen JordanData\Photos\l19 61.tiffw, courtesy of University of New Brunswick Faculty of Forestry andEnvironmental ManagementData\Photos\l19 61r.tif, courtesy of University of New Brunswick Faculty of Forestry andEnvironmental ManagementData\Photos\l19 65.TIFF, courtesy of University of New Brunswick Faculty of Forestry andEnvironmental ManagementData\Photos\l19 65.tiffw, courtesy of University of New Brunswick Faculty of Forestry andEnvironmental ManagementData\Photos\l19 65r.tif, courtesy of University of New Brunswick Faculty of Forestry andEnvironmental ManagementData\Photos\l19 67.TIFF, courtesy of University of New Brunswick Faculty of Forestry
An Excel summary table and chart summarizing Woodlot timber values by accessibility and broad stand types . . histogram showing the distribution of values. Calculating Forest Values: Summarizing timber value by stand type and accessibility Glen Jordan 7 Figure 3. Summary of dollar value of standing timber in the Woodlot.