Transcription
Southern Oregon University Fact Book2020Table of ContentsSOU Mission Statement . 3SOU Profile Overview & Facts-at-a-glance . 5Enrollment Trends . 12Applications & Admissions . 13Headcount and FTE Enrollment . 14Retention & Graduation. 30Average GPA and Retention . 31Graduation Rates . 32Degrees Conferred. 34Tuition & Financial Aid . 37Faculty & Staff. 43Employee Counts/Categories . 46Written byJake Scott, Research Analyst,for theOffice of Institutional Researchhttps://inside.sou.edu/irOffice of Institutional ResearchPage 2 of 48
Mission StatementSouthern Oregon University will become an inclusive, sustainable, university forthe future that guides all learners to develop the knowledge, capacities, andaudacity to innovate boldly and create lives of purpose.SOU Mission:Southern Oregon University is a regionally-engaged learning community committed to being theeducational provider of choice for learners throughout their lives. We inspire curiosity and creativity,compel critical thinking, foster discovery, and cultivate bold ideas and actions. We achieve studentsuccess, professional preparation, and civic engagement through service excellence, evolvingtechnologies, and innovative curriculum. We foster access, equity, inclusion and diversity in thought andpractice. We prepare our learners to be responsible, engaged citizens in our democracy. We promoteeconomic vitality, sustainability, cultural enrichment, and social well-being in our region, the state, thenation, and the world.Office of Institutional ResearchPage 3 of 48
Fall 2020 Contact InformationAdmissionsCampus AdministrationToll Free: 1 (855) 470-3377President's OfficeIn Oregon: (541) 552-6411Phone: (541) 552-6111Email: admissions@sou.eduFax: (541) 552-6337http://www.sou.edu/admissions/Email: nt/Enrollment ServicesPhone: (541) 552-6600Fax: (541) 552-6614Email: esc@sou.eduhttp://www.sou.edu/enrollment/Academic and Student AffairsPhone: (541) 552-6114Fax: (541) 552-6115Email: /www.sou.edu/studentaffairs/Graduate StudiesPhone: (541) 552-6113Email: studies/Development & SOU FoundationPhone: (541) 552-6127Fax: (541) 552-6126Email: rsity HousingPhone: (541) 552-6371Fax: 541-552-6380Email: housing@sou.eduhttp://www.sou.edu/housing/Finance & AdministrationPhone: (541) 552-6319Fax: (541) 552-6337Email: n Oregon UniversityMarketing & CommunicationsPhone: (541) 552-7246Media Inquiries: (541) 552-6186http://www.sou.edu/marketing/Office of Institutional ResearchPage 4 of 48
Southern Oregon UniversityFall 2020 Enrollment Facts at a Glance - All Enrolled1ALL ENROLLEDTotal Enrollment2,3Total FTEPreviousTotalFull Time/Part TimeUndergrad. full timeUndergrad. part timeTotal Undergrad.CurrentTotal5,9665,0134,0313,499% CurrentEnrollment100%------------% ChangeLast -38.7%Graduate full timeGraduate part timeTotal Graduate9896064.1%8.0%12.1%Admission Source 4New freshmanUndergrad. transfersNew .6%All non-admittedReturn after absenceCont.w/o 0.0%18.2%Geographic SourceJackson county onlySthrn. Ore. (6 county)Subtotal (7 county)Portland (3 county)Other OregonCaliforniaWashingtonAlaskaHawaiiOther statesInternationalTotal Non-Oregon6291,6765191,981ALL ENROLLEDGender5MenWomenOther/UnknownStudent LevelFreshmanSophomoreJuniorSeniorGraduate/Post bac.Post bac./non-grad.Non-adm. undergrad.Non-adm. graduateResidency Fee Status9 credit hours and upResidentNon-resident0-8 credit hoursResidentNon-residentMinoritiesNative AmericanAsian/pacific islanderBlackHispanicTotal Minorities6Age17-25 years26 years and upAverage ageMedian age1. Data represents fourth week figures.2. FTE; total credit hours divided by 15 for undergraduate credits and divided by 12 for graduate credits.3. OHSU and OCNE Nursing coursework excluded from FTE.4. Summer Admissions included in counts.5. OUS permits students to report gender as "other" or "unknown"6. Total includes students who selected mulitple ethnicitiesOffice of Institutional ResearchPage 5 of 48PreviousTotalCurrentTotal% CurrentEnrollment% ChangeLast ,0851,88126 yr3,7341,27927 yr74.5%25.5%-8.6%-32.0%32418 yr14220 yrSOU Institutional Research - Fall 20204th Week Data
History at a Glance1855 – City of Ashland, originally called Ashland Mills town, officially founded.1872 – Ashland Academy founded by Rev. Joseph H. Skidmore and Annie Hill Skidmore.1878 – The Academy was incorporated as the Ashland Academy and Commercial College.1879 – School sold and renamed Ashland College and Normal School (ACNS).1881 – First graduating class of ACNS.1882 – Gov. of Oregon signs bill recognizing ACNS as an official state school.1886 – Closed due to financial trouble, no evidence of the state supporting the institution.1887 – Reopened as Ashland State Normal School after fundraising.1890 – Closed due to lack of enrollment.1895 – Reopened as Southern Oregon State Normal School after a series of deals.1899 – The institution begins receiving state appropriations.1932 – The unofficial name of Southern Oregon Normal School (SONS) becomes official.1934 – Drama Professor Angus Bowmer founds the Oregon Shakespeare Festival.1938 – Receives full accreditation from the American Association of Teachers Colleges.1939 – Renamed to Southern Oregon College of Education.1941 – Authorized to offer the first advanced degree, a B.S. in elementary education.1956 – Renamed to Southern Oregon College, no longer just a school of education.1966 – The entire Faculty Council resigns leading to work on a new faculty constitution.1975 – Renamed to Southern Oregon State College.1997 – Renamed to Southern Oregon University.2007 – Created the College of Arts and Sciences.2013 – Implemented House Model with Green and Social Justice Houses.2015 – Became an Independent public body, Board of Trustees founded.Office of Institutional ResearchPage 6 of 48
Office of Institutional ResearchPage 7 of 48
Academic Offerings2020-2021MajorsBachelor of Arts or ScienceArtBiologyBusiness AdministrationAccounting, Hospitality & TourismManagement, MarketingChemistryChemistry/Biochemistry, Forensic ChemistryCommunicationCommunication Studies, Digital Cinema, SocialMedia & Public EngagementComputer ScienceCriminal JusticeEarly Childhood DevelopmentEconomicsElementary EducationEmerging Media & Digital ArtsEnglishEnvironmental Science & PolicyFinancial MathematicsHealthcare AdministrationInterdisciplinary StudiesInternational StudiesMathematicsMathematics – Computer ScienceMusicNursing (offered via OHSU)Outdoor Adventure LeadershipPolitical SciencePsychologySociology & AnthropologySpanish Language & CultureTheatreActing, Costuming, Directing, Dramaturgy, Sound,Stage Lighting, Stage Management, Stage SceneryBachelor of Applied ScienceManagementCommunity Public Health, Data Analytics,Personnel ManagementHealth & Physical EducationHistoryHuman ServicesInnovation & LeadershipBachelor of Fine ArtsArtCreative WritingTheatreBachelor of MusicMusicMusic Education, PerformanceGraduate DegreesMaster of Arts in French Language TeachingMaster of Arts in Spanish Language TeachingMaster of Arts in TeachingMaster of Arts or Science in Clinical MentalHealth CounselingMaster of Arts or Science in EducationMaster of Business AdministrationMaster of Business Administration: ArtsManagement ConcentrationMaster of Business Administration (OnlinePrograms)Office of Institutional ResearchPage 8 of 48Master of Education / Special EducationProgramMaster in Management (MiM)Master in Interdisciplinary StudiesMaster of Music in PerformanceMaster of Outdoor Adventure and ExpeditionLeadershipMaster of Science in Environmental EducationMaster of Theatre Studies in Production &Design
Academic Offerings2020-2021MinorsApplied StatisticsArtArt HistoryBiologyBusiness AdministrationChemistryCommunication StudiesCreative WritingCriminal JusticeDigital CinemaDigital JournalismEarly Childhood DevelopmentEconomicsEducationEmerging Media & Digital ArtsEnglishEnvironmental tional StudiesLatin American StudiesMathematicsMathematics EducationMilitary ScienceMusicNative American StudiesOutdoor Adventure LeadershipPhilosophyPolitical SciencePsychologyRhetoric & ReasonShakespeare StudiesSocial JusticeSociology & AnthropologySpanishPre-professional ProgramsChiropractic MedicineDental HygieneDentistryLawMedical TechnologyMedicineOccupational TherapyOptometryPharmacyPhysical TherapyPhysician’s AssistantPsychology, Counseling, SocialWork, or Human ServiceVeterinary MedicineChiropractic: University ofWestern StatesDental Hygiene: Oregon Instituteof TechnologyMedical Technology: OHSUOptometry: Pacific UniversityCertificatesAccounting, Post-baccalaureateApplied Finance and EconomicsBusiness Information SystemsCultural Resource ManagementInteractive Marketing andE-CommerceOffice of Institutional ResearchPage 9 of 48Management of HumanResources (Communication)Management of HumanResources (CMHR) (Business)Native American StudiesNonprofit ManagementRegional Studies and AppliedResearchSustainability LeadershipWine Business Certificate
Hannon Library CollectionLibrary Collection Books268,472339,488Electronic Books208,879-Gov. Documents -TotalCataloged Print DocumentsCataloged croficheVHS & DVD VideosAudio ent Periodical SubscriptionsPrint - journals and newspapers, paidElectronic - Unique titles in databasesSUBTOTALElectronic Reference Resources (paid databases)Streaming videoStreaming audioIndividual TracksDiscs/AlbumsOffice of Institutional ResearchPage 10 of 4853927,05927,598722,4711,998,381130,596
Office of Institutional ResearchPage 11 of 48
Enrollment TrendsOffice of Institutional ResearchPage 12 of 48
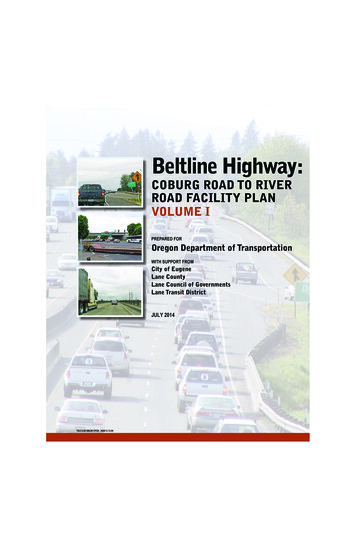
ENROLLMENT TRENDSApplications and Admissions for Fall 6%80.3%76.4%78.2%Resident TransferNon-Resident TransferTotal ident FreshmenNon-Resident FreshmenTotal FreshmenGrand 533,01787.4%Applications and Admissions for End ofFourth Week in Fall Terms 4.8%50072.0%070.0%20172018Applied* Source SOU Institutional ResearchOffice of Institutional ResearchPage 13 of 48Admitted20192020Percentage Admitted
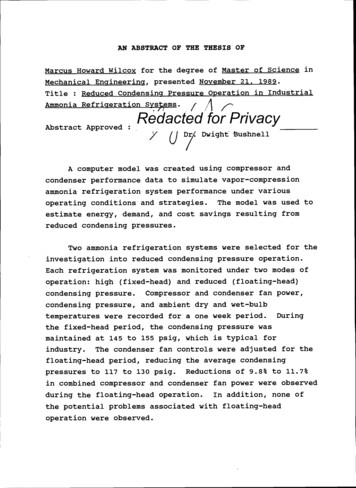
ENROLLMENT TRENDSFall 2020 Headcount and FTE EnrollmentTotal FallHeadcountFall 019% Change from20202019 to 4,4764,3174,1263,617-12.3%Fall Headcount and Annual FTE Enrollment per 20102011201220132014Total Fall Headcount* Source SOU Institutional Research** FTE does not include Nursing EnrollmentOffice of Institutional ResearchPage 14 of 48201520162017Fall FTE Enrollment201820192020
ENROLLMENT TRENDSFall Enrollment by Student e NongraduateNonadmit UndergraduateSubtotal UndergraduateMaster'sPostbaccalaureate GraduateNonadmit GraduateSubtotal GraduateGrand 07066107851,096741,0534,324% Change from2019 to ,9786,0165,8684,905-16.4%Fall Enrollment per Year by Student aureate GraduateMaster's4,000Nonadmit UndergraduatePostbaccalaureate 1,0000Nonadmit Graduate20172018* Source SOU Institutional ResearchOffice of Institutional ResearchPage 15 of 4820192020
ENROLLMENT TRENDSFall Enrollment by Racial/Ethnic GroupAmerican Indian/Alaskan NativeAsian/Pacific IslanderBlackHispanicSubtotal All MinoritiesWhiteDeclined to Respond or UnknownGrand 9555790120208017293547892% Change from2019 to -16.4%Fall Enrollment per Year byMinority Racial/Ethnic sian/Pacific Islander400America Indian/Alaska Native300200100020172018* Source SOU Institutional ResearchOffice of Institutional ResearchPage 16 of 4820192020
ENROLLMENT TRENDSAge by Student LevelUnder 18UndergraduateGraduateNon Admit UGNon Admit GRTotal21-24UndergraduateGraduateNon Admit UGNon Admit GRTotal2017 2018 2019 20202017 2018 2019 20202889792518-20UndergraduateGraduateNon Admit UGNon Admit GRTotal1,364 1226 1155 11056782867624343226610561,461 1,352 1,278 1,21325-29UndergraduateGraduateNon Admit UGNon Admit 4830749940-49UndergraduateGraduateNon Admit UGNon Admit 5258333835989 1,085 1,0501,022 1,123 1,08530-39UndergraduateGraduateNon Admit UGNon Admit 626745350 and OverUndergraduateGraduateNon Admit UGNon Admit 03* Source SOU Institutional ResearchOffice of Institutional ResearchPage 17 of 481,746 1,601 1,527 1397435969571,789 1,660 1,596 1,454
ENROLLMENT TRENDSAge by Student LevelFall 2020 Enrolled Student Age by LevelFall 2020 Enrolled Student Age by Level1,6001,4001,2001,000Under 1818-2021-2480025-2930-3940-4960050 and Over4002000UndergraduateGraduate* Source SOU Institutional ResearchOffice of Institutional ResearchPage 18 of 48Non Admit UGNon Admit GR
ENROLLMENT TRENDSAverage Age by Student LevelFreshmanSophomoreJuniorSeniorPostbacc NongraduateNon-Admit UndergraduateAverage 047.8Graduate MastersPostbacc GraduateNon-Admit GraduateAverage GraduateAverage Age of Students by LevelStart of Fall uniorSenior18Postbacc NongraduateNon-Admit Undergraduate15Graduate Masters10Postbacc GraduateNon-Admit Graduate502020* Source SOU Institutional Research** Age at Start of TermOffice of Institutional ResearchPage 19 of 48
ENROLLMENT TRENDSGender by Student LevelMaleUndergraduateGraduateNon Admit UndergradNon Admit GraduateTotalFemaleUndergraduateGraduateNon Admit UndergradNon Admit GraduateTotal2017201820192020% Change from2019 to Fall Enrollment per Year by 0182019* Source SOU Institutional Research** SOU permits individuals to report gender as Other or UnknownOffice of Institutional ResearchPage 20 of 482020
ENROLLMENT TRENDSFall Enrollment by FT/PT StatusPart TimeUndergraduateGraduateNon Admit UGNon Admit GRTotal2017201820192020% Change from2019 to .6%Full TimeUndergraduateGraduateNon Admit UGNon Admit -11.2%35.8%40.0%42.1%38.5%Percent Part TimeFall Enrollment per Year by FT/PT rt Time* Source SOU Institutional ResearchOffice of Institutional ResearchPage 21 of 482019Full Time2020
ENROLLMENT TRENDSFall 2020 FTE Enrollment by %422.113.0%3,257.9100.0%Biological SciencesBusinessCriminal JusticeComm/JournalismComputer ScienceEducation1Health EducationEnvironmental StudiesHumanities/Fine ArtsMathPhysical SciencesPsychologySocial SciencesTheatre 617.4100.0%Fall 2020 FTE Enrollment by Discipline1,000900Graduate800671 711919927401Excludes Nursing FTE* Source SOU Institutional Research** Total FTE is slightly different from FTE reported elsewhere due to timingOffice of Institutional ResearchPage 22 of 485446
ENROLLMENT TRENDSFall FTE Enrollment by DisciplineBiological SciencesBusinessCriminal JusticeComm/JournalismComputer ScienceEducationHealth Education1Environmental StudiesHumanities/Fine ArtsMathPhysical SciencesPsychologySocial SciencesTheatre 4Fall FTE Enrollment by Discipline Per xcludes Nursing FTE* Source SOU Institutional Research** Total FTE is slightly different from FTE reported elsewhere due to timingOffice of Institutional ResearchPage 23 of 48
ENROLLMENT TRENDSEnrollment by Previous AttendanceContinuing w/o InterruptionReturning After AbsenseNew Admits from High School or GEDNew Admits from Colleges & UniversitiesNew 101985304466444,428Enrollment by Previous Attendance6,000New Non-Admits5,0004,000New Admits fromColleges & Universities3,000New Admits from HighSchool or GED2,000Returning After Absense1,000Continuing w/oInterruption020172018* Source SOU Gray Book ReportsOffice of Institutional ResearchPage 24 of 4820192020
ENROLLMENT TRENDSEnrollment by Geographic CurryDeschutesDouglasGilliamGrantHarneyHood illTotal Oregon* Source SOU Institutional ResearchOffice of Institutional ResearchPage 25 of 10527146244,016244,111284,080253,294
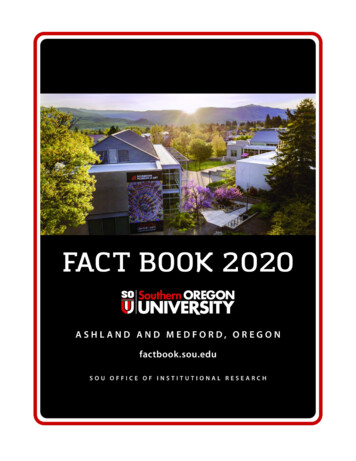
ENROLLMENT TRENDSEnrollment by Geographic Origincontinued State of WashingtonState of CaliforniaState of IdahoState of AlaskaState of HawaiiOther U.S. StatesForeignUnknown Geog. SourceTotal OtherGrand ment by Geographic Origin Fall 2020Hawaii, 65 Other U.S. States,261Alaska, 39Foreign, 24Idaho, 33California, 1,031Oregon, 3,294Washington,148* Source SOU Institutional ResearchOffice of Institutional ResearchPage 26 of 48
ENROLLMENT TRENDSFall International Student ong KongIndiaJapanMexicoSaudi ArabiaSouth KoreaTaiwanThailandUnited 03111151011115312113146913201941211202092543210* Source SOU Institutional ResearchOffice of Institutional ResearchPage 27 of 4813212815312521311259024International Student Enrollment Fall 20206234
ENROLLMENT TRENDSFall Transfers From Oregon Community CollegesBlue eLinn-BentonMt. HoodPCCSouthwesternTreasure ValleyUmpquaRCCTotal Oregon 1632302020196512294720212107205Transfers from Community Colleges Fall2014-20202520152017102018201950* Source SOU Institutional Research** Includes only undergraduate transfer studentsOffice of Institutional ResearchPage 28 of 482020
ENROLLMENT TRENDSNew Fall Transfers from Other 27290230263205261699677721675546523489Other InstitutionsOregon CCOther InstitutionsGrand TotalFall Transfers from OUS ITOSU* Source SOU Institutional Research** Includes only undergraduate transfer studentsOffice of Institutional ResearchPage 29 of 48PSUUOWOU
Retention & GraduationOffice of Institutional ResearchPage 30 of 48
RETENTION & GRADUATIONAverage GPA and RetentionFirst Time, Full Time, Degree Seeking Freshmen Fall CohortCohortBase Cohort SizeIncoming GPA% Retained at SOUthe following 8.7%66.6%67.9%Incoming GPA and Retention Rate of Freshmen Fall 180%Incoming 0010%201020112012201320142015CohortIncoming GPA* Source SOU Institutional ResearchOffice of Institutional ResearchPage 31 of 482016Retention Rate2017201820190%Retention Rate3.50100%
RETENTION & GRADUATIONFreshmen Cumulative Graduation Ratewithin 4, 5, 6 years highlightedGraduation 2015201620172011-12 2012-13 2013-14 2014-15 2015-16 2016-17 2017-18 2018-19 .6%43.7%27.7%6.3%0.0%Freshmen Graduation Rate Within 6 5%41.8%40.4%40.1%41.0%20092010Fall Cohort2011201239.7%30%20%10%0%20072008Graduation Rate* Source SOU Institutional Research** Undergraduate Degrees Awarded to First Time, Full Time FreshmenOffice of Institutional ResearchPage 32 of %46.4%38.2%33.9%6.5%
RETENTION & GRADUATIONTransfer Graduation Ratewithin 6 years highlightedGraduation 2015201620172011-12 2012-13 2013-14 2014-15 2015-16 2016-17 2017-18 2018-19 4%38.3%19.0%Transfer Graduation Rate Within 6 %10%0%2007Graduation Rate* Source SOU Institutional Research** Undergraduate Degrees Awarded to Transfer StudentsOffice of Institutional ResearchPage 33 of 2.0%49.3%52.2%50.1%47.2%41.8%
RETENTION & GRADUATIONUndergraduate Degrees Awarded by MajorBsiness AdministrationPsychologyEducationTheatre ArtsCommunicationHealth, P.E., & LeadershipCriminology & Criminal JusticeDepartment Not DeclaredBiologyEmerging Media & Digital ArtsComputer ScienceEnglish/WritingSociology & AnthropologyArt and Art HistoryChemistryOtherTotal2016-17 2017-18 2018-19 8907861UG Degrees Awarded During 2019-20180160140120100806040200* Source SOU Institutional Research** Note: Primary and Secondary Majors IncludedAwarded a Degree anytime within the academic year*** Top 15 majors listedOffice of Institutional ResearchPage 34 of 48
RETENTION & GRADUATIONMinor Degrees AwardedPsychologyCommunicationLang., Literature & PhilosophyBusiness AdministrationArt and Art HistorySociology & AnthropologyChemistryCriminology & Criminal JusticeMathematicsGend,Sexuality,Women's StudiesEmerging Media & Digital ArtsMusicBiologyEconomicsTheatre 3023171851110101952012128315Minors Awarded During 2019-2020706050403020100* Source SOU Institutional Research** Note: Primary and Secondary Minors IncludedAwarded a Minor any time within the academic yearOffice of Institutional ResearchPage 35 of 482019-206050302517161313131110109998303
RETENTION & GRADUATIONUndergraduate Degrees Awardedby Ethnicity and Gender2017-182016-17MaleAmerican Indian/Alaskan NativeAsian/Pacific IslanderBlackHispanicWhite1OtherFemaleAmerican Indian/Alaskan NativeAsian/Pacific 8439331398391375482Total Undergraduate Degrees Awarded byGender per 174914792017-18Male8798162018-194582019-20Female* Source SOU Institutional Research1Includes Multiple Ethnicities, Declined to Respond, Unknown, or None of the Above** Note: Primary and Secondary Majors IncludedAwarded a Degree within the Academic YearOffice of Institutional ResearchPage 36 of 48
Tuition & Financial AidOffice of Institutional ResearchPage 37 of 48
TUITION & FINANCIAL AIDAnnual Tuition and Fee dentNon-Resident% Change2010-11 2011-12 2012-13 2013-14 2014-15 2015-16 2016-17 2017-18 2018-19 2019-20 2020-21 from 0222,31419,77323,4454.1%5.1%*based upon 15 credit hours for undergraduates and 12 credit hours for graduatesInflation Adjusted Against 2010-11 Dollars% Changefrom2019-202010-11 2011-12 2012-13 2013-14 2014-15 2015-16 2016-17 2017-18 2018-19 2019-20 8,85022,8592.5%3.4%GraduateResidentNon-Resi
Portland (3 county) 403 401 8.0% -0.5% Asian/pacific islander 203 151 3.0% -25.6% . The unofficial name of Southern Oregon Normal School (SONS) becomes official. 1934 - . Chiropractic: University of Western States . Dental Hygiene: Oregon Institute of Technology . Medical Technology: OHSU . Optometry: Pacific University . Certificates.