Transcription
AN ABSTRACT OF THE THESIS OFMarcus Howard Wilcox for the degree of Master of Science inMechanical Engineering, presented November 21, 1989.Title : Reduced Condensing Pressure Operation in IndustrialAmmonia Refrigeration Systems.Abstract Approved :/1Redacted for PrivacyDwight 13ushnellA computer model was created using compressor andcondenser performance data to simulate vapor-compressionammonia refrigeration system performance under variousThe model was used tooperating conditions and strategies.estimate energy, demand, and cost savings resulting fromreduced condensing pressures.Two ammonia refrigeration systems were selected for theinvestigation into reduced condensing pressure operation.Each refrigeration system was monitored under two modes ofoperation: high (fixed-head) and reduced (floating-head)Compressor and condenser fan power,condensing pressure.condensing pressure, and ambient dry and wet-bulbtemperatures were recorded for a one week period. Duringthe fixed-head period, the condensing pressure wasmaintained at 145 to 155 psig, which is typical forThe condenser fan controls were adjusted for theindustry.floating-head period, reducing the average condensingpressures to 117 to 130 psig. Reductions of 9.8% to 11.7%in combined compressor and condenser fan power were observedduring the floating-head operation.In addition, none ofthe potential problems associated with floating-headoperation were observed.
The model was used to simulate refrigeration systemperformance during the monitoring periods, using weatherdata and estimated refrigeration loads as model input.Model predictions were compared with the monitored data tovalidate the model performance.The model was used to predict monthly and annualenergy, peak-demand, and operating costs for a range ofcondensing pressures. Monthly dry and wet-bulb temperatureprofiles, and estimates of refrigeration loads were used asinput for the model.The model predicted:Annual energy savings of 10.6% to 12.0%,corresponding to 0.63% to 0.83% savings per degreereduction in average condensing temperature.Average monthly peak demand savings of 8.7% to 9.2%,corresponding to 0.53% to 0.64% savings per degreereduction in average condensing temperature.Average annual cost savings of 10.4% to 11.9%,corresponding to 0.62% to 0.82% savings per degreereduction in average condensing temperature.The possibility of minimum condensing pressures,below which the condenser fan operating costsoutweigh compressor savings.A significant portion of the possible energy savings(79% to 93%) with no additional equipment or capitalcost.
REDUCED CONDENSING PRESSURE OPERATION ININDUSTRIAL AMMONIA REFRIGERATION SYSTEMSbyMarcus H. WilcoxA THESISsubmitted toOregon State Universityin partial fulfillment ofthe requirements for thedegree ofMaster of ScienceCompleted November 21, 1989Commencement June, 1990
APPROVED :/1,/Redacted for PrivacyPrates ',Jr-cit Mechanical Engineering in charge of majorRedacted for PrivacyHead of department of Mechanical EngineeringRedacted for PrivacyDean of Gradiffe SchoolJDate thesis is presentedNovember 21, 1989
ACKNOWLEDGEMENTI would like to recognize my major professors, Dr.Dwight Bushnell and Dr. George Wheeler, for theirassistance, patience, and invaluable counseling. I wouldalso like to thank my partners in energy conservation, JohnSimonds and Larry Luskay (Masters Candidates in MechanicalEngineering at Oregon State University), for their supportand patience during the long discussions of refrigerationsystems.I am indebted to Mike and Marlin, who granted me accessto their ammonia refrigeration systems, and shared theirtime, experience, and ideas with me.I also thank AlphaOmega Computer Systems and Gordon & Associates Inc. ofCorvallis, Oregon for their assistance in monitoring therefrigeration systems.Finally, I wish to thank Rudy Stegmann of MycomCorporation (Torrance, California) for providing me with thecompressor performance data, and Ray Tatum of ClimateConditioning Inc. (Eugene, Oregon) for supplying me withevaporative condenser performance data. Without thisinformation, this project would not have been possible.
TABLE OF CONTENTSPageINTRODUCTIONTerminologyStudy ProcedureBACKGROUND1124Single Stage Refrigeration System4Two Stage Refrigeration System5Condenser OperationMethods of Head Pressure ControlAdvantages of Reduced Head PressureDisadvantages of Reduced Head PressureModifications Allowing Reduced Head PressureReservations about Reduced Head Pressure6791214171. MONITORING181.1 Introduction181.2 MethodMonitoring Equipment19Monitored VariablesData Manipulation1.3 Case Study #1System Description20Monitoring1.4 Case Study #2232122System Description27Monitoring281.5 Summary32
2. MODEL332.1 Introduction332.2 CompressorsCompressor Data34Power and Capacity34Part-Load Power36Electric Motors36Model Treatment372.3 CondensersModel Equipment Data38Fan Pressure Setpoints39Model Treatment39Desuperheaters422.4 Solution StrategyCompressor Solution StrategyCondenser Solution StrategySystem Solution Strategy4344443. VALIDATION483.1 Introduction483.2 Case Study #149Model SetupModel Output4950Conclusion513.3 Case Study #254Model SetupModel OutputConclusion5455554. PREDICTIONS584.1 Introduction584.2 Case Study #159Model Setup59
PredictionsConclusion4.3 Case Study #2596164Model Setup64Predictions64Conclusion654.4 Summary69Results69Conclusions70Recommendations705. APPLICATIONS71Existing Model71Modified Model72Additional Studies73BIBLIOGRAPHY75APPENDICESA. CompressorsB. Compressor Performance Data7785C. Compressor Performance Corrections100D. Motor EfficiencyE. CondensersF. Condenser Performance Data101G. Solution FlowchartH. Electric Utility Rate Schedules109I. Ammonia Properties111J. Refrigeration Loads113K. Weather Data115L. Glossary118103106110
LIST OF FIGURESFigurePageComponent Layout of Single StageRefrigeration System4Component Layout of Two StageRefrigeration System63.Typical Evaporative Condenser74.Example of Refrigeration Cycle at 165.9psig Condensing Pressure10Example of Refrigeration Cycle at 114.1psig Condensing Pressure111.2.5.6.Condensing and Wet-Bulb TemperaturesDuring Fixed-Head Period (Case Study#1)7.26Condensing and Wet-Bulb TemperaturesDuring Floating-Head Period (Case Study#1)26Compressor Power During Fixed-HeadPeriod (Case Study #1)26Compressor Power During Floating-HeadPeriod (Case Study #1)2610. Condenser Fan Power During Fixed-HeadPeriod (Case Study #1)2611. Condenser Fan Power During Floating-HeadPeriod (Case Study #1)268.9.12. Condensing and Wet-Bulb TemperaturesDuring Fixed-Head Period (Case Study#2)3113. Condensing and Wet-Bulb TemperaturesDuring Floating-Head Period (Case Study#2)3114. Compressor Power During Fixed-HeadPeriod (Case Study #2)3115. Compressor Power During Floating-HeadPeriod (Case Study #2)31
16. Condenser Fan Power During Fixed-HeadPeriod (Case Study #2)3117. Condenser Fan Power During Floating-HeadPeriod (Case Study #2)3118. Power and Capacity for a 3.6 VolumeRatio Screw Compressor3519. Part Load Power for a 3.6 Volume RatioScrew Compressor3620. Evaporative Condenser Capacity versusCondensing and Wet-Bulb Temperatures3921. Example of Condenser Balance Point4022. Sample Weather Data4523. Sample Daily Refrigeration Load4624. Case Study #1 Refrigeration Load forFixed-Head Period4925. Case Study #2 Refrigeration Load forFloating-Head Period4926. Model Prediction of CondensingTemperature During Fixed-Head Period(Case Study #1)5327. Model Prediction of CondensingTemperature During Floating-Head Period(Case Study #1)5328. Model Prediction of Compressor PowerDuring Fixed-Head Period (Case Study#1)5329. Model Prediction of Compressor PowerDuring Floating-Head Period (Case Study#1)5330. Model Prediction of Condenser Fan PowerDuring Fixed-Head Period (Case Study#1)5331. Model Prediction of Condenser Fan PowerDuring Floating-Head Period (Case Study#1)32. Case Study #2 Refrigeration Load forFixed-Head Period5354
33. Case Study #2 Refrigeration Load forFloating-Heat Period5434. Model Prediction of CondensingTemperature During Fixed-Head Period(Case Study #2)5735. Model Prediction of CondensingTemperature During Floating-Head Period(Case Study #2)5736. Model Prediction of Compressor PowerDuring Fixed-Head Period (Case Study#2)5737. Model Prediction of Compressor PowerDuring Floating-Head Period (Case Study#2)5738. Model Prediction of Condenser Fan PowerDuring Fixed-Head Period (Case Study#2)5739. Model Prediction of Condenser Fan PowerDuring Floating-Head Period (Case Study#2)5740. Peak Demand at Reduced Fan Setpoints(Case Study #1)6341. Energy Consumption at Reduced FanSetpoints (Case Study #1)6342. Operating Cost versus Average CondensingTemperatures (Case Study #1)6343. Operating Cost at Reduced Fan Setpoints(Case Study #1)6344. Operating Cost Savings versus AverageCondensing Temperature (Case Study #1)6345. Operating Cost Savings at Reduced FanSetpoints (Case Study #1)6346. Peak Demand at Reduced Fan Setpoints(Case Study #2)6847. Energy Consumption at Reduced FanSetpoints (Case Study #2)6848. Operating Cost versus Average CondensingTemperatures (Case Study #2)68
49. Operating Cost at Reduced Fan Setpoints(Case Study #2)6850. Operating Cost Savings versus AverageCondensing Temperature (Case Study #2)6851. Operating Cost Savings at Reduced FanSetpoints (Case Study #2)6852. Rotary Screw Compressor Efficiency7953. Reciprocating Compressor Efficiency8254. Rotary Vane Compressor Efficiency8455. Power for 2.6 Volume Ratio Screw8756. Capacity for 2.6 Volume Ratio Screw8757. Heat Rejection for 2.6 Volume RatioScrew8858. Power for 3.6 Volume Ratio Screw8959. Capacity for 3.6 Volume Ratio Screw8960. Heat Rejection for 3.6 Volume RatioScrew9061. Power for 5.8 Volume Ratio Screw9162. Capacity for 5.8 Volume Ratio Screw9163. Heat Rejection for 5.8 Volume RatioScrew9264. Power for Reciprocating Compressor9365. Capacity for Reciprocating Compressor9366. Heat Rejection for ReciprocatingCompressor9467. Power for Rotary Vane Compressor9568. Capacity for Rotary Vane Compressor9569. Part Load Power for Screw Compressors9870. Part Load Power for ReciprocatingCompressors9871. Part Load Power for Rotary VaneCompressors99
72. Motor Part Load Efficiency10273. Condenser Capacity when Operated Dry10474. Evaporative Condenser Capacity10675. Solution Strategy Flowchart10976. Ammonia Condensing Temperature versusCondensing Pressure11277. January Weather Data for PortlandOregon11678. Febuary Weather Data for PortlandOregon11679. March Weather Data for Portland Oregon11680. April Weather Data for Portland Oregon11681. May Weather Data for Portland Oregon11682. June Weather Data for Portland Oregon11683. July Weather Data for Portland Oregon11784. August Weather Data for Portland Oregon11785. September Weather Data for PortlandOregon11786. October Weather Data for PortlandOregon11787. November Weather Data for PortlandOregon11788. December Weather Data for PortlandOregon117
LIST OF TABLESTablePageReduced Condensing Pressure forIdeal Ammonia Refrigeration Cycle112.Case Study #1 Equipment Inventory223.Case Study #1 Monitoring Results244.Case Study #2 Equipment Inventory275.Case Study #2 Monitoring Results296.Monitoring Floating-Head Summary327.Case Study #1 Model Error518.Case Study #2 Model Error559.Case Study #1 Rate Schedule601.10. Case Study #1 Prediction Summary6211. Case Study #2 Rate Schedule6512. Case Study #2 Prediction Summary6713. Predicted Savings Summary6914. 2.6 VR Screw Coefficients8815. 3.6 VR Screw Coefficients9016. 5.8 VR Screw Coefficients9217. Reciprocating Coefficients9418. Rotary Vane Coefficients9619. Screw Booster Coefficients9720. Reciprocating Booster Coefficients9721. Part Load Coefficients9922. Power Corrections10023. Capacity Corrections10024. Full Load Motor Efficiency101
25. Condenser Part Load Coefficients10826. Ammonia Condensing Pressure andTemperature11127.Case Study #1 Refrigeration Loads11328.Case Study #3 Refrigeration Loads114
REDUCED CONDENSING PRESSURE OPERATION ININDUSTRIAL AMMONIA REFRIGERATION SYSTEMSINTRODUCTIONAmmonia refrigeration systems are often operated atcondensing pressures that are higher than necessary.Thisensures proper system performance, particularly duringReducing the condensingperiods of low ambient temperature.pressure will decrease compressor power and energy, increasesystem capacity, and may reduce wear on compressors andcondenser fans. Operating at reduced condensing pressurealso increases condenser fan energy. Problems with liquidcirculation, expansion valve performance, liquid injectioncooling, hot-gas defrost, and glycol freezer floor heatingmay appear at reduced condensing pressure.This study models refrigeration system performance topredict reductions in power and energy for two ammoniarefrigeration systems at reduced condensing pressures.TerminologyThroughout this study, standardindustry terminology is used. Although referring to theCondensing Pressure.same conditions, any of the following expressions may beappropriately used when discussing the condensing pressureof a refrigeration system:Condensing PressureCondensing TemperatureHead PressureCompressor Discharge Pressure
2Fixed and Floating-Head. As refrigeration load orambient temperature increase, the condensing pressure risesCondenser fans may be set toas necessary to reject heat.cycle, maintaining high condensing pressures.If thecondensing pressure is held high enough, the pressure maynot rise to reject heat during periods of high refrigerationload or ambient temperature. Maintaining the condensingpressure at high levels is termed "fixed-head" operation.Setting condenser fans to maintain a lower condensingpressure will operate the fans more, allowing the condensingpressure to rise and fall (or "float") with refrigerationloads or ambient temperatures. This type of operation iscalled "floating-head" operation.Study ProcedureThe study was broken into five sections: monitoring,model development, model validation, predictions, andapplications.Two ammonia refrigeration systems weremonitored during fixed and floating-head operation. TheMonitoring.data was used to:1. Provide short term information concerningsavings due to reduced condensing pressure.2. Identify problems resulting from reducedcondensing pressure.3. Provide field data to aid in the development andvalidation of a refrigeration system model.Model Development.A computer model was created usingcompressor and condenser performance data obtained from
3The model also uses refrigerationseveral manufacturers.loads, weather data, and system setpoints to predict systemperformance and operating cost.Model Validation. The model was used to simulatesystem operation during each of the fixed and floating-headperiods.The model predictions were compared with themonitored data to validate the model.Predictions.The model was used to make annualpredictions of system performance and operating costs atreduced condensing pressure.Although only used to predict systemperformance at reduced condensing pressures, the model mayApplications.be used to predict system operation with differentequipment, refrigeration loads, system setpoints, oroperating strategies.
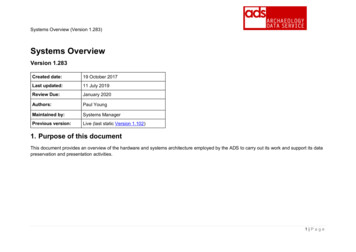
4BACKGROUNDSingle-Stage Refrigeration SystemAmmonia refrigeration systems contain six maincomponents:ReceiversExpansion ValvesLiquid PumpsCompressorsCondensersEvaporatorsThe component arrangement for a single-stage ammoniarefrigeration system utilizing liquid overfeed evaporatorsFollowing compression, superheatedis shown in Figure 1.refrigerant is condensed in the condenser, releasing heat efrigeration LoadFigure 1: Component Layout of SingleStage Refrigeration Systemthe ambient air (if an evaporative or air-cooled condenseris used).The liquid refrigerant flows from the condenser
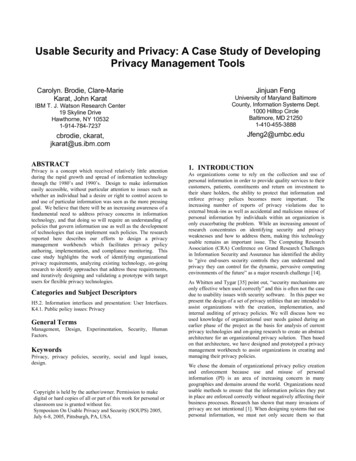
5The liquid is expandedto the high pressure receiver (HPR).to low pressure through an expansion valve and stored in thelow pressure receiver (LPR). The liquid is then pumped tothe evaporator (for liquid overfeed systems) where itevaporates while removing heat from the refrigeration load.The compressor receives vapor from the evaporator and thecycle is completed.Two-Stage Refrigeration SystemThe minimum practical evaporating temperature for aAsingle-stage ammonia system is approximately -20 F.second stage of compression can provide evaporatingtemperatures of -65 F12.The components for a two-stage refrigeration system isshown in Figure 2. Two-stage systems are similar singlestage systems, with the exception of compression andexpansion.The liquid may be expanded twice. The first expansionsupplies liquid at an intermediate pressure for use inhigher temperature evaporators, intercoolers, or storage inan intermediate pressure receiver. The intermediatepressure liquid is expanded again, producing the lowpressure liquid required by the system. The boostercompressors receive vapor from the low pressure evaporator,while the high-stage compressors receive vapor from thebooster compressor discharge and the intermediate pressureevaporator.
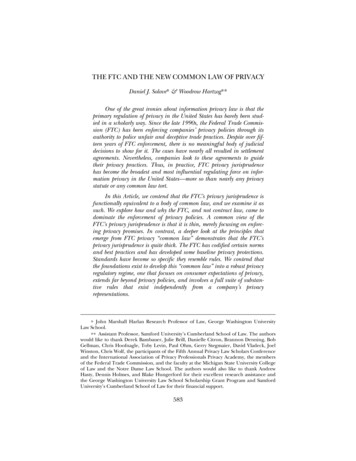
ExpansionDeviceInter.PressureReceiver0Inter. Press.EvaporatorLiquidPumpEcSide eiverLow Pressure0- EvaporatorLiquidPumpBooster LoadFigure 2: Component Layout of TwoStage Refrigeration SystemCondenser OperationTo condense the high pressure refrigerant vapor, heatis removed by the condenser. A typical evaporativecondenser is shown in Figure 3.The refrigerant vaporpasses through tubes that are sprayed with water,transferring heat from the refrigerant to the water. Air is
7blown over the water to remove the heat through sensible(cooling the water) and latent (evaporating some water) heattransfer. Thus, to condense the refrigerant the refrigeranttemperature must be greater than the ambient temperature.More specifically, (since the process is governed by theevaporation of water) in an evaporative condenser therefrigerant temperature must be greater than the wet-bulbtemperature.Although the wet-bulb temperature may dropdramatically during the cooler portions of the year, somerefrigeration systems maintain artificially high condensingpressures, rather than letting the condensing temperaturevary or "float" with ambient conditions.AIR DISCHARGEELIMINATORS( REFRIG.VAPOR IN(( ( (( AA A n A /\WATER DIST. SYSTEMfCONOEN INGCOILREFRIG.UOUID OUT @ 95FW.B.275 CFM/TONPUMP(APPROX. 1 GPM/TON@ LOW PUMPING HEAD)Figure 3: Typical Evaporative Condenser(Evapco Inc.)Methods of Head Pressure ControlAmmonia refrigeration systems commonly use the fans onevaporative condensers to control head pressure. Decreasingthe airflow through the condenser reduces condensing
8capacity, causing the head pressure to rise. Similarly,increasing airflow increases condensing capacity, causingthe head pressure to drop. In this way, the minimumcondensing pressure can be held within a desired rangeduring cooler weather to ensure proper system operation.There are several methods used to control the capacity ofevaporative condensers:Refrigerant Pressure SwitchesManual Fan CyclingFan Air DampersVariable Speed Fan ControlMicro-Processor ControlsRefrigerant Pressure Switches. The most common methodof condenser capacity control is pressure switches to cyclethe fans.point.Each pressure switch has a cut-in and cut-outWhen the condensing pressure rises to the cut-inpoint, the fan cycles on.When the pressure drops to thecut-out point, the fan cycles off.The fan cyclingmaintains a minimum condensing pressure.A simpleadjustment of the pressure switches can reduce the minimumsystem condensing pressure.Manual Cycling.Some condenser fans are controlledmanually. Refrigeration system operators observe therefrigeration loads, system pressures, and ambientconditions to determine which condenser fans are required.The fan is turned on with a manual switch, and operatesuntil it is no longer required.In this case, leaving thecondenser fans on to reduce condensing pressure is a simplestrategy to implement.Dampers.Dampers are installed on some condensers,allowing more precise adjustment of condenser capacity thanthat supplied by fan cycling only. The dampers are commonly
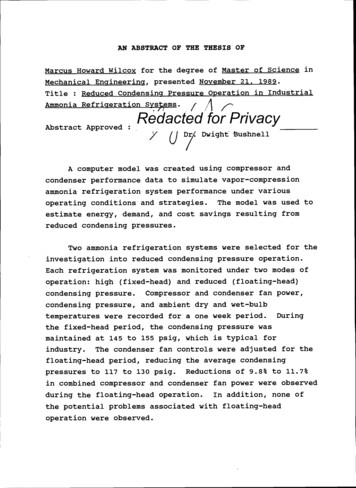
9controlled by pressure switches which can be easilyadjusted.Variable Speed.Although not yet common, variablespeed condenser fans allow finer adjustment of condensercapacity, with higher efficiencies than fan dampers.Micro-Processor Controls. Computer controls arebecoming more common as a method of refrigeration systemAlgorithms may control the compressors, evaporatorfans, and condenser fans. Although reducing the condenserfan setpoints is relatively easy, a computer may takecontrol.condenser fan operation into consideration to keepSome controlrefrigeration system energy to a minimum.systems may optimize several system parameters, such assuction pressures, compressor sequencing, and evaporator fanDepending on the sophistication of the controlcycling.algorithms, savings may be realized due to reducedcondensing pressure.Advantages of Reduced Head PressureThere are three chief advantages of reducing condensingpressure:Reduced compressor powerIncreased refrigerating capacityReduced equipment wearCompressor Power and Capacity.For most applications,the compressor horsepower increases while the refrigeratingcapacity decreases with increasing condensing pressure.Toillustrate this point, an ideal thermodynamic refrigerationcycle is shown in Figure 4 with a higher condensingpressure, and in Figure 5 with a lower condensing pressure.
10Figure 4 shows the compression of 1 lb/min of vaporThe compressorfrom 33.5 psig (20 F) to 165.9 psig (90 F).requires 82 Btu/min of power to supply 474 Btu/min ofevaporating capacity. The system has a Coefficient ofPerformance (COP) of 5.8 (474/82).IDEAL AMMONIA REFRIGERATON CYCLE165.9 psig Cond and 33.5 psig Evap220200Vapor LineLiquid Line180h 144160h-700Condenser: 556 Btu/min140120100ExpansionCompressor: 82 Btu/minlb/minat8016040h 1 4420h 618Evaporator: 474 Btu/min000.40.2(Thousands)0.60.8Enthalpy (h, in units of Btu/lb)Figure 4: Example of Refrigeration Cycleat 165.9 psig Condensing. PressureIn Figure 5, the condensing pressure has been reducedThe compressor now requires only 57to 114.1 psig (70 F).Btu/min of power to supply an increased 497 Btu/min ofevaporating capacity. The system COP increases to 8.7(497/57).The power reduction results from the lower dischargepressure of the compressor.The system refrigeratingcapacity increase is due to the cooler liquid from thecondenser.A comparison of the two examples is summarizedin Table 1.Compressor power decreased 31%, or 1.55% perdegree reduction in condensing temperature.System
11refrigerating capacity increased 5%, or 0.25% per degreeSystem COP increasedreduction in condensing temperature.50%, or 2.5% per degree reduction in condensing temperature.IDEAL AMMONIA REFRIGERATON CYCLE114.1 psig Cond and 33.5 psig Evap220200Vapor LineLiquid Line180160140120h 12110080h-675Condenser: 554 Btu/minCompressor: 57atExpansionB tu/min1lb/min6040h-618Evaporator: 497 Btu/minh 12120000.40.2(Thousands)0.60.8Enthalpy (h, in units of Btu/lb)Figure 5: Example of Refrigeration Cycleat 114.1 psig Condensing PressureTable 1: Reduced Condensing Pressure forIdeal Ammonia Refrigeration Cycle.Pressure (psig):165.9Temperature ( F)Power (Btu/min):Capacity (Btu/min):Coefficient of Performance90824745.8114.170574978.7Change-20-31% 5% 50%%/ F-1.55% 0.25% 2.50%As discussed further in Appendix A, the compressorpower per unit of refrigerating capacity (BHP/TON) alwaysincreases with increasing condensing pressure.The resultof reduced condensing pressure operation is a decrease in
12compressor power requirements and energy consumption, and anincrease in system refrigerating capacity.Reduced Wear. An additional advantage of reducedcondensing pressure may be decreased equipment wear. Lowerpressure ratios across the compressor and reduced operatingtime can reduce the wear on the compressor.Disadvantages of Reduced Head PressureSix potential problems of reduced condensing pressureare associated with:System Liquid CirculationLiquid Injection CoolingOil SeparationDefrostFreezer Floor HeatingCondenser Fan Energy and LifeLiquid Circulation. Some refrigeration systems use thepressure of the condensed high-pressure liquid to move therefrigerant to the evaporators. This is common in Freonsystems that incorporate thermal expansion valves betweenthe condenser and evaporator. Thermal expansion valveperformance can be limited by the pressure drop across thevalve. Ammonia systems commonly incorporate needle valves,solenoid valves, and float switches to control liquidflowrates and expand the high-pressure liquid refrigerantinto a low-pressure liquid receiver (LPR). The needlevalves are generally less sensitive to fluctuations insystem pressures, and can be adjusted, modified, or replacedif necessary.Liquid Injection Cooling. Some rotary screwcompressors use liquid injection to provide cooling for the
13lubricating oil and desuperheating for the refrigerant.High-pressure liquid refrigerant is injected into thecompressor rotor housing, where it expands and cools therefrigerant and oil mixture. This method of coolingrequires a minimum condensing pressure to ensure adequateliquid refrigerant flow into the compressor.The lubricating oil in a screwOil Separation.compressor must be separated from the discharge refrigerantbefore entering the condenser. In an oil separator, thesuperheated refrigerant and oil mixture passes throughcoalescing filters which trap the oil. As the condensingpressure is reduced, the refrigerant density decreases.This results in higher refrigerant velocities through thefilter elements, and the possibility of inadequateIn addition, at extremely low condensingseparation.pressures, the lubricating oil can "foam" at the compressordischarge as some to the oil vaporizes, making separationmore difficult.This results from the over-compressioninherent in screw compressors at reduced pressure ratios.Hot-gas is commonly used to remove frost fromthe evaporators. High-pressure vapor from the HPR orcompressor discharge is passed through the evaporator,melting the ice. A pressure regulation valve maintains aDefrost.specified pressure in the evaporator during defrost, usuallyThis ensures ammoniatemperatures that are 10 F to 15 F above freezing. Aminimum compressor discharge pressure of 90 to 110 psig may65 psig (44 F) to 70 psig (47 F)1.be necessary to overcome pressure drops in the defrostcontrols, valves, piping, and evaporator coils.Freezer Floor Heat.The superheated refrigerantdischarged from the compressors is commonly passed through aheat-exchanger to heat a glycol water solution.The warmglycol (65 F to 75 F) is passed through piping loops in the
14floor to prevent concrete from heaving or buckling. Theglycol heat-exchanger usually acts as a refrigerantdesuperheater, with little refrigerant condensation takingplace.Systems with high compressor discharge temperatures(i.e. reciprocating at 250 F to 275 F) allow sufficientheating of the glycol under most conditions. Screwcompressors with liquid injection have low dischargetemperatures (110 F to 140 F) with little refrigerantEnsuring proper glycol temperatures may besuperheat.difficult during periods of reduced condensing temperatures.In general, reducing condensingCondenser Fans.pressure will increase condenser fan energy. This will betrue on any system that uses the condenser fans to controlcondensing pressure.Although the condenser fans typicallyonly account for 5 to 10% of the system horsepower, theremay be instances when the increased fan power will outweighthe compressor savings.In systems that employ fan cycling to control headpressure, reducing the condensing pressure will increase theThis will reduce fanoperating time of the condenser fansOn the other hand,motor (also belt and bearing) lifetime.the fans will cycle on and off less, tending to increaseequipment lifetime. It may be necessary to refer toinformation from the motor manufacturers to determinewhether motor lifetime increases or decreases as a result ofreduced head pressure operation.Modifications Allowing Reduced Head PressureThe potential problems of reduced condensing pressuresshould not discourage anyone from trying to reduce
15compressor power and energy consumption.problem has a solution:PROBLEMSystem Liquid CirculationEach potentialSOLUTIONLiquid PumpsValve AdjustmentNew Valves and OrificesInjection Liquid PumpsNew Injection TX ValvesAdditional SeparatorsTime Clocks and SwitchesWater DefrostLiquid Injection CoolingOil SeparationDefrostIncreased SuperheatAlternate Heat SourceMonitoring and ModelingFreezer Floor HeatingCondenser Fan EnergyProblems associated with liquidcirculation and injection cooling can be solved with liquidLiquid Pumps.pumps.A liquid pump can be installed on the high-pressureTheliquid line from the high-pressure receiver (HPR).liquid circulation system will then have sufficient pressureto ensure proper flowrates. The compressors will thenbenefit from the power reductions and capacity increasesassociated with decreased condensing pressures.Valve Adjustment. Needle expansion valves may requireseasonal hand-adjustment to ensure proper operation atreduced condensing pressure.A regular pattern ofadjustment can be developed, based on experimentation andexperience.Valves and Orifices.The design of some valves andorifices may limit reduced condensing pressure operation.Replacing components will allow a wider range of condensingpressures.Possible candidates include hand-adjustedexpansion valves and thermal expansion (TX) valvescontrolling liquid injection cooling on screw compressors.
16Additional Separators. Problems associated with oilseparation can be solved with additional separators.Ratings f
Oregon State University in partial fulfillment of the requirements for the degree of Master of Science . (Masters Candidates in Mechanical Engineering at Oregon State University), for their support . January Weather Data for Portland Oregon 116 78. Febuary Weather Data for Portland Oregon 116 79. March Weather Data for Portland Oregon 116