Transcription
Scalable TCP Throughput Limitation MonitoringSimon Bauer, Florian Wiedner, Benedikt Jaeger, Paul Emmerich, Georg CarleTechnical University of Munich (TUM), Department of InformaticsChair for Network Architectures and Services, Garching b. München, Germany{bauer, wiedner, jaeger, emmericp, carle}@net.in.tum.deAbstract—The analysis of TCP throughput limitations is purposed to determine the limitation preventing a TCP connectionto increase its throughput. Monitoring throughput limitationsof TCP connections enables detecting network misconfiguration,overload, and other anomalies while connections are still activein the monitored network. Therefore, TCP throughput limitationmonitoring enables reactions to such incidents in real-time toimprove per-flow and network-level performance.This paper presents a multi-threaded TCP throughput limitation monitoring framework providing scalability due to fullyparallelized analysis pipelines. We benchmark our framework’sperformance and use our implementation to conduct a case studyon real-world Internet traffic captured on 10 Gbit/s links.Our framework shows to scale up linearly and to be capableof monitoring workloads of several Gbit/s distributed on severalten thousands of concurrent flows on commodity hardware. Weuse a real-world Internet trace set including over 9 million TCPflows to assess the share of flows suitable for our monitoringapproach, interpret distributions of measured limitation scores,and estimate the throughput limitations of the analyzed TCPconnections.Index Terms—TCP, throughput limitations, traffic monitoring,high-performanceI. I NTRODUCTIONThe Transmission Control Protocol (TCP) is the dominanttransport layer protocol in use. Due to providing reliable datatransmission, TCP is the used Layer 4 protocol for many typesof network traffic like web applications or file transmissionprotocols. This fact significantly increases interest in theanalysis of the throughput and the throughput limitation ofTCP flows. Analyzing TCP throughput limitations supportsrevealing network entities’ misconfiguration, network debugging, and other administrative tasks like network resourceplanning. So far, previous studies introduced approaches todetermine the throughput limitation of TCP flows also referredto as TCP root cause analysis [1]–[3]. These approaches expectnetwork traffic captures as input and, therefore, only allow theoffline analysis of captured traffic. In previous research [4] weintroduced an approach to make the online monitoring of TCPthroughput limitations feasible. We evaluated our implementation based on synthetically generated traffic in a controlled testenvironment. Our proof of concept implementation showedto be limited by computational resources restricting analysisthroughput to about 500 Mbit/s on commercial off-the-shelfhardware.In this paper, we survey the use of our approach to analyze TCP throughput limitations in real-time in productive978-3-903176-32-4 2021 IFIPenvironments considering traffic rates of several Gbit/s oncommodity hardware. We survey how to implement scalableand productively usable TCP throughput limitation monitoringand survey the performance limitations of such an implementation. Besides, we examine the question of what limits TCPthroughput in real-world Internet traffic.We present a linearly scalable framework to monitor TCPthroughput limitations, that is capable of analyzing severalGbit/s of TCP traffic consisting of millions of TCP flows inreal-time. Based on this framework, we conduct a case studyon real-world Internet traffic traces provided by the MAWIWorking Group Traffic Archive [5] and contribute a detailedanalysis of measurement results.The remainder of this paper is structured as follows: First,we briefly introduce background and terminology on offlineand online analysis of TCP throughput limitations. Next, wedescribe the optimization of our framework regarding newrequirements for large-scale traffic monitoring. Afterward, weevaluate the performance of our framework and present resultsof measurements on real-world Internet traffic. We concludeour work with an overview of related work and progressin TCP performance analysis and high-performance networkmonitoring.II. BACKGROUNDThis section introduces terminology and background knowledge regarding approaches to determine TCP throughput limitations and to monitor them in real-time.A. Offline Analysis of TCP Throughput LimitationsIn 2007 and 2008, Siekkinen et al. published approachesto determine the limiting factor of the throughput of TCPconnections for captured traffic [2], [3]. The authors’ approachconsiders two steps. The first step uses the Isolate and Mergealgorithm [2] to separate a flow into three types of periods.Such periods are application limited periods (ALPs), shorttransfer periods (STPs), and bulk transfer periods (BTPs). During ALPs, the throughput does not increase since not enoughdata is ready to be transmitted. Periods containing less than130 packets are referred to as STPs. They are not consideredfor further analysis as they are assumed to be dominated bycongestion control algorithms [3]. For bulk transfer periods,there are five different limitations of throughput: unsharedbottleneck links, shared bottleneck links, the TCP receiverwindow, the transport protocol, i.e., TCP itself, or causes thatcan not be clearly identified.
To differentiate between throughput limitations of bulktransfer periods, Siekkinen et al. [3] introduce four limitationscores to assess the impact of a potential root cause. Thesescores are later used to determine the limiting factor of aconnection based on a decision tree that compares score valuesto predefined threshold values.The first limitation score is the dispersion score, whichcompares the throughput of a flow to the capacity of the path ofthe flow. The dispersion score is purposed to detect limitationsby an unshared bottleneck link. An unshared bottleneck link iswholly utilized by a single flow and, therefore, limits furtherthroughput increase. The second score is the retransmissionscore proposed to detect limitations by shared bottlenecklinks. This score compares the amount of retransmitted datato the amount of totally transmitted data for a certain bulktransfer period. This way, the retransmission score determinesthe impact of packets getting dropped at so-called sharedbottleneck links. Shared bottleneck links limit the throughputof flows as they are thoroughly utilized by several concurrentflows competing for available bandwidth. Next, Siekkinen etal. introduce the receiver window score that estimates the datathat can be sent until the receiver window is wholly used andprevents higher throughput rates. To detect shared bottlenecklinks that do not cause retransmitted packets due to largebuffers that prevent packets from getting dropped, Siekkinenet al. introduce the burstiness score. The burstiness score usesthe relation between the average advertised receiver window,the maximum segment size (MSS), capacity, and round triptime (RTT) to assess traffic burstiness within a certain period.B. Online Monitoring TCP Throughput LimitationsIn previous research [4], we introduced an approach toanalyzing throughput limitations of TCP flows online. Werely on the limitation score-based approach of Siekkinen etal. and described adaptations to the original algorithms tomake calculations of limitation scores feasible in real-time.We contributed a prototype implementation of our approachbased on the high-performance traffic capture and analysistool FlowScope [6], [7] and evaluated our prototype with asynthetically generated labeled data set.Our approach implies several adaptations to the originalapproach to satisfy online analysis requirements. For instance,we abandon the Isolate and Merge algorithm’s merge step asthis step requires several iterations over previously detectedtransfer periods. As this step is not feasible in real-time, werenounce to merge transfer periods. Instead, we use slidingwindows to track previously extracted packet informationfor each flow and calculate the limitation scores based onsuch windows. The sliding windows of a flow containing theextracted packet data are stored in a flow’s connection state.Our approach considers two steps of packet data processingto reduce the computational load per packet. First, we extractthe necessary information per packet and store it to the flow’sconnection state. Second, the computationally expensive calculation of limitation scores is carried out in fixed time intervals,referred to as periodic result calculations. Our prototype storesconnection states as hash table entries. To avoid expensiveresizing of hash table entries, we use a static connection statesize of 156 kB, which is an upper bound to the aggregatedsliding window sizes per flow.III. F RAMEWORK I MPLEMENTATION FOR L ARGE - SCALEA NALYSISThis section introduces optimizations to the existing prototype implementation [4] to enable scalable monitoring capabilities and describes their implementation.As our framework is purposed to monitor network linkswith data rates of several Gbit/s, we require efficient use ofcomputational resources and a scalable analysis design. Ourprototype implementation already considers efficient packetanalysis [4]. Efficiency is achieved by reducing computationalload per packet by offloading expensive calculations, e.g.,calculating limitation scores, to periodically performed resultcalculations. However, to scale up monitoring capabilities,we consider the parallelization of the whole traffic analysispipeline.A. Multi-threaded Traffic AnalysisOne primary goal of our framework is to scale up monitoring capabilities to achieve analysis throughputs of severalGbit/s. Therefore, we implement the parallelization of thecomplete analysis pipeline used for the existing prototypeimplementation.Our framework uses the packet capturing and analysistool Flowscope [6], [7] as a base for packet processing andanalysis. FlowScope natively supports multi-threaded packetanalysis based on Receive Side Scaling (RSS). RSS enablesNICs to distribute packets to several RSS queues, while eachRSS queue is mapped to a specific CPU core. The distributionof packets to RSS queues relies on hardware-based hashing ofpacket header data. So far, FlowScope only supports the multithreaded analysis of unidirectional traffic, as RSS nativelydoes not ensure that packets of both directions of a TCPflow are mapped to the same RSS queue. However, ourmonitoring approach requires that the same analysis pipelineanalyzes both directions of a flow. To meet the bidirectionalRSS requirement, we extend FlowScopes RSS capabilities tosupport symmetric hashing of packet data. We use a symmetrichash key introduced by Woo et al. [8]. To fully exploit speedup by RSS, we parallelize all further steps of the analysispipeline. Each RSS queue provides received packets to apipeline consisting of four threads: First, a thread responsible for copying packets from the RSSqueue to FlowScope’s packet buffer.A thread that reads packets from the packet buffer to performper-packet analysis and feature extraction.A third thread to run periodic result calculations based ondata in the connection states and to detect expired flows.A thread to finally expire flows by deleting connectionstates.
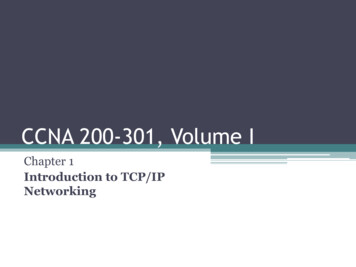
Appropriate flow handling is a central aspect of our monitoring approach that impacts performance and our framework’sapplicability. We refer to a flow as packets with the same 5tuple consisting of server and client IP addresses, ports, andthe used L4 protocol. From an analysis point of view, we canonly consider flows for that we observe the complete TCPthree-way handshake. Observing the handshake is required toextract data necessary to run the TCP throughput limitationanalysis, such as the MSS, sender and receiver information,and the measurement position.To optimize the memory consumption of our framework,we take care of proper flow expiration. As soon as a flowis expired, its connection state is no longer needed, andthere is no need to consider the flow for periodic resultcalculation further. Therefore, flow expiration contributes toefficient memory and CPU utilization. A flow is expired if wedo not observe a packet with the corresponding 5-tuple for aspecific time interval. For our measurements, we use a timeinterval of 180 seconds.IV. E VALUATIONA. Test setupTo evaluate our implementation’s performance and to conduct a case study on real-world Internet traffic captures, werun measurements in a test setup consisting of three physicalhosts. We replay packet captures from a dedicated host referredto as Load Generator. The Load Generator runs the packetgenerator MoonGen, capable of replaying packet captures atrates of several Gbit/s [9]. Our monitoring framework runson a second host referred to as Device under Test (DuT). Athird host provides an ElasticSearch database backend to storeresults for further analysis. The LG and the DuT are connectedwith 10 GE cabling. The DuT is connected to the backendhost using 1 GE cabling. The LG is equipped with two AMDEPYC 7601 CPUs, each capable of 32 physical cores with2.2 GHz clock frequency, 1 TB of DDR4 main memory, andan Intel X550T 10 GE NIC connected to the DuT. The DuT iscapable of two Intel Xeon Gold 6130 CPUs with 16 physicalcores per socket with 2.2 GHz clock frequency, 395 GB DDR4main memory, and two Intel X722 10 GE NICs. As hyperthreading is enabled, each socket provides 32 virtual cores.The backend host provides the same hardware configurationas the DuT. All hosts run Debian stretch.B. Performance MeasurementsIn previous research [4], we found two significant performance limitations of our prototype implementation: a) computational resources and b) memory consumption. To surveyour optimized and extended monitoring framework’s analysiscapabilities, we benchmark our tool with a synthetically generated data set and packet traces taken from the MAWI WorkingGroup Traffic Archive [5].Analyzer Throughput [Gbit/s]B. Flow Handling86420211 Pipeline23252729211213Concurrent Flows2 Pipelines4 Pipelines8 PipelinesFig. 1. Analyzer throughput for varying numbers of concurrent flows.1) Synthetic Data Set for Performance Evaluation: Tobenchmark our monitoring framework’s analysis throughput,we generate a data set consisting of synthetically generatedTCP traffic. We use the traffic generator iperf to generate TCPflows with 1500 B packet size, a data rate of 1 Mbit/s, anda duration of 10 seconds. iperf is limited in the number ofconcurrently generated flows as too many concurrent flowsresult in inaccurate data rates per flow. We observe suchinaccuracies for flow counts larger than 128. Therefore, wecapture several traces with 128 concurrent flows and mergethem to achieve larger numbers of concurrent flows. Theresulting data set provides traces from 1 flow up to 8192concurrent flows. As we generate flows at 1 Mbit/s data rate,the maximum expected data rate in our data set is around8 Gbit/s corresponding to about 1.2 million packets per second.However, we found that the achieved average data rate for thetrace with 8192 flows is a little lower than expected, i.e., about7.5 Gbit/s, due to inaccuracies in the merged PCAPs.2) Performance Evaluation: We measure the achievablethroughput of the analysis pipelines with the generated dataset. We find that a single pipeline can analyze 1024 concurrent flows without dropping packets or ignoring flowsfor the analysis. With increasing load, i.e., more than 1024concurrent flows, packets get dropped due to fully exploitedcomputational resources, and the maximum achieved analysisthroughput is around 1.5 Gbit/s for 2048 flows. We observethat throughput additionally decreases for measurements witha single pipeline and flow counts larger than 2048 downto 1 Gbit/s. For setups with more than one single pipeline,we find a throughput of approximately 1 Gbit/s per pipeline.This observation holds for all setups, even for eight parallelpipelines and an offered load of 8192 concurrent flows. Themeasured analyzer throughput for all pipeline setups is shownin Figure 1. We conclude that these observations indicate thelinear scalability of our framework due to independent analysispipelines.Next, we want to assess the memory consumption of ourframework. Therefore, we conduct measurements with tracestaken from the MAWI Working Group Traffic Archive [5].Choosing such traces for evaluating memory consumption
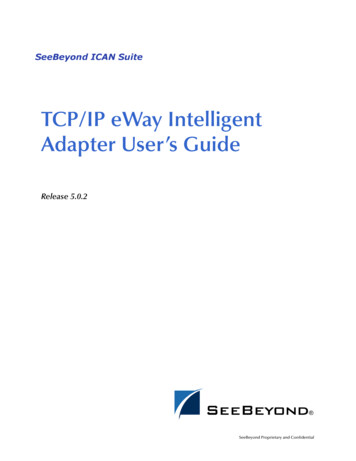
TABLE IU SED MAWI T RACESDate, 15Avg. Data RatePacketsTCP Flows1.532 Gbit/s2.684 Gbit/s2.781 Gbit/s2.823 Gbit/s3.033 Gbit/s2.214 Gbit/s2.601 Gbit/s1.967 Gbit/s2.831 Gbit/s136 M300 M308 M280 M278 M211 M245 M205 M260 M526 K1,634 K1,684 K1,319 K1,208 K1,047 K931 K1,130 K1,001 Kis motivated by the expectation that these real-world tracescarry larger numbers of concurrent flows than our syntheticallygenerated dataset. We run measurements with six, respectively16, parallel analysis pipelines and observe the used memoryduring the analysis. The setup with six pipelines cannotanalyze all packets of some traces due to computationallimitations. However, the setup with 16 pipelines is capableof analyzing all traces without reaching computational limits.We find a maximum memory consumption of 65 GB for sixparallel pipelines, respectively 160 GB for the setup with 16pipelines. In addition to the connection state size allocated inmemory for each analyzed flow, our tool consumes significantamounts of memory per pipeline to provide the ring bufferQQ that Flowscope uses to buffer received traffic before processing it to further analysis steps. By default, our frameworkallocates 8 GB per analysis pipeline to maintain the QQ buffer.For measurements with six analysis pipelines, we observe amaximum memory consumption of about 65 GB, while 48 GBare allocated by the QQ instances. During the measurementswith 16 pipelines, we find a maximum memory consumptionof 160 GB, while 128 GB are allocated by QQ instances. Thesenumbers indicate that the setup with 16 pipelines allocatesconnection states up to 32 GB during the measurements withthe used trace set. Observed values vary slightly for eachdataset as maximum memory consumption depends on thehighest amount of concurrent flows in a particular inputdata period. We observe that our framework can analyze allconsidered traces with 16 parallel analysis pipelines withoutany packets dropped due to overload, while traces includetraffic peaks up to 4 Gbit/s.C. Case StudyTo show our framework’s analysis capabilities, we conductmeasurements with real-world Internet traffic taken from theMAWI Working Group Traffic Archive [5]. In this section, wesurvey the applicability of our framework outside controlledtest environments and analyze the TCP throughput limitationsof real-world Internet traffic.1) Data Set Characteristics: We use packet captures published by the Measurement and Analysis on the WIDE Internet(MAWI) Working Group for our measurements. The MAWIWorking Group provides traffic traces captured on differentsample points on the WIDE backbone network. We choosenine traces captured on Samplepoint G in January and February 2019. Each trace provides 15 minutes of captured traffic.Such traces carry packet counts between 136 million and 308million. Per trace we find TCP flow counts between 500k andover 1,600k and average data rates between 1.5 Gbit/s and3 Gbit/s. All used traces are listed in Table I.Our framework requires a minimum amount of data packetsper flow. Such a minimum is necessary to provide enoughinput data to the analysis modules, such as the capacityestimation module, which is implemented according to thePPrate algorithm [10]. We observe that 300 packets are asuitable lower bound to avoid more considerable inaccuracies of capacity estimates in controlled test environments.Therefore, we configure our framework only to consider flowscarrying more than 300 data packets for further analysis. Thissignificantly decreases the number of considered flows pertrace. We find that the vast majority of flows in our data setconsist of fewer than 300 packets considering both directionsof a flow. The 97th percentile of packets per flow lies between150 and 340 packets for all traces. The 99th percentile ofpackets per flow significantly exceeds 1000 packets for themost traces. This observation implies that only between 1 %and 2 % of all observed TCP flows are relevant for ouranalysis. We observe an exponential distribution of packets perflow. I.e., we find large numbers of very short flows and tinynumbers of large flows up to several million packets per flow.Next to a sufficient number of packets per flow, a capturedflow is required to provide all required handshake informationto be considered for further analysis. This implies that flowsthat began before traffic capturing started can not be analyzed.In total, our framework was able to successfully estimate thecapacity for 29K flows that provide full handshake informationacross all analyzed MAWI traces.Further, we analyze the distribution of server ports acrossthe analyzed traces. We observe that nearly 50 % of all flowsare addressed to well-known server ports, i.e., port 1 to 1024.For port numbers higher than 1024, flows are distributed relatively equally. Furthermore, our server ports analysis revealsthat the significantly dominating ports are port 80 and port443. Due to the dominant share of web traffic, we decide tofocus on web traffic for the detailed analysis of throughputlimitations next to the remaining well-known ports.2) Capacity, Throughput, and Application Limitation: Asexplained above, we require a successful capacity estimate toanalyze a flow’s throughput limitation. Therefore, we considersuccessful capacity estimation as a prerequisite for furtheranalysis of a flow. We find that 50 % of all estimated capacitiesare lower than 2 Gbit/s and only observe minor deviations between the distributions of capacities for port 80, port 443, andthe remaining well-known TCP ports. We measure an averagethroughput of less than 10 Mbit/s for over 60 % of all scorecalculation intervals. For over 90 % of calculation intervals, wemeasure an average throughput lower than 100 Mbit/s. Beside,we observe outliers with throughputs higher than 1 Gbit/s. Asexpected, the cumulative distribution of measured capacitiesis an upper bound to the cumulative distribution of measured
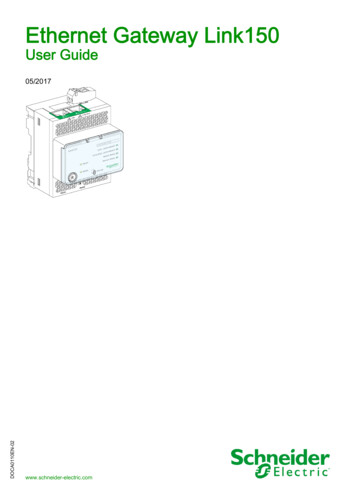
1.0CDFCDF1.00.50.00.00.00.20.40.6Dispersion score0.81.00.00.20.40.6Retransmission er window scorePort 800.81.0Port 4430.50.0 105 104 103 102 101 100Burstiness score0100Well-known TCP ports without 80/443Fig. 2. Cumulative distributions of measured score values.average throughput.Before evaluating measured limitation scores, we survey theshare of application limitations. Application limited periodssignificantly impact our approach as a) limitation scores areonly calculated during bulk transfer periods and b) we resetthe sliding windows containing extracted packet data of aflow after each ALP. We are interested in the time flowsspend in application limited periods and find that the shareof application limitation is near zero for nearly all flows inthe analyzed MAWI traces.3) Limitation Scores: In the following, we present measurement results for the limitation scores used to determine thethroughput limitation of a TCP connection. The formulas forthe limitation scores are specified by Siekkinen et al. [3]. Figure 2 shows the cumulative distribution for measured limitationscores. As our framework calculates results periodically basedon a defined time interval, we likely receive several calculatedlimitation score vectors per flow. We configure the frameworkto calculate scores at an interval of three seconds. On average,each flow with successfully estimated capacity is consideredaround eight times for the periodic score calculations. Thisimplies that flows may contribute several results to our scoreanalysis depending on the flow duration.a) Dispersion Score: The dispersion score comparesthe average throughput of a flow during the current bulktransfers period, respectively, the current sliding window, tothe capacity estimate of the flow. Small dispersion scorevalues indicate a limitation by an unshared bottleneck link. Inour measurements, less than 5 % of all calculated dispersionscores are smaller than 0.8.This observation indicates that mostflows utilize less than 20 % of the corresponding network pathcapacity.b) Retransmission Score: The retransmission score is anindicator of shared bottleneck links. The score compares theamount of retransmitted data to the total amount of transmitteddata to assess the impact of packets being dropped due to fullyutilized links. We determine a packet to carry retransmitteddata if the packet’s sequence number is smaller than the largestsequence number observed so far.We find that 60 % of all calculated retransmission scoresare zero for flows on server port 80. Regarding the remainingwell-known ports we measure a retransmission score equal tozero for 80 % of all calculation periods. At the same time,we observe a small share of relatively large retransmissionscores near one. Such high score values indicate that nearlyall packets are classified as retransmitted data. We explainsuch large values with the missing implementation of packetreordering. If packets are not received in order, our frameworkassumes such packets to be retransmissions. This assumptionindicates that our framework potentially suffers from manyfalse-positives during the detection of retransmitted data. Weconsider analyzing the impact of such unordered packets onthe retransmission score for future research.c) Receiver Window Score: The next score is the receiverwindow score used to assess whether the receiver window sizelimits further throughput increase. A receiver window scoreclose to 1 indicates that the connection uses a large share ofthe receiver window size and, therefore, tends to be limittedby the receiver window. The distribution of measured scorevalues reveals that the majority of receiver window scores areeither 0 or 1 and that only 5 % to 10 % of the scores show avalue unequal 0 and 1. We find that between 20 % and 30 %
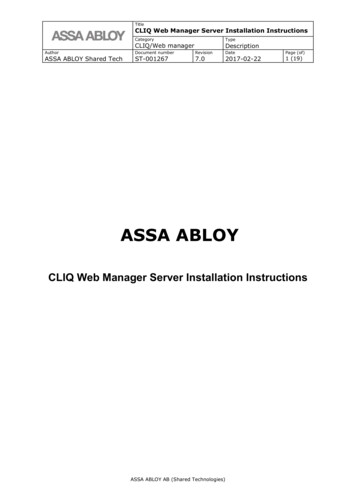
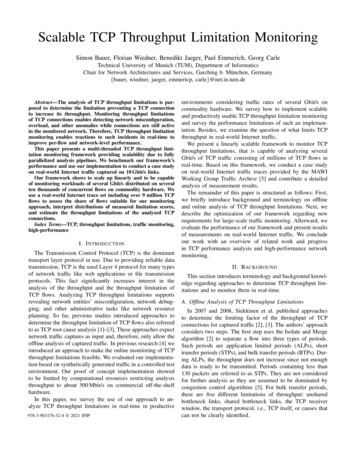
retr. scorerec. win. scoredispersion scoreretr. score 0 & th2 th3 th1FalseFalseFalse rec. win. score 0TrueunsharedbottleneckTrueTrueburst. scoreshared th4bottleneck FalseTrueFalseL4limitationmixed orunknownTruereceiverlimitationFig. 3. Decision tree to determine throughput limitations by Siekkinen et al.[3].of all calculated score values equal 0 and that around 50 %and 60 % of all calculated score values are equal to 1.d) Burstiness Score: The burstiness score is used to assess a flow’s burstiness, which indicates whether a connectionis affected by large buffers that prevent shared bottlenecklinks from dropping packets. Larger score values indicateno impact by buffered packets, while smaller values implymore significant bursts inside the analyzed flow. We measureburstiness scores between 107 and 1. Over 75 % of allcalculated scores are greater than -1000. Based on previousstudies [4] of the burstiness score with a synthetic data set weassess values greater than -1000 as relatively large. Therefore,we expect no significant burstiness for the majority of theanalyzed flows.4) Root Cause Estimation: To determine the actual limitation of the analyzed traffic, we apply the decision tree-basedanalysis of limitation score vectors as purposed by Siekkinenet al. [3]. The decision tree, as shown in Figure 3, comparespredefined threshold values to measured scores. Siekkienen etal. propose threshold values for the dispersion score (th1 0.2), retransmission score (th2 0.01), and receiver windowscore (th3 0.5). There is no purposed threshold value forthe burstiness score as the original approach relies on the bscore to approximate the actual burstiness score. Therefore, wedefine the corresponding threshold value th4 1000 basedon experiences with a synthetically generated data set.We determine that shared bottleneck links limit the throughput of over 35.1 % of all analyzed flow intervals. The secondmost common throughput limitation is the receiver windowsize, which was determined for over 32.1 % of all intervals.The remaining shares of estimated root causes are 12.2 %for L4 limitations, 5.3 % for unshared bottlenecks links, and15.1 % of measured score vectors result in mixed, respectivelyunknown, throughput limitations.V. R ELATED W ORKThe analysis of TCP throughput limitations has a lengthyhistory in the field of network traffic analysis. Early publications work out potential limitations and approaches to identifythem. As mentioned before, our approach is based on the TCProot cause analysis approach introduced by Siekkinen et al. [2],[3], while Zhang et al. [1] initially introduced potential TCPthroughput limitations. Bak et al. [11] present a throughputdegradation analysis approach based on a decision tree similarto Siekkinen et al. and evaluate their approach with 4Gwireless Internet traffic. While the mentioned approaches focuson flows carrying large amounts of data, several publicationssurveyed the performance of short TCP connections [12]–[14].Arajo et al. [15] survey the impact of the network, hosts,and applications on TCP throughput rates in a longitudinalstudy for MAWI traces from 2006 to 2011. Authors show, thatthe mentioned entities constraint over 50 % of analyzed TCPtraffic. Regarding the real-time analysis of TCP performance,Ghasemi et al. [16] present a P4 prototype called Dapper, thatintegrates the analysis of TCP performance to the data plane.The integration of TCP analysis capabilities to softwarizednetworks were sur
in the monitored network. Therefore, TCP throughput limitation monitoring enables reactions to such incidents in real-time to improve per-flow and network-level performance. This paper presents a multi-threaded TCP throughput limi-tation monitoring framework providing scalability due to fully parallelized analysis pipelines.