Transcription
Performance Impact Inference with Failures inData Center NetworksChe Zhang , Hong Xu , Chengchen Hu† NetX† DepartmentLab, City University of Hong Kong, Hong Kongof Computer Science and Technology, Xi’an Jiaotong University, ChinaAbstract—Maintaining a data center network (DCN) is crucialto many services running on top of it, especially given its largescale with tens of thousands of network components. In thispaper, we propose a method to infer performance change beforefailures really happen in data center networks, called Sibyl.Different from previous work, Sibyl relies on network topologyinformation to infer network performance under failure scenarioswithout the overhead of active measurements. Specifically, wedemonstrate that most important performance metrics can beobtained from two fundamental topological metrics. We developefficient algorithms to obtain these two fundamental metrics,leveraging graph automorphism of various DCN topologies.I. I NTRODUCTIONAs the underlying infrastructure of the cloud, data centernetworks (DCN) typically have tens of thousands of networkdevices and cost millions of dollars to build and maintain[6, 10]. In such a large scale network, failures caused byhardware/software malfunctions and human errors are the normrather than exception [5, 12]. Failures may cause severe performance degradation to the Internet services running on topof the data center network. Thus, it is crucial to design anautomatic system to compute the network performance changeafter failures for operators to locate and pinpoint the faileddevices.While many efforts have been devoted to failure detection[9], diagnosis [3, 15], and mitigation/recovery [19], relativelylittle work has been done on inference of performance degradation before failures actually happen. We argue that performanceinference with failures is instrumental in many scenarios. Forexample it can help operators and developers better test theirsoftware under failures, by providing the network performanceimpact for possibly all combinations of failures. Currently thisis done either through communications with network engineerswhich takes time and is inaccurate; or by using a chaosmonkey approach [14] that proactively introduces failures toproduction networks to see how the software reacts, whichmay disrupt production services. A better understanding of theperformance loss caused by failures can also help the operatordesign more resilient traffic engineering schemes, by computingand installing backup tunnels for failures that have significantimpact on the network.In this paper, we propose a novel performance impact inference system for network failures, called Sibyl. Our mainidea is that we can use topology information to infer network performance after failures. Specifically, we demonstratethat various performance metrics, including throughput, loadbalance, network delay, etc., can be deduced accurately fromjust two basic topological properties — the shortest path andthe maximum number of edge-disjoint paths between any twonodes. By enumerating through the possible topologies withdifferent failure scenarios, one can thus calculate the impact ofthem to different performance metrics, without implementingany new protocols or modifying the existing network.The technical challenge in Sibyl becomes: how to efficientlycompute various performance metrics and assess the performance degradation given the topology information. Efficiency isimportant as the operator may need to evaluate a large numberof possible failure cases in practice for better resilience. On theother hand, the sheer size of a data center network with tensof thousands of forwarding devices poses significant difficultyhere.Our main contribution in this paper is that we rely ongraph automorphism for symmetric DCN topologies to developefficient algorithms to compute network performance metrics.Although there are many algorithms solving the shortest pathand the maximum number of edge-disjoint paths problemsindividually, most of them are for general topologies and do notconsider the unique characteristics of DCN topologies. Usingautomorphism sets that can be readily obtained from DCNtopologies, including fat-tree [1], BCube [7], and DCell [8], ouralgorithms can calculate the two basic topological propertiesto reduce the time complexity. Finally, for any scale of fattree and BCube, we can reduce N (N 1) times calculation ofpaths to constant times and the time complexity of computingis O(1). Although DCell is a little different from them dueto the complex connections, we can still reduce the times ofcalculation.The rest of the paper is organized as follows. Section IIintroduces the DCN topologies and performance metrics. Themain focus of this paper, performance inference component, isdescribed in details in Section III. We validate our design viaextensive experiments and simulations in Section IV. Relatedworks are shown in Section V. Finally, we conclude the paperin Section VI.II. T OPOLOGY AND P ERFORMANCE M ETRICSWe first introduce the performance metrics we consider inthis paper, then demonstrate that they can all be calculated fromtwo key properties of the network topology, namely the shortest
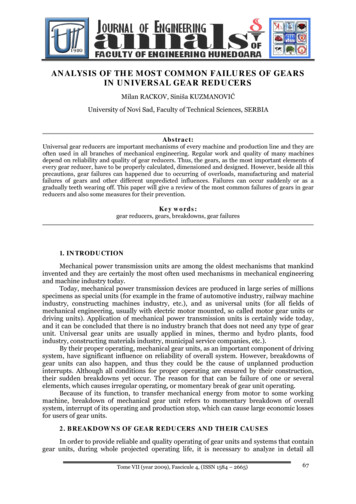
20192401811721516314Level 14(1) FatTree2223132152023610911181781621712Level 019220123456789101112131415(2) BCube(3) DCellFig. 1. Three topologiespath and the maximum number of edge-disjoint paths betweentwo nodes.A. Background and AssumptionsData center networks usually follow richly connected symmetric topologies between a pair of hosts. We mainly considerthree DCN topologies: fat-tree [1], BCube [7], and DCell [8]as shown in Fig. 1.A k-pod fat-tree built from k-port switches can support nonblocking communication among k3 /4 end hosts using 5k2 /4individual k-port switches. The switches of fat-tree are split intothree layers: edge, aggregation and core. A fat-tree consists ofk pods, each having k2 /4 hosts. Fig 1(1) is a 4-pod fat-tree.BCube is a recursively defined structure as shown inFig. 1(2). A BCube0 is simply n servers connecting to an n-portswitch. A BCubek (k 1)) is constructed from n BCubek 1 sand nk n-port switches.DCell is also a recursively defined structure. We use DCellkto denote a level-k DCell. A DCell0 is simply n serversconnecting to an n-port switch. A level-1 DCell1 is constructedusing n 1 DCell0 s, each DCell0 is connected to all the otherDCell0 s with one link. We treat each DCellk 1 as a virtualnode and fully connect these virtual nodes to form a completegraph—DCellk . Fig. 1(3) is a DCell1 network with n 4.Network performance critically depends on the traffic pattern,which varies across time and is hard to model [2, 13]. Forsimplicity, in Sibyl we restrict ourselves to considering onlythe all-to-all traffic pattern where each server communicateswith all the other servers in the network. This is consistent withmuch existing work on DCN [7, 8] as it reflects the worst-caseperformance for networks.Network performance also hinges on how traffic is routedamong all the available paths in the network. In practice DCNsuse equal-cost multi-path routing (ECMP) to perform multipathload balancing uniformly at random across all of the equalcost paths [16]. We thus assume each host’s flows are routedin a round-robin fashion starting from the leftmost path inFig. 1. This results in identical performance compared to ECMPwithout having to take into account the randomness.B. Performance MetricsWe consider six common performance metrics widely usedin DCN. Sibyl can be configured to compute all or a subset ofthese metrics depending on the need. Before explaining theirdefinitions we introduce some notations first.We use l to denote a link, nl to denote the number of flowstraversing l, c to denote capacity of the link, and f to denote aflow in the network. Flow f traverses through a path pf in thenetwork. Let n denote the total number of all-to-all flows.The following metrics are defined with respect to a pair ofhosts or nodes in the network.Throughput: The fair share rate achievable by TCP on linkl is bl c/nl . Thus the throughput of flow f is equal to itsbottleneck fair share rate along its path pf : bf minl pl {bl } minl pl {c/nl }.Network connectivity: This is defined as the minimumnumber of links whose removal disconnects the given two nodesin the topology, i.e. the min-cut between them.Path redundancy: To demonstrate the availability of equalcost paths, we define path redundancy as the maximum numberof edge-disjoint paths between two given nodes.Network delay: We define network delay simply as thelength of the shortest path. Modeling queueing delay in DCNis challenging and beyond the scope of this paper.The following metrics are defined for the network.Aggregate bottleneck throughput (ABT): We use the samedefinition for ABT from [7] here: ABT n minf {bf }.Network throughput: Let T denote the throughput of thePnetwork across all flows. T f bf .C. Metrics and Topological PropertiesWe observe that all performance metrics are closely related tothe graph theoretical properties of the topology. With the all-toall traffic pattern and round-robin based uniform multipath routing, throughput can be readily determined from shortest-pathcalculation, and hence ABT and network throughput. Networkdelay is defined based on shortest path. Network connectivityis related to the min-cut, and path redundancy depends on themaximum number of edge-disjoint paths. Moreover, we havethe following:Lemma 1. In a undirected graph, the maximum number ofedge-disjoint paths is equal to the minimum number of edgeswhose removal separates the two nodes, i.e. the min-cut [11].Therefore the following holds:Theorem 1. All the performance metrics can be calculatedfrom the shortest path and the maximum number of edgedisjoint path in a data center network.Table I summarizes the relationship between metrics andtopological properties of the DCN. We refer to the two properties, the shortest path and the maximum number of edge-disjointpaths, as the path tuple between any two nodes in the network.TABLE IM ETHODS OF COMPUTING PERFORMANCE METRICSPropertyNetwork performance metricsshortest paththroughput, network delay, ABT, networkthroughputmaximum number ofpath redundancy, network connectivityedge-disjoint paths
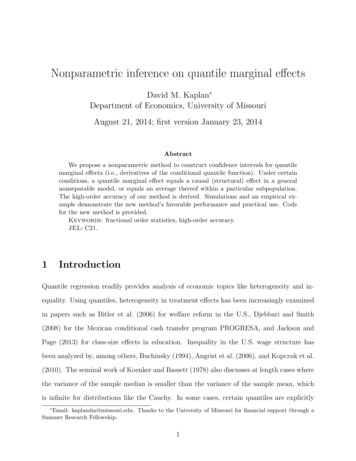
984567301 7)(d)4567310 2(1,0,2,3,4,5,6,7,8,9)(b)46986745123 5)(e)1032(1,0,3,2,4,5,7,6)(f)Fig. 2. Examples of graph automorphism.III. P ERFORMANCE I NFERENCE A LGORITHMSWe have shown that inferring performance metrics in a DCNboils down to calculating the path tuple of all node pairs. Whenthere are N servers in a data center, a naive approach requiresto calculate N (N 1) path tuples for N (N 1) pairs of sourcedestination nodes on a general graph. This is computationallyexpensive for large-scale DCNs. Since the DCN topologyis largely symmetric even with failures, we propose a newalgorithm to accelerate the path tuple computation. We findthat all three topologies shown in Fig. 1 have automorphism.A. Graph automorphismWe start by introducing graph automorphism. From [18] wehave the following:Definition 1. An automorphism of a graph G (V, E) is apermutation σ of the vertex set V , such that the pair of vertices(u, v) form an edge if and only if the pair (σ(u), σ(v)) also forman edge. That is, it is a graph isomorphism from G to itself.Theorem 2. If exchanging two nodes in the graph by keepingthe edges of the graph unchanged does not change the positionsof all edges in the graph, these two nodes are automorphic.An example is as shown in Fig. 2. The three graphs on thetop are the topologies of half of a 4-pod fat-tree with differentlabeling of switches. The first graph is the original graphFig. 2(a) with the labels from left to right and then bottom up.To see that all edge switches in the graph are automorphic, wechoose the pairs (0, 1) and (0, 2). When we exchange switches 0and 1 by keeping their edges unchanged, we obtain the secondgraph Fig. 2(b) whose connections are identical with the firstgraph. Thus the two graphs are an automorphism of each other,and nodes 0 and 1 are automorphic.Moreover we can extend to the following:Theorem 3. If exchanging two units in the graph by keepingtheir edges unchanged does not change the positions of alledges in the graph, the corresponding nodes in these two unitsof the graph are automorphic.We call these automorphic units. In Fig. 2, we choose thepods (0, 1, 4, 5) and (2, 3, 6, 7) in Fig. 2(a) to be the units.After exchanging them in the first graph, we obtain the graphFig. 2(c). Clearly (0, 1, 4, 5) corresponds to (2, 3, 6, 7) and theyare automorphic units. As another example, a simple BCube isshown in Fig. 2(d). We choose (4, 5) and (6, 7) to be units andexchange them to obtain Fig. 2(e). In order to keep the positionsof edges unchanged, we change the positions of switches 2, 1, 3and find the graph is the same as the original. Thus the two unitsare automorphic correspondingly. Similarly, When we exchange0 and 1, we obtain Fig. 2(f).We now introduce the definition of automorphic set asfollows:Definition 2. An automorphic set is a subset of nodes in graphG such that two nodes u and v are in the same automorphicset if there exists an automorphism of G that maps u to v .We can then prove that all three DCN topologies are composed of extensive automorphic sets.Theorem 4. A fat-tree topology is composed of four mutuallyexclusive automorphic sets: the core/aggregation/edge switchset, and the server set. BCube is composed of two mutuallyexclusive automorphic sets: the server set and the switch set.DCell1 has two automorphic sets including the server set andthe switch set as well. DCellk , (k 1) has s/2 automorphic setsfor servers (s stands for the number of servers in DCellk 1 ).The proof is omitted here for space and all the proof oftheorems in this paper can be got from our technical report [20].We sketch the basic idea here. First we find the automorphicunits with the largest cardinality in each topology. Then weidentify that some node pairs in the automorphic unit arealso automorphic. Now we can use the reflexive (node u isautomorphic with itself), symmetric (if node u and node v areautomorphic, v and u are automorphic), and transitive (if nodeu and node v are automorphic, v and w are automorphic, thenu and w are automorphic) properties of automorphism relationto identify and prove the automorphic set in which each nodeis automorphic to each other.B. AlgorithmUsing the automorphic property of DCN topologies, wepropose a new algorithm to reduce the number of path tuplesneeded to infer performance from N (N 1) to a constant forfat-tree, BCube and DCell1 . For DCellk , (k 1), we can alsoreduce it using the following lemma although not all the serversof DCellk are automorphic.Lemma 2. Given the paths P from u to all other nodes inan automorphic set, the paths from v to all the other nodes inthe same automorphic set can be readily obtained from P byapplying the permutation σ where σ(v) u to all the nodes ona path.This lemma implies that, since all the servers are automorphic in fat-tree, BCube and DCell1 , we can reduce the numberof tuples to be calculated from N (N 1) to N 1. That iswe only need to calculate all N 1 path tuples from a servers to other servers. Path tuples from s0 to other servers can beobtained by applying automorphism. As an example in Fig. 3,we know that all the shortest paths from server 0 to all otherservers. Suppose now we want to find the shortest paths fromserver 2 to server 0. We know that one permutation for server2 as shown in the bottom right of Fig. 3 maps 2 to 0, and 0 to
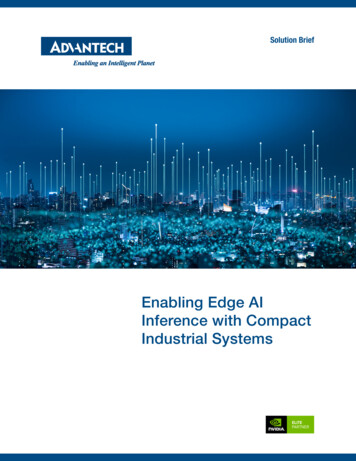
0894514568976012automorphic sets:(0,1,2,3),(4,5,6,7),(8,9)cells:0 12 234(0),(4,5),(1),(8,9),(6,7)(2,3)server cells:(0),(1),(2,3)server pairs needing tocalculating paths:(0,1),(0,2)3723Reforming BFSautomorphisms:path (0,3) 0,1,2,3,4,5,6,7,8,90,1,3,2,4,5,6,7,8,9server 1 0,1,2,3,4,5,6,7,8,91,0,2,3,4,5,6,7,8,9server 2 0,1,2,3,4,5,6,7,8,92,3,0,1,6,7,4,5,8,9server 3 0,1,2,3,4,5,6,7,8,93,2,0,1,6,7,4,5,8,9Fig. 3. An example of the algorithm2. Thus according to automorphism it is equivalent to findingshortest paths from server 0 to 2. One such path is via switches4, 8, and 6. The corresponding shortest path from server 2 to0 is then 6, 8, 4, again according to the same permutation forserver 2.To further reduce the number of tuples from N to constant forfat-tree, BCube and DCell1 whose servers are all automorphic,we need the following:Definition 3. Starting from a server s, an equal-cost automorphic group (ECAG) is the group of nodes that are automorphicto each other, and have the same length of shortest path to s.The corresponding nodes in their shortest path to s are alsobelonging to corresponding ECAGs.We can efficiently find equal-cost automorphic groups usingthe following procedure based on breadth-first search (BFS),called reforming BFS. First we identify automorphic sets. Thenchoose any arbitrary server s, and run BFS. For all nodes atthe same depth of the search, we see if a node is automorphicor not to others according to automorphic sets, and form theECAGs accordingly. For example in Fig. 3, we start from server0 and run BFS. With depth 1, BFS finds switches 4 and 5 whichbelong to the same ECAG. At depth 2, we have server 1 andswitches 8 and 9. Server 1 is not automorphic to switches 8and 9. Thus only 8 and 9 form an ECAG, and server 1 formsanother.Theorem 5. For fat-tree, BCube and DCell1 , for a given servers, the path tuples from s to u and s to v are automorphic if uand v belong to the same equal-cost automorphic group.This implies that we only need to calculate path tuples foronce from s to any node in an ECAG, and use automorphism toobtain path tuples from s to all other nodes in the same ECAG.In other words, we can further reduce the N 1 path tuples tojust a constant for fat-tree, BCube and DCell1 . Table II showsthe exact number of path tuples that need to be computed foreach of the three topologies we consider. As DCell3 already hasenough servers (e.g. when p 6, DCell3,6 can have 3.26-millionservers), we only list to DCell3 . For the same example, wecan reduce 3.26-million*(3.26-million-1) times computation ofpaths tuples to 903*(3.26-million-1) times.TABLE IIT HE TIMES OF COMPUTATION OF PATH TUPLE .TopologiesThe times of computation of path tuplefat-tree3BCubekk 1DCell16 (p 2, p stands for the port number of a switch)DCell2(N 1)p(p 1)/2DCell3(N 1)p(p 1)(p(p 1) 1)/2With failures in the network, since a DCN is large-scale andfailures are not extensive, a majority of the topology is stillautomorphic and we can still use our algorithm to computethe affected path tuples. One simple way is that we can recordall the paths during the path tuples computation of constantnode pair shown in Table II for fat-tree, BCube and DCell1 .According to our algorithm, we can get all the paths for the leftnode pairs using automorphism. So the difference to computethe affected path tuples is that we need to judge whether thepath passes through the failed node or link. Note that manyautomorphisms can be recorded in a smarter way to save space,like server 1 in Fig. 3, we only need to record the different parts.As we can construct the automorphism directly, we can evensave more space by constructing the automorphism when usingit instead of constructing once and saving the automorphism.IV. E VALUATIONIn this section, we perform the evaluations of Sibyl underdifferent settings using simulations to verify its effectiveness.A. SetupWe use fat-tree and BCube with different scales as summarized in Table III as the topologies in the simulation. Thenumber of link failures varies from 5 to 50. The failure patternsinclude random failures involving both servers and switches,server failures only, and switch failures at every level of thetopology.TABLE IIIT OPOLOGIES USED IN EVALUATION .fat-tree(k)F(40) 18000F(60) 58500F(80) 136000BCube(n, k)B(3,4) 648B(4,4) 2304B(5,4) 6250In the experiments, we first compute the baseline performance according to the complete topology of the network.For each failure pattern, we then generate 10 topologies withfailures by randomly choosing the components to fail. For eachtopology, we select the influenced paths to route around thefailures randomly and repeat the performance metric calculationfor 10 times. We compare the performance under failuresagainst the baseline to obtain the drop ratio of each metric,and report the average value across the total 100 runs for eachtopology with failures. Next we will analyse the experimentresults to answer four questions. 1. Whether the change ofmetric is different under different failure patterns? 2. Whetherdifferent performance metrics have different drop ratio underthe same failure pattern? 3. Whether the result can reflectthe automorphic property of DCN topologies? 4. Whether thefailures which have severe impact are few so that the managerof the data center could repair them first?
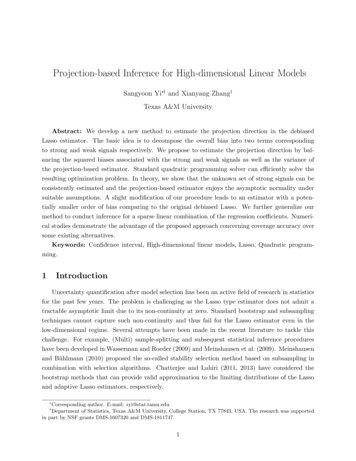
0.4FatTree(40)FatTree(60)FatTree(80)0.07randomedge swithaggregation switchcore 0Error number354045050Fig. 4. The drop ratio of network throughput of FatTree51015202530Error number35404550Fig. 6. The drop ratio of network throughput of ndomserver errorlevel 0 switch errorlevel 1 switch error0.5randomedge swithaggregation switch0.350.30.4CDFThe drop ratio of abt of BCuberandomserver errorlevel 0 switch errorlevel 1 switch 5The drop ratio of throughput of BCubeThe drop ratio of throughput of FatTree with random rror number35404550Fig. 5. The drop ratio of ABT of BCubeB. Impact of failure patternsFig.4, 5, and 6 show the drop ratio of throughput in fattree and the drop ratios of throughput and ABT in BCube withdifferent failure patterns in different scales. We can observe thatunder different failure patterns, the metrics all have differentdrop ratios. As the network scale increases, the slope of thecurves which represents the relative impact of failures are quitedifferent. The drop ratio of throughput has the fastest growthunder the failure pattern of aggregation switch. It implies thatwhen an aggregation switch fails, it has more serious impacton the network. For BCube, compared with failures in servers,failures in switches have more serious effect.00.050.10.150.20.25The drop ratio of pod throughput in FatTree(80) with 50 errors in different typeFig. 7. CDF of the drop ratio of pod throughput in FatTree(80) with 50 errorsin different typesperformance only by the number of failures. Also, differentcompany may pay attention to different performance metrics.D. Failure patterns and automorphic propertyFor both level 0 switch failure and level 1 switch failure patterns of BCube, the curves of drop ratio of ABT and throughputare almost the same as the number of failures increases. It isbecause all the switches for BCube are automorphic, whichmeans that we can also use the automorphic property of DCNtopologies to reduce the number of failure cases. Conversely,the curves of drop ratio of metrics for other failure patterns likeedge aggregation and core switch failures are very different, asthey are not automorphic.C. Various metricsWith the increase of the number of failure, the drop ratio ofABT (Fig. 5) and throughput (Fig. 6) increase almost linearly,but their growth rate is different. For example, the drop ratio ofABT and throughput of BCube(3,4) under 50 failures for level 1switch error are almost 0.6 and 0.38 respectively. Analysing allkinds of the metrics for failure diagnosis is necessary, becausewe can’t judge the degree of impact of failures on networkE. Failure patterns with severe performance impactFig. 7 is the CDF of the drop ratio of pod throughput inFatTree(80) with 50 errors in different failure patterns. We canfind that the proportion of pods whose drop ratio of throughputis larger than 0.15 is much small. So the operator can focuson dealing with those few severe performance impact failureswhen designing the routing or load balancing methods.
TABLE IVT HE AVERAGE CALCULATION TIME OF BC UBEpath tuple computingmetrics computingBCube(3,4)35 ms28 msBCube(4,4)466 ms571 msBCube(5,4)3.5 s7.2 sGRF 9042179 (CityU 11202315), CRF C7036-15G, the NSFC(No.61272459), Program for New Century Excellent Talentsin University (NCET-13-0450), and the Fundamental ResearchFunds for the Central Universities of China.According to the above analysis of our results, we can findthat Sibyl can be used in different topologies and deal withdifferent failure patterns. Table IV further shows the averagecomputation time of automorphism and the path tuples usingour algorithm, and the average computation time of the metrics.We can find that the computation time is only several seconds orsmaller for BCube. The computation time for other topologiesis quantitatively the same and omitted here. Thus the overheadof our algorithm is mild.[1] M. Al-Fares, A. Loukissas, and A. Vahdat. A scalable, commodity datacenter network architecture. In Proc. ACM SIGCOMM, 2008.[2] M. Alizadeh, A. Greenberg, D. A. Maltz, J. Padhye, P. Patel, B. Prabhakar,S. Sengupta, and M. Sridharan. Data center TCP (DCTCP). In Proc. ACMSIGCOMM, 2010.[3] A. Arefin, V. K. Singh, G. Jiang, Y. Zhang, and C. Lumezanu. Diagnosingdata center behavior flow by flow. In Proc. IEEE ICDCS, 2013.[4] K. Chen, C. Guo, H. Wu, J. Yuan, Z. Feng, Y. Chen, S. Lu, and W. Wu.Generic and automatic address configuration for data center networks. InProc. ACM SIGCOMM, 2010.[5] P. Gill, N. Jain, and N. Nagappan. Understanding network failures indata centers: Measurement, analysis, and implications. In Proc. ACMSIGCOMM, 2011.[6] A. Greenberg, J. Hamilton, D. A. Maltz, and P. Patel. The Cost of aCloud: Research Problems in Data Center Networks. SIGCOMM Comput.Commun. Rev., 39(1):68–73, 2009.[7] C. Guo, G. Lu, D. Li, H. Wu, X. Zhang, Y. Shi, C. Tian, Y. Zhang, andS. Lu. BCube: A High Performance, Server-Centric Network Architecturefor Modular Data Centers. In Proc. ACM SIGCOMM, 2009.[8] C. Guo, H. Wu, K. Tan, L. Shi, Y. Zhang, and S. Lu. DCell: A Scalableand Fault Tolerant Network Structure for Data Centers. In Proc. ACMSIGCOMM, 2008.[9] C. Guo, L. Yuan, D. Xiang, Y. Dang, R. Huang, D. Maltz, Z. Liu,V. Wang, B. Pang, H. Chen, Z.-W. Lin, and V. Kurien. Pingmesh: A largescale system for data center network latency measurement and analysis.In Proc. ACM SIGCOMM, 2015.[10] C. Hu, M. Yang, K. Zheng, K. Chen, X. Zhang, B. Liu, and X. Guan.Automatically configuring the network layer of data centers for cloudcomputing. IBM Journal of Research and Development, 2011.[11] J. Kleinberg and E. Tardos. Algorithm Design. 2005.[12] X. Ma, C. Hu, K. Chen, C. Zhang, H. Zhang, K. Zheng, Y. Chen, andX. Sun. Error tolerant address configuration for data center networks withmalfunctioning devices. In Proc. IEEE ICDCS, 2012.[13] A. Roy, H. Zeng, J. Bagga, G. Porter, and A. C. Snoeren. Inside the SocialNetwork’s (Datacenter) Network. In Proc. ACM SIGCOMM, 2015.[14] N. Shelly, B. Tschaen, K.-T. Förster, M. Chang, T. Benson, and L. Vanbever. Destroying networks for fun (and profit). In Proc. ACM HotNets,2015.[15] M. Shibuya, A. Tachibana, and T. Hasegawa. Efficient performancediagnosis in openflow networks based on active measurements. ICN 2014,page 279, 2014.[16] A. Singh, J. Ong, A. Agarwal, G. Anderson, A. Armistead, R. Bannon,S. Boving, G. Desai, B. Felderman, P. Germano, A. Kanagala, J. Provost,J. Simmons, E. Tanda, J. Wanderer, U. Hölzle, S. Stuart, and A. Vahdat.Jupiter rising: A decade of clos topologies and centralized control ingoogle’s datacenter network. In Proc. ACM SIGCOMM, 2015.[17] N. L. Van Adrichem, C. Doerr, and F. A. Kuipers. Opennetmon:Network monitoring in openflow software-defined networks. In NetworkOperations and Management Symposium (NOMS), 2014 IEEE, pages 1–8. IEEE, 2014.[18] D. B. West. Introduction to Graph Theory. 2001.[19] X. Wu, D. Turner, C.-C. Chen, D. A. Maltz, X. Yang, L. Yuan, andM. Zhang. Netpilot: Automating datacenter network failure mitigation.SIGCOMM Comput. Commun. Rev., 42(4):419–430, Aug. 2012.[20] C. Zhang, H. Xu, and C. Hu. Performance impact inference with failuresin data center networks. df?dl 0, Technical Report, 2016.[21] Y. Zhu, N. Kang, J. Cao, A. Greenberg, G. Lu, R. Mahajan, D. Maltz,L. Yuan, M. Zhang, B. Y. Zhao, and H. Zheng. Packet-level telemetry inlarge datacenter networks. In Proc. ACM SIGCOMM, 2015.V. R ELATED W ORKWe discuss related work in this section.Performance monitoring and failure diagnosis: There hasbeen much work on monitoring performance in DCNs. Mostsystems rely on active measurements [15, 17] that introducesoverhead to the network. Sibyl only uses topology informationand does not have any measurement overhead. Failure diagnosisis also an active research area. FlowDiff [3] adopts a modelingapproach to identify applications and diagnose operationalproblems. Everflow [21] debugs faults in the network by tracingspecific packets with a powerful packet filter on top of matchand mirror functionality of commodity switches. Pingmesh [9]is designed to measure and analyze latency performance ina large-scale DCN. While these systems focus on diagnosisafter some failures happen, Sibyl aims to better understand theperformance degradation caused by failures before they happen.Graph automorphism in DCN: Some work also applies graphautomorphism in DCN research. DAC [4] and ETAC [12] forexample uses graph isomorphism and induced graph isomorphism to solve the automatic address configuration problem inDCNs. To our knowledge, Sibyl is the first work that uses graphautomorphism for performance impact inference with failuresin DCNs.VI. C
The following metrics are defined for the network. Aggregate bottleneck throughput (ABT): We use the same definition for ABT from [7] here: ABT n min ffb fg. Network throughput: Let T denote the throughput of the network across all flows. T P fb. C. Metrics and Topological Properties We observe that all performance metrics are closely .
