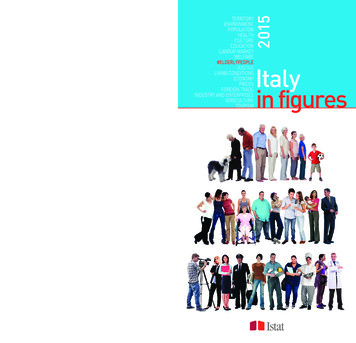
Transcription
2015STATISTICAL INFORMATION:A WEALTH TO THE COMMUNITYProviding users with the tools to deepen knowledgeof Italy’s social, economic and environmentalphenomena at various levels of geographicaldetail. This is the mission Istat is pursuing throughaccurate analyses and investigations.Divided into 16 themes, the 2015 edition of Italy in figures syntheticallydescribes the main economic, demographic, social and territorial aspectsof Italy. An infographic is dedicated to the world of people over 65.In-depth sections, glossaries and brief methodological notes allow evena non-expert public to take advantage of the information wealth.Distributed to the international and domestic institutions, media andopinion leaders, a free copy may be obtained from Istat StatisticalInformation Centres in any region or autonomous province or uponrequest to the Dissemination and Communication of StatisticalInformation Directorate of Istat.Alternatively, users may download its full version or browse each chapterfrom the website homepage www.istat.it, where all data produced by ourInstitute are UREEDUCATIONLABOUR MARKETWELFARE#ELDERLYPEOPLEJUSTICELIVING CONDITIONSECONOMYPRICESFOREIGN TRADEINDUSTRY AND ENTERPRISESAGRICULTURETOURISMItalyin figures
Italian National Institute of StatisticsVia Cesare Balbo, 1600184 Rome - ItalyPh. 39 06 46731Website: http://www.istat.itDissemination and Communication of StatisticalInformation DirectoratePh. 39 06 4673.2048-2049email: editoria@istat.itISBN 978-88-458-1861-5ISBN 978-88-458-1860-8 (digital)PrintRubbettino print - Soveria Mannelli (Catanzaro)
398741917470156268Up to 100From 101 to 200From 201 to 300Over 300198292294RESIDENTPOPULATION DENSITYAS AT 1 JANUARY 2015163Geographical areas: North: Piemonte, Valled’Aosta/Vallée d’Aoste,Liguria, Lombardia,Trentino-Alto Adige, FriuliVenezia Giulia, Veneto,Emilia-Romagna Centre: Toscana, Lazio,Umbria, Marche South and the Islands:Abruzzo, Molise, Campania,Basilicata, Puglia, Calabria,Sicilia, Sardegna16510612334270 2094295769Average Italy: 201130inhabitants per Km2197TERRITORY 1ITALY’S NUMBERSMain territorial and demographic dataLatititude NorthLatititude SouthLongitude WestLongitude EastMaximum span (km)Territorial area (km2)Total area of woods (km2)Total length of coastline (km)High seismic risk area (km2)Protected areas (km2)Highest mountain - Monte Bianco (m)47 06’35 30’6 37’18 est river - Po (km)Railway network (km)Road network (km)RegionsProvincesMunicipalitiesResident populationResident foreignersNumber of householdsHouseholds’ average membersPopulation density 014,43725,816,3112.3201TERRITORIAL AREA BY ALTITUDE AND GEOGRAPHICAL AREA1 January 2015, ,166NorthCentreSouth and the IslandsLOCAL PUBLIC TRANSPORT NETWORK IN PROVINCIAL CAPITALS BY MAIN TYPEYears 2011 and 2013, absolute values in kilometers2011Bus2013Tram tre6,3296937South and Islands6,916852121,075547130ItalyTram ,237540159
KILOMETERS OF TRACKSIN 2013Municipal waste: include household waste (including bulky ones),non-hazardous waste similar to municipal waste in type andquantity, waste from street cleaning, vegetable waste from parksand gardens, waste from cemeterial activitiesSeparate waste collection: consists in municipal waste (includingwet organic waste) being segregated by waste type for reuse,recyclingand reclamation of materials. It regards paper, glass, plastic, organic waste, metals, bulky recyclable waste, textile and others. Wetorganic waste is collected separately by means of either reusablecollection containers or certified biodegradable sacksMaximum number of days exceeding the PM10 limit values: limitset to protect human health and recorded by fixed air quality monitoring 5per 100 km2 of municipal area2 ENVIRONMENTMUNICIPAL WASTE COLLECTION BY GEOGRAPHICAL AREAYear 2013NorthCentreSouth and IslandsItalyMixed collection Separate SEPARATE WASTECOLLECTIONYears 2003 and 2013,millions of 6651,935.8Separate 5584514911,895.11,201.5Organic waste1,686.2OtherENVIRONMENTAL INDICATORS IN REGIONAL CAPITALSYear 2013PARKS AND GARDENSCARSWATER*AIR% ofm2 perPer 1.000Litres consumedMaximummunicipalinhabitantsinhabitantsper daynumber of daysareaper inhabitant exceeding the PM10limit 42.3221.581Bolzano - o4.410.5572.7152.634Cagliari10.156.4671.2170.235* data to 2012 ** data not comparable to other municipalities due to lower taxation for new car registration (since 2012 for Bolzano and Trento)
RESIDENCE PERMITSON 1 JANUARY 2014North2,506,892Centre898,573South and the Islands 469,261Italy3,874,726FOREIGN RESIDENTS IN ITALYCensus 1961Census 1971Census 1981Census 2001Census 20111 January 7Natural increase: difference between the number of live births andthe number of deaths among the resident population occurred bothin Italy and abroadNet migration: difference between the number of new registrationsand cancellations in population registers due to transfers of residence from/to another municipality, or transfers from/to abroad, orother reasons;Residence permits: documents issued by the Italian police authorities which give foreigners the right to legally stay in Italy (usuallyminors are recorded in their parents’ permit). Since 1 January 2008European citizens no longer need to obtain it, in compliance with theregulation n.2004/38/EC on the right of citizens of the Union to moveand reside freely within the territory of the Member StatesPOPULATION 3RESIDENT POPULATION AND POPULATION CHANGE BY GEOGRAPHICAL AREAPopulation on 1 January 2015 and changes in year 7260,795,612NorthCentreSouth and the 5,768Net migration63,13344,1161,463108,712RESIDENT POPULATION PYRAMID BY SEX AND CITIZENSHIPPopulation on 1 January 2014, percentage values100Italian malesForeign malesItalian femalesForeign femalesand 0.40.20000.20.40.60.81.0
Life expectancy at birth: average number of years a new-bornis expected to liveAVERAGE NUMBEROF CHILDREN PER WOMANResident population: Italian and foreign citizens having theirusual residence in a municipality, even if they were absent onthe considered day because they were abroad or in anothermunicipality19611981200120142030 (projection)2.411.601.251.39 *1.49* estimateAgeing ratio: ratio of population aged 65 and over to populationaged 0-14, per 100BIRTHS PER 1,000 RESIDENTSStructural dependency ratio: ratio of non-working age population (0-14; 65 and over) to working-age population (15-64),per 10019611981200120142030 (projection)18.311.19.48.38.14 POPULATIONLIFE EXPECTANCY AT BIRTH BY SEX1961-2065MalesFemales82.8 79.5 84.4 79.8 84.6 80.2 84.974.9 71.1 77.9 73.8 80.3 77.067.2 72.3 1.582.8 87.7 86.62030**2065*** estimate ** projectionRESIDENT POPULATION PROJECTIONS*2020-2065, (in thousands), as at 1 1,3052020202520302035204020452050205520602065* calculated with reference to population at 1 January 2011, without taking account of the Census results and subsequent reconstructionDEMOGRAPHIC INDICATORSCensuses 1961-2011, 1 January 2013 and 2014, projections 2030-2065257.9AGEING .4154.120012011201320142030*2065*127.1STRUCTURAL DEPENDENCY 9711981199120012011201320142030*2065** projection
MAIN HOUSEHOLD TYPESIN 2013-2014Coupleswithout children20%SingleparentsMarriages: data refer to marriages celebrated in Italy duringthe year regardless of the couple’s residence. Marriages with atleast one foreign partner are those in which at least one of thespouses is not an Italian citizen. Accordingly, they also includeforeigners living in Italy but with foreign renHousehold: a group of people linked by ties of marriage, kinship, affinity, adoption, guardianship or affection, sharing thesame house and with usual residence in the same Municipality.Households can also consist of one member onlypercentage compositionPOPULATION 5LIVE BIRTHS OF PRESENT POPULATION BY 92,121MARRIAGES AND AVERAGE AGE OF SAVERAGE AGE OF SPOUSESof whichwith at leastcivilone foreignper 2.8SEPARATIONS AND 2335,16217,134 19,13229,46211,796 88,191 88,28847,03654,160 51,319Divorces27,03819952000200520102012
National Health Service (NHS): includes public hospitals andcredited private clinicsMEDICAL TECHNOLOGYEQUIPMENT OUTSIDEHOSPITALS IN 2012Hospitalisation rate: ratio of in-patients to resident population(yearly average), per 1,000UltrasonographyComputed tomographyscannersMagnetic resonanceimaging unitsAverage length of stay in hospital: ratio of days of stay toin-patients6.10.80.9per 100,000 inhabitantsGeneral practitioners: the new contract for general practitioners set a maximum limit of 1,500 patients each6 HEALTHNATIONAL HEALTH SERVICE STAFF BY GEOGRAPHICAL AREA2012, per 10,000 17.6Doctorsand dentistsNursingstaffSouth and the IslandsItalyNATIONAL HEALTH SERVICE INDICATORS2012General practitionersGeneral practitioner rate*Patients per general practitionerNational Health Service paediatriciansNational Health Service paediatrician rate**Patients per paediatrician (under 14)Non-emergency medical on-call servicesOn-call physiciansLocal Health AuthoritiesUnified booking centres* per 10,000 inhabitants ** per 10,000 children aged 0-14 ic uth and the ate sector TOTAL2011112.033.0 145.02012110.033.033,0 143.0143,02013110.032.0 142.02014111.033.0 36CURRENT HEALTHEXPENDITUREBY SECTOR2011-2014,billions of eurosat current prices
INFANT MORTALITY PER 1,000 LIVE BIRTHSACTUAL HOUSEHOLDEXPENDITURE FORHEALTHCAREGOODS AND SERVICESIN Auxiliary health servicesDiagnostic testsGlasses/contact lensesHealth aidsDrugsHealth care 51961197114.18.14.73.21981199120012012Infant mortality: includes deaths in the first year of age before thefirst birthday, including those died before the registration of birtheuroHEALTH 7DEATHS BY SOME CAUSES1931, 1971 and 2012, per 100,000 4.9188.575.676.9NeoplasmsDiseases of thecirculatory system72.7Diseases of therespiratory system218.257.639.0Diseases of thedigestive system15.920.9Infectious andparasitic diseasesDRUG CONSUMERS* BY AGE GROUP**1993-2014, thousands of people19931,5242,7537,3175,98617,580Up to 1415-3435-6465 and 10,59624,686* in the two days preceding the interview ** any possible differences in totals are due to the rounding of the absolute valuesHEALTH CONDITIONS AND REPORTED CHRONIC DISEASES2014, per 100 nsion Osteoporosis gicdiseases4.2Neurologicaldiseases
Induced abortions: there has been a sharp reduction since Lawn. 194/78 made induced abortions legal in Italy. 1982 and 1983were the peak years, with a number of interventions exceeding 230,000 per year and an abortion rate of 16.7 and 16.4respectively per 1,000 resident women aged 15 to 49. From thatmoment on, the number of induced abortions and the abortionrate progressively reduced to less than 8 per 1,000Body Mass Index (BMI): determined by dividing the body weightin kilograms by the squared height in meters. A BMI under 18.5is considered underweight, one of 18.5-24.99 is considered ahealthy weight, one of 25-29.99 is overweight and one of 30 ormore is obeseSMOKERS AGED 14 AND OVERBY NUMBER OF DAILYCIGARETTES SMOKEDIN 2014More than 204.7%Up to 521.9%11 to 2038.9%6 to1034.5%percentage composition8 HEALTHPERSONS BY BODY MASS INDEX2014, per 100 persons aged 18 and l44.83.0UnderweightHealthy weightOverweight10.29.7ObesePERSONS AGED 3 AND OVER WHO HAVE SEEN A DENTIST OR ORTHODONTIST BY AGE GROUPYears 2005 and 2013, per 100 persons of the same age groupVisits to a dentistHealth service dentistin the last 12 5 and overTotalPrivate ED ABORTIONS1980-2012, per 1,000 resident women aged 15-4915.314.811.59.39.48.97.9 7.61980198519901995200020052010 2012
Theatre and music: include theatre (prose and dialect theatre,literary recitals), opera and operetta, variety shows and musicals, ballets, puppet shows, circuses, various arts performances, classical, pop and jazz concerts.In 2013, theatre and music events in Italy were 169,672 for atotal of 33,105 million tickets sold. As to cinema, according toSiae, the number of individual screenings was 3,104,642 and thenumber of tickets sold 105,740 millionsREADERS AND AUDIENCEIN 2014TV watchers*91.1Radio listeners*56.7Newspaper readers**47.1Book readers**41.4* per 100 persons aged 3 and over** per 100 persons aged 6 and overCULTURE 9PERSONS AGED 6 AND OVER WHO HAVE READ* AT LEAST ONE BOOK IN THEIR LEISURE TIME BY SEX AND QUALIFICATIONYears 2009-2014, per 100 persons aged 6 and iversity degree or moreUpper secondary schoolLower secondary schoolPrimary school or no 48.074.951.132.524.641.4* in the last 12 months preceding the interviewENTERTAINMENT EVENT ATTENDANCE2014, per 100 persons aged 6 and seums, Discothequesart exhibitionsSporteventsClassicalmusic concertsOther Archaeologicalconcertssites,monumentsAVERAGE EXPENDITURE ON ENTERTAINMENT EVENTS2005-2013, euro2005200720092011EXPENDITURE PER INHABITANTTheatre and music Sport ENDITURE PER TICKETTheatre and music 310.6210.785.8227.2219.156.08
The school system is divided into six levels: pre-primary primary lower secondary upper secondary non-tertiary post-secondary (i.e. regional-funded post-secondary vocational training courses) tertiary (university, doctoral and specialisation courses)ENROLMENT RATE IN UPPERSECONDARY 092009/102010/112011/122012/132013/14Enrolment rate in upper secondary education: ratio of students enrolled to resident population aged 14-18, per 100. Fromschool year 2006/07 to 2009/10 the indicator includes data onstudents of first and second classes of vocational schools of theautonomous Province of Bolzano (under the 2007 Budget law)80.887.693.094.594.994.393.891.493.093.193.0* starting from 2005/06 schoolyear, the reference populationis that resulting from thePopulation Census 201110 EDUCATIONSCHOOLS, CLASSES AND STUDENTS BY TYPE OF SCHOOLSchool year ndarySchools 23,855 17,322 8,133 7,101Classes* 72,580 145,995 82,335 127,002Students 1,663,963 2,827,109 1,761,142 2,668,067% of female students 48.0 48.4 48.0 48.6% of students enrolled in public schools 71.1 93.4 96.2 95.8Foreigners per 100 students enrolled 10.1 10.0 9.6 6.8Repeaters per 100 students enrolled - 0.4 3.4 7.5Teachers** 81,874 200.798 138,915 206,479Students per teacher** 12.4 12.6 11.9 12.1* pre-primary values refer to sections ** data refer to public schools onlyACTUAL AVERAGE HOUSEHOLD EXPENDITURE ON EDUCATIONAL SERVICES2014, euro893696455School andUniversity feesPOPULATION AGED 15AND OVER BY EDUCATIONALQUALIFICATION AND SEXYear 2014,percentagecompositionNorthCentreSouth and the IslandsItaly707492360309391Private lessonsUniversitydegreePrimary schoollicence11.9%15.8%4-5 yearsuppersecondarydiploma31.1%Lower secondarylicence2-3 years35.2%upper secondarydiplomaMALES6.0%222212170208School transportUniversitydegreePrimary school13.5%licence23.8%4-5 yearsuppersecondarydiploma28.7%Lower secondarylicence2-3 years28.6%upper secondarydiploma5.4%FEMALES
approfondimentiUNIVERSITY GRADUATESBY GEOGRAPHICAL AREA*IN 2012North132,203Centre75,164South and the Islands 90,081Italy297,448* the geographical area isthe one where the universityis locatedThe university system: the university system is divided into threecycles. The first cycle includes three-year courses leading to thenew Bachelor’s degree. The second cycle, leading to the Master’sdegree, includes second-level courses which can be of two yearsduration (they can be accessed with the Bachelor’s degree) orhave a long single cycle structure (they can be accessed with anupper secondary school diploma and last 5-6 years: Architecture,Civil Engineering, Pharmacy, Dentistry, Veterinary science andMedicine). The third cycle includes three-year courses which can beaccessed with the Master’s degree and lead to the Doctoral degree.Although decreasing, some courses of the old system still exist, i.e.those lasting 4-6 years leading to the Master’s degree and thoselasting 3 years leading to the Bachelor’s degree.EDUCATION 11UNIVERSITY ENTRANCE RATE OF YOUNG PEOPLE AGED 19Academic years 2003/04-2012/13, per 100 persons aged 11/122012/13UNIVERSITY NEW ENTRANTS, ENROLLED STUDENTS AND GRADUATES BY FIELD OF STUDYAcademic year 2012/2013, absolute values and percentage changesNEW ENTRANTS*ENROLLED STUDENTSGRADUATES% change% change% changeTotalon previousTotalon previousTotalon previousyearyearyearMaths and physical science9,090-6.151,344-1.28,2240.3Chemistry and Pharmacy11,307-12.072,050-1.87,9532.5Life and natural mic and statistics36,347-10.6232,768-1.545,3123.5Political and social y7,673-12.965,217-2.914,354-1.9Physical .5* data refer to students enrolled for the first time and do not include students who have interrupted or completed another academic year** data refer to Bachelor’s and Master’s degree graduates (both from two-year and single cycle degree courses)ENROLMENTS AT UNIVERSITYAND GRADUATES* academic year 2012/2013, per 100persons aged 19-25;** year 2012, per 100 persons aged25. Data refer to students who haveobtained a second level degree:Master’s degree (both after twoyear and single cycle courses), andBachelor’s degree of the old systemENROLMENTS AT sFemalesTotal
Labour force survey: provides official estimates of employed, job-seekers and mainlabour market aggregates. Data are collected through 260,000 interviews carriedout more than once every year on a sample of 160,000 resident households (about370,000 individuals). People permanentlyliving abroad, in communities, religiousinstitutes, barracks and similar are notincluded in the survey. Since 2004, the survey has been carried out on a “continuous”basis as data are collected every week ofthe year, although results are publishedmonthly and every three monthsLabour force: includes persons employedand job-seekers12 LABOUR MARKETLABOUR FORCE BY WORKING STATUS, SEX AND GEOGRAPHICAL AREA2014, thousands of 852,126South and the 52542Centre311305South and the Islands879647Italy1,7421,494LABOUR FORCENorth7,0905,616Centre2,9962,431South and the 5EMPLOYED BY SECTOR OF ACTIVITY2004-2014, percentage 0.6%Services65.0%YEAR 2004Industry29.2%Services67.1%YEAR 2009Agriculture3.6%Industry26.9%Services69.5%YEAR 2014EMPLOYED BY ACTUAL WEEKLY HOURS WORKED AND SECTOR OF ACTIVITY2014, percentage valuesAgricultureIndustryServicesTotalAbsentfrom work4.79.68.18.4Up to10 hours2.81.33.42.811-30hours19.811.825.921.931 hours and over(total) (of which: 40 2.00.81.01.0
FIXED-TERM EMPLOYEDPERSONS ON TOTALEMPLOYEES IN 2014TOTALEu28ItalyGermanySpainFranceAGED .843.356.053.469.157.0Persons employed: all individuals aged 15 and over that in thereference week: have carried out at least 1 hour’s paid work have carried out at least 1 hour’s unpaid work in a familybusiness are absent from work (i.e. for holidays or illness)Job-seekers: all individuals aged 15-74 that: have been active on job search in the 30 days preceding theinterview and would be able to start work within two weeksfrom survey will begin a new work within three months from interview andwould be able to start work within two weeks from surveypercentage valuesLABOUR MARKET 13PERSONS EMPLOYED BY OCCUPATION, SECTOR OF ACTIVITY AND GEOGRAPHICAL AREA*2014, thousands of peopleNorthCentreSouth and the 49922,279* any possible differences in totals is due to the rounding of the absolute valuesPERSONS EMPLOYEDBY OCCUPATION2004 and 2014,percentage loyees75.3%Employees72.0%YEAR 2004YEAR 2014PERSONS EMPLOYED BY OCCUPATION AND EMPLOYMENT CONTRACT2014, thousands of peopleTOTAL: 22,279full time18,188EMPLOYEES: 16,780full time13,526SELF-EMPLOYED: 5,499part timefull time4,662837part time4,091part time3,254
Activity rate: ratio of labour force to the correspondent reference populationUNEMPLOYMENT RATESIN 2014TOTALMalesFemalesTotalAGED 15-24 ANNIMalesFemalesTotalLONG TERMMalesFemalesTotalEmployment rate: ratio of the employed to the correspondentreference populationUnemployment rate: ratio of job-seekers to labour forceLong-term unemployment rate: ratio of job-seekers for morethan 12 months to labour forceSemi-subordinate workers: freelance workers who performtheir work in a continuous and autonomous way under theemployer’s ntage valuesProject workers: their work must be referable to one or moreprojects or phases thereof14 LABOUR MARKETACTIVITY RATES BY GEOGRAPHICAL AREA AND SEX2014, percentage tre52.8South and the Islands54.463.9MalesFemalesTotalItalyLABOUR INDICATORS BY SEX AND GEOGRAPHICAL AREA2014, percentage valuesActivity rateEmployment EOGRAPHICAL AREANorth70.564.3Centre68.960.9South and the .88.611.420.712.7SEMI-SUBORDINATE AND PROJECT WORKERS BY GEOGRAPHICAL AREA, SECTOR OF ACTIVITY AND SEX2014, percentage compositionSouth andthe HICAL R OF ACTIVITYTOTAL NUMBER OF SEMI-SUBORDINATE WORKERS: 378,000Females56.9%SEX
Disability, old age, length of service andsurvivors’ pensions: paid in case of impairedwork abilities; due to age limits or at the endof a full insurance career; to survivors in caseof death of the pensioner or insured personprovided that all insurance and contributionrequirements are metCompensatory pensions: indemnities paid byreason of impairment or death (to survivorsin this case) caused by an event occurred onthe jobSocial assistance pensions: include non contributory pensions, social allowances,pensions for the blind and partially-sighted,for the deaf and the invalid and war pensionsRetirement rate: per cent ratio of pensionsto resident population on 31 December of thereference yearRelative benefit index: per cent ratio of average amount of pension to GDP per inhabitantWELFARE 15PENSIONS2013Disability, old ageand length ofCompensatoryAssistanceservice, 1Number (thousands)Total amount (millions of euros)Average yearly amount (euros)Expenditure/GdpRetirement rateRelative benefit indexTotal23,322272,74611,69516.8538.3743.91TOTAL EXPENDITURE FOR PENSIONS1981-2013, percentage of Gdp16.69 16.83 16.8514.3215.03 15.0714.75 14.68 14.62 3.09199119891987198512.28 12.12 12.361983198111.6512.6714.30PENSIONERS AND AVERAGE ANNUAL GROSS PENSION INCOMES BY GEOGRAPHICAL AREA2012 and 2013NumberNorthCentreSouth and the 2012Average 13,202,9335,044,12815,949,142* the total does not include pensioners residing abroad and a few cases for which it was not possible to identify the residence2013Average income(euro)17,82018,15115,04117,008
POPULATION AGED65 AND OVERN1 JA2015LIFE EXPECTANCY AT 651431.7201157.720,007,068ulationr15 popednu#t ofPercen January 2015on 132.6%CIVIL STATUSWidowerSingle6.8WomenEmployed people over 65Year of single people is over 6561.6% women114 thousand29% menin 2002in 2014People aged 65-74 years, percentage values, year 20142.7%*MenIn good healthWith one or more chronic diseases36.2 44.078.3 73.6Drug consumersPlaying sport on a regular basisOverweight6.7 million5.6 million76.9 75.09.2 11.240.9 52.8Drinking alcohol outside of mealsSmokersConsuming 5 or more portionsof greens, vegetables and fruit a day77.6 %* 72.3 %*355 thousand7.2 29.29.4 16.45.6 4.8Woman Men*of total employedCULTURAL CONSUMPTIONEDUCATIONGross annual pensionincome for people over 65Year 2013Women and men over 65 years by qualification, percentage values year 2014Master’s/Primary school diploma,Doctoral degreeno qualificationMaster
of Italy's social, economic and environmental phenomena at various levels of geographical detail. This is the mission Istat is pursuing through accurate analyses and investigations. Divided into 16 themes, the 2015 edition of Italy in figures synthetically describes the main economic, demographic, social and territorial aspects of Italy.




![The GIANO-TNG spectrometer [6269-46]](/img/1/spie-6269-46.jpg)

