Transcription
Chapter 5Cost-Volume-Profit RelationshipsSolutions to Questions5-1The contribution margin (CM) ratio isthe ratio of the total contribution margin to totalsales revenue. It can also be expressed as theratio of the contribution margin per unit to theselling price per unit. It is used in target profitand break-even analysis and can be used toquickly estimate the effect on profits of achange in sales revenue.higher unit volume. (b) If the fixed costincreased, then both the fixed cost line and thetotal cost line would shift upward and the breakeven point would occur at a higher unit volume.(c) If the variable cost per unit increased, thenthe total cost line would rise more steeply andthe break-even point would occur at a higherunit volume.5-2Incremental analysis focuses on thechanges in revenues and costs that will resultfrom a particular action.5-7The margin of safety is the excess ofbudgeted (or actual) sales over the break-evenvolume of sales. It is the amount by which salescan drop before losses begin to be incurred.5-3All other things equal, Company B, withits higher fixed costs and lower variable costs,will have a higher contribution margin ratio thanCompany A. Therefore, it will tend to realize alarger increase in contribution margin and inprofits when sales increase.5-4Operating leverage measures the impacton net operating income of a given percentagechange in unit sales. The degree of operatingleverage at a given level of sales is computed bydividing the contribution margin at that level ofsales by the net operating income at that levelof sales.5-5The break-even point is the level ofsales at which profits are zero.5-6(a) If the selling price decreased, thenthe total revenue line would rise less steeply,and the break-even point would occur at a5-8The sales mix is the relative proportionsin which a company’s products are sold. Theusual assumption in cost-volume-profit analysisis that the sales mix will not change.5-9A higher break-even point and a lowernet operating income could result if the salesmix shifted from high contribution marginproducts to low contribution margin products.Such a shift would cause the averagecontribution margin ratio in the company todecline, resulting in less total contributionmargin for a given amount of sales. Thus, netoperating income would decline. With a lowercontribution margin ratio, the break-even pointwould be higher because more sales would berequired to cover the same amount of fixedcosts. The McGraw-Hill Companies, Inc., 2021. All rights reserved.Solutions Manual, Chapter 51
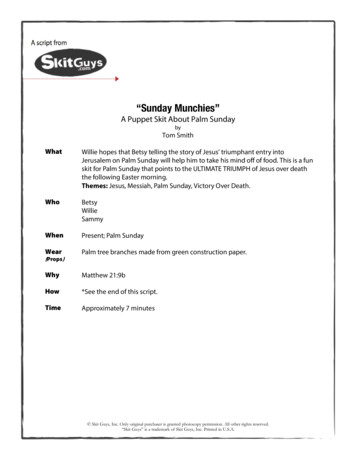
Chapter 5: Applying ExcelThe completed worksheet is shown below. The McGraw-Hill Companies, Inc., 2021. All rights reserved.2Managerial Accounting, 17th Edition
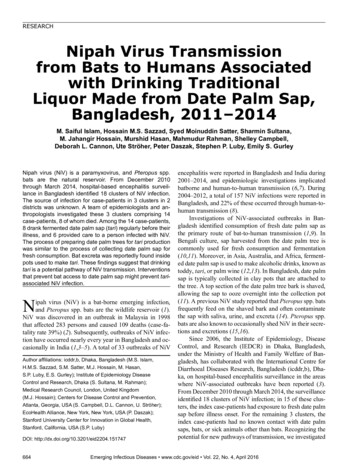
Chapter 5: Applying Excel (continued)The completed worksheet, with formulas displayed, is shown below. The McGraw-Hill Companies, Inc., 2021. All rights reserved.Solutions Manual, Chapter 53
Chapter 5: Applying Excel (continued)1. When the fixed expenses are changed to 270,000, the worksheetchanges as shown below:The margin of safety percentage is now 10%, whereas it was 20%before. This change occurred because the increase in fixed expensesincreased the break-even point and hence reduced the margin of safetyavailable for the current level of unit sales. The McGraw-Hill Companies, Inc., 2021. All rights reserved.4Managerial Accounting, 17th Edition
Chapter 5: Applying Excel (continued)2. With the changes in the data, the worksheet should look like this:The margin of safety percentage is 13% and the degree of operatingleverage is 8. The McGraw-Hill Companies, Inc., 2021. All rights reserved.Solutions Manual, Chapter 55
Chapter 5: Applying Excel (continued)3. The degree of operating leverage can be used to estimate the expectedpercentage increase in net operating income from a 15% increase inunit sales as follows:Percentage change in net operating income Degree of operatingleverage Percentage change in sales 8.00 15% 120%An increase of 120% over the current net operating income of 60,000would result in net operating income of 132,000. This is verified in part(4) that follows. The McGraw-Hill Companies, Inc., 2021. All rights reserved.6Managerial Accounting, 17th Edition
Chapter 5: Applying Excel (continued)4. Increasing the unit sales by 15% results in net operating income of 132,000—an increase of 120% over the previous net operating incomeof 60,000. The McGraw-Hill Companies, Inc., 2021. All rights reserved.Solutions Manual, Chapter 57
Chapter 5: Applying Excel (continued)5. a. The initial plan for the Western Hombre motorcycle is summarizedbelow: The McGraw-Hill Companies, Inc., 2021. All rights reserved.8Managerial Accounting, 17th Edition
Chapter 5: Applying Excel (continued)5. b. The modified plan for the Western Hombre motorcycle is summarizedbelow: The McGraw-Hill Companies, Inc., 2021. All rights reserved.Solutions Manual, Chapter 59
Chapter 5: Applying Excel (continued)This does not appear to be a good plan. At best, Thad would onlybreak even—and that assumes that 600 units would still be solddespite the drastic reduction in advertising expenses. The margin ofsafety is zero which means that any decrease in sales to below 600units would result in a loss.The degree of operating leverage is displayed in the worksheet as#DIV/0!. This means that Excel is unable to compute the degree ofoperating leverage because the divisor is 0. The divisor is 0 becausethe degree of operating leverage is the contribution margin dividedby the net operating income and the net operating income is zero.Technically, the degree of operating leverage is undefined when netoperating income is zero. The McGraw-Hill Companies, Inc., 2021. All rights reserved.10Managerial Accounting, 17th Edition
The Foundational 151. The contribution margin per unit is calculated as follows:Total contribution margin (a) .Total units sold (b) .Contribution margin per unit (a) (b) . 8,0001,000 units 8.00 per unitThe contribution margin per unit ( 8) can also be derived by calculatingthe selling price per unit of 20 ( 20,000 1,000 units) anddeducting the variable expense per unit of 12 ( 12,000 1,000units).2. The contribution margin ratio is calculated as follows:Total contribution margin (a) .Total sales (b) .Contribution margin ratio (a) (b) . 8,000 20,00040%3. The variable expense ratio is calculated as follows:Total variable expenses (a) .Total sales (b) .Variable expense ratio (a) (b) . 12,000 20,00060%4. The increase in net operating income is calculated as follows:Contribution margin per unit (a) .Increase in unit sales (b) .Increase in net operating income (a) (b) . 8.00 per unit1 unit 8.005. If sales decline to 900 units, the net operating income would becomputed as follows:Sales (900 units) .Variable expenses .Contribution margin .Fixed expenses .Net operating income .Total Per Unit 18,00010,8007,2006,000 1,200 20.0012.00 8.00 The McGraw-Hill Companies, Inc., 2021. All rights reserved.Solutions Manual, Chapter 511
The Foundational 15 (continued)6. The new net operating income would be computed as follows:Sales (900 units) .Variable expenses .Contribution margin .Fixed expenses .Net operating income .Total Per Unit 19,80010,8009,0006,000 3,000 22.0012.00 10.007. The new net operating income would be computed as follows:Sales (1,250 units) .Variable expenses .Contribution margin .Fixed expenses .Net operating income .Total Per Unit 25,00016,2508,7507,500 1,250 20.0013.00 7.008. The equation method yields the break-even point in unit sales, Q, asfollows:Profit 0 0 8QQQ Unit CM Q Fixed expenses( 20 12) Q 6,000( 8) Q 6,000 6,000 6,000 8750 units9. The equation method yields the dollar sales to break-even as follows:Profit 0 0.40 Sales Sales Sales CM ratio Sales Fixed expenses0.40 Sales 6,000 6,000 6,000 0.40 15,000The dollar sales to break-even ( 15,000) can also be computed bymultiplying the selling price per unit ( 20) by the unit sales to breakeven (750 units). The McGraw-Hill Companies, Inc., 2021. All rights reserved.12Managerial Accounting, 17th Edition
The Foundational 15 (continued)10. The equation method yields the target profit as follows:Profit 5,000 5,000 8QQQ Unit CM Q Fixed expenses( 20 12) Q 6,000( 8) Q 6,000 11,000 11,000 81,375 units11. The margin of safety in dollars is calculated as follows:Sales .Break-even sales (at 750 units) .Margin of safety (in dollars) . 20,00015,000 5,000The margin of safety as a percentage of sales is calculated as follows:Margin of safety (in dollars) (a) .Sales (b).Margin of safety percentage (a) (b) . 5,000 20,00025%12. The degree of operating leverage is calculated as follows:Contribution margin (a) . .Net operating income (b).Degree of operating leverage (a) (b) . 8,000 2,0004.013. A 5% increase in unit sales should result in a 20% increase in netoperating income, computed as follows:Degree of operating leverage (a) .Percent increase in sales (b) .Percent increase in net operating income (a) (b) .4.05%20%14. The degree of operating leverage is calculated as follows:Contribution margin ( 20,000 – 6,000) (a) .Net operating income (b) .Degree of operating leverage (a) (b) . 14,000 2,0007.0 The McGraw-Hill Companies, Inc., 2021. All rights reserved.Solutions Manual, Chapter 513
The Foundational 15 (continued)15. A 5% increase in unit sales should result in a 35% increase in netoperating income, computed as follows:Degree of operating leverage (a) .Percent increase in sales (b) .Percent increase in net operating income (a) (b) .7.05%35% The McGraw-Hill Companies, Inc., 2021. All rights reserved.14Managerial Accounting, 17th Edition
Exercise 5-1 (20 minutes)1. The revised net operating income would be:Sales (10,100 units) .Variable expenses .Contribution margin .Fixed expenses .Net operating income .TotalPer Unit 353,500202,000151,500135,000 16,500 35.0020.00 15.00You can get the same net operating income using the followingapproach:Original net operating income .Change in contribution margin(100 units 15.00 per unit) .New net operating income . 15,0001,500 16,5002. The revised net operating income would be:Sales (9,900 units) .Variable expenses .Contribution margin .Fixed expenses .Net operating income .Total 346,500198,000148,500135,000 13,500Per Unit 35.0020.00 15.00You can get the same net operating income using the followingapproach:Original net operating income .Change in contribution margin(-100 units 15.00 per unit) .New net operating income . 15,000(1,500) 13,500 The McGraw-Hill Companies, Inc., 2021. All rights reserved.Solutions Manual, Chapter 515
Exercise 5-1 (continued)3. The revised net operating income would be:Sales (9,000 units) .Variable expenses .Contribution margin .Fixed expenses .Net operating income .Total Per Unit 315,000180,000135,000135,000 0 35.0020.00 15.00Note: This is the company’s break-even point. The McGraw-Hill Companies, Inc., 2021. All rights reserved.16Managerial Accounting, 17th Edition
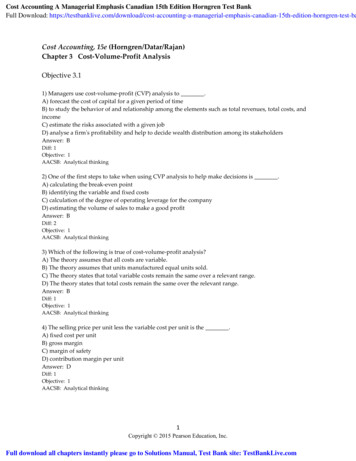
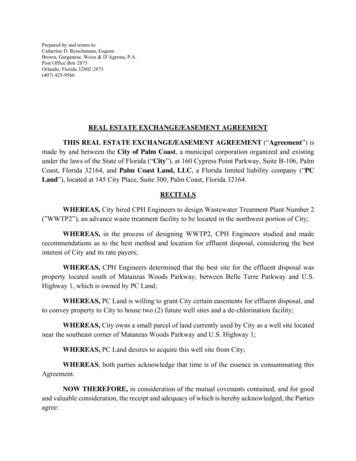
Exercise 5-2 (30 minutes)1. The CVP graph can be plotted using the three steps outlined in the text.The graph appears on the next page.Step 1. Draw a line parallel to the volume axis to represent the totalfixed expense. For this company, the total fixed expense is 24,000.Step 2. Choose some volume of sales and plot the point representingtotal expenses (fixed and variable) at the activity level you haveselected. We’ll use the sales level of 8,000 units.Fixed expenses .Variable expenses (8,000 units 18 per unit) .Total expense . 24,000144,000 168,000Step 3. Choose some volume of sales and plot the point representingtotal sales dollars at the activity level you have selected. We’ll use thesales level of 8,000 units again.Total sales revenue (8,000 units 24 per unit) . 192,0002. The break-even point is the point where the total sales revenue and thetotal expense lines intersect. This occurs at sales of 4,000 units. Thiscan be verified as follows:Profit Unit CM Q Fixed expenses( 24 18) 4,000 24,000 6 4,000 24,000 24,000 24,000 0 The McGraw-Hill Companies, Inc., 2021. All rights reserved.Solutions Manual, Chapter 517
Exercise 5-2 (continued)CVP Graph 200,000Dollars 150,000 100,000 50,000 002,0004,0006,0008,000Volume in UnitsFixed ExpenseTotal ExpenseTotal Sales Revenue The McGraw-Hill Companies, Inc., 2021. All rights reserved.18Managerial Accounting, 17th Edition
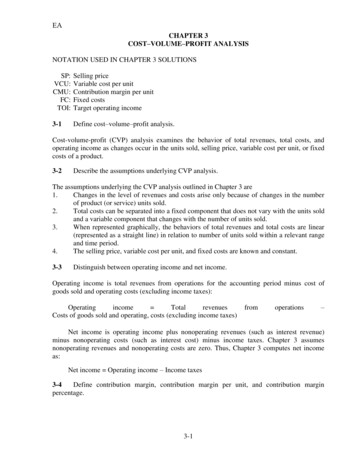
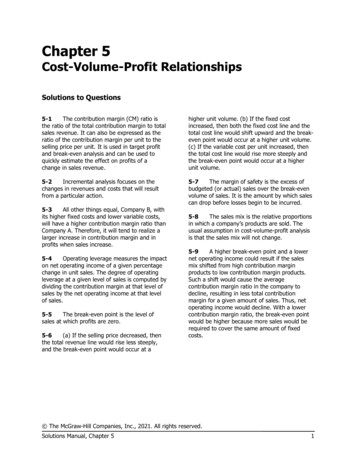
Exercise 5-3 (15 minutes)1. The profit graph is based on the following simple equation:Profit Unit CM Q Fixed expensesProfit ( 16 11) Q 16,000Profit 5 Q 16,000To plot the graph, select two different levels of sales such as Q 0 andQ 4,000. The profit at these two levels of sales are - 16,000 ( 5 0 16,000) and 4,000 ( 5 4,000 16,000).Profit Graph 5,000 0Profit- 5,000- 10,000- 15,000- 20,00005001,000 1,500 2,000 2,500 3,000 3,500 4,000Sales Volume in Units The McGraw-Hill Companies, Inc., 2021. All rights reserved.Solutions Manual, Chapter 519
Exercise 5-3 (continued)2. Looking at the graph, the break-even point appears to be 3,200 units.This can be verified as follows:Profit Unit CM Q Fixed expenses 5 Q 16,000 5 3,200 16,000 16,000 16,000 0 The McGraw-Hill Companies, Inc., 2021. All rights reserved.20Managerial Accounting, 17th Edition
Exercise 5-4 (10 minutes)1. The company’s contribution margin (CM) ratio is:Total sales .Total variable expenses .Total contribution margin (a) . 200,000120,000 80,000Total contribution margin (a) .Total sales (b).CM ratio (a) (b) . 80,000 200,00040%2. The change in net operating income from an increase in total sales of 1,000 can be estimated by using the CM ratio as follows:Change in total sales (a) .CM ratio (b) .Estimated change in net operating income (a) (b) . 1,00040% 400This computation can be verified as follows:Total sales (a) .Total units sold (b) .Selling price per unit (a) (b) . 200,00050,000 units 4.00 per unitIncrease in total sales (a) .Selling price per unit (b) .Increase in unit sales (a) (b) . 1,000 4.00 per unit250 unitsIncrease in unit sales .Original total unit sales .New total unit sales .250 units50,000 units50,250 unitsTotal unit sales .Sales .Variable expenses .Contribution margin .Fixed expenses .Net operating income .OriginalNew50,00050,250 200,000 201,000120,000 120,60080,00080,40065,00065,000 15,000 15,400 The McGraw-Hill Companies, Inc., 2021. All rights reserved.Solutions Manual, Chapter 521
Exercise 5-5 (20 minutes)1. The following table shows the effect of the proposed change in monthlyadvertising budget:Sales WithAdditionalCurrent AdvertisingSalesBudgetDifferenceSales . 180,000 189,000Variable expenses . 126,000132,300Contribution margin .54,00056,700Fixed expenses .30,00035,000Net operating income . 24,000 21,700 9,0006,3002,7005,000 (2,300)Assuming no other important factors need to be considered, theincrease in the advertising budget should not be approved because itwould lead to a decrease in net operating income of 2,300.Alternative Solution 1Expected total contribution margin: 189,000 30% CM ratio .Present total contribution margin: 180,000 30% CM ratio .Incremental contribution margin .Change in fixed expenses:Less incremental advertising expense .Change in net operating income . 56,70054,0002,7005,000 (2,300)Alternative Solution 2Incremental contribution margin: 9,000 30% CM ratio .Less incremental advertising expense .Change in net operating income . 2,7005,000 (2,300) The McGraw-Hill Companies, Inc., 2021. All rights reserved.22Managerial Accounting, 17th Edition
Exercise 5-5 (continued)2. The 2 increase in variable expense will cause the unit contributionmargin to decrease from 27 to 25 with the following impact on netoperating income:Expected total contribution margin with thehigher-quality components:2,000 units 1.1 25 per unit .Present total contribution margin:2,000 units 27 per unit .Change in total contribution margin. 55,00054,000 1,000Assuming no change in fixed expenses, the net operating income willalso increase by 1,000. The higher-quality components should be used. The McGraw-Hill Companies, Inc., 2021. All rights reserved.Solutions Manual, Chapter 523
Exercise 5-6 (20 minutes)1. The break-even point in unit sales, Q, is computed as follows:Profit 0 0 3QQQ Unit CM Q Fixed expenses( 15 12) Q 4,200( 3) Q 4,200 4,200 4,200 31,400 baskets2. The break-even point in dollar sales is computed as follows:Unit sales to break even (a) .Selling price per unit (b) .Dollar sales to break even (a) (b) .1,400 15 21,0003. The new break-even point in unit sales, Q, is computed as follows:Profit 0 0 3QQQ Unit CM Q Fixed expenses( 15 12) Q 4,800( 3) Q 4,800 4,800 4,800 31,600 basketsThe break-even point in dollar sales is computed as follows:Unit sales to break even (a) .Selling price per unit (b) .Dollar sales to break even (a) (b) .1,600 15 24,000 The McGraw-Hill Companies, Inc., 2021. All rights reserved.24Managerial Accounting, 17th Edition
Exercise 5-7 (10 minutes)1. The required unit sales, Q, to attain the target profit is computed asfollows:Profit 10,000 10,000 40 QQQ Unit CM Q Fixed expenses( 120 80) Q 50,000( 40) Q 50,000 10,000 50,000 60,000 401,500 units2. One approach to solving this requirement is to compute the unit salesrequired to attain the target profit and then multiply this quantity by theselling price per unit:Profit 15,000 15,000 40 Q Q Q Unit CM Q Fixed expenses( 120 80) Q 50,000( 40) Q 50,000 15,000 50,000 65,000 401,625 unitsUnit sales to attain the target profit (a).Selling price per unit (b) .Dollar sales to attain target profit (a) (b) .1,625 120 195,000 The McGraw-Hill Companies, Inc., 2021. All rights reserved.Solutions Manual, Chapter 525
Exercise 5-8 (10 minutes)1. To compute the margin of safety, we must first compute the break-evenunit sales.Profit 0 0 10QQQ Unit CM Q Fixed expenses( 30 20) Q 7,500( 10) Q 7,500 7,500 7,500 10750 units; or, at 30 per unit, 22,500Sales (at the budgeted volume of 1,000 units) .Less break-even sales (at 750 units) .Margin of safety (in dollars) . 30,00022,500 7,5002. The margin of safety as a percentage of sales is as follows:Margin of safety (in dollars) (a) . 7,500Sales (b). 30,000Margin of safety percentage (a) (b) .25% The McGraw-Hill Companies, Inc., 2021. All rights reserved.26Managerial Accounting, 17th Edition
Exercise 5-9 (20 minutes)1. The company’s degree of operating leverage would be computed asfollows:Contribution margin (a) .Net operating income (b).Degree of operating leverage (a) (b) . 48,000 10,0004.82. A 5% increase in unit sales should result in a 24% increase in netoperating income, computed as follows:Degree of operating leverage (a) .Percent increase in unit sales (b) .Estimated percent increase in net operating income (a) (b) .4.85%24%3. The new income statement reflecting the change in unit sales is:Sales .Variable expenses .Contribution margin .Fixed expenses .Net operating income .Amount 84,00033,60050,40038,000 12,400Percentof Sales100%40%60%Net operating income reflecting change in sales .Original net operating income (a) .Change in net operating income (b) .Percent change in net operating income (b) (a) . 12,40010,000 2,40024% The McGraw-Hill Companies, Inc., 2021. All rights reserved.Solutions Manual, Chapter 527
Exercise 5-10 (20 minutes)1. The overall contribution margin ratio can be computed as follows:Overall CM ratio Total contribution marginTotal sales 30,000 30% 100,0002. The overall break-even point in dollar sales can be computed as follows:Overall break-even Total fixed expensesOverall CM ratio 24,000 80,00030%3. To construct the required income statement, we must first determinethe relative sales mix for the two products:Original dollar sales .Percent of total .Sales at break-even .Sales .Variable expenses* .Contribution margin .Fixed expenses .Net operating income .Claimjumper Makeover 30,00030% 24,000 70,00070% 56,000Claimjumper Makeover 24,00016,000 8,000 56,00040,000 16,000Total 100,000100% 80,000Total 80,00056,00024,00024,000 0*Claimjumper variable expenses: ( 24,000/ 30,000) 20,000 16,000Makeover variable expenses: ( 56,000/ 70,000) 50,000 40,000 The McGraw-Hill Companies, Inc., 2021. All rights reserved.28Managerial Accounting, 17th Edition
Exercise 5-11 (20 minutes)a.Number of units sold .Sales .Variable expenses.Contribution margin .Fixed expenses.Net operating income .Number of units sold .Sales .Variable expenses.Contribution margin .Fixed expenses.Net operating income (loss).b.Sales.Variable expenses .Contribution margin .Fixed expenses .Net operating income.Sales .Variable expenses .Contribution margin .Fixed expenses .Net operating income (loss).Case #115,000 180,000120,00060,00050,000 10,000** 12*8 4*Case #24,000 100,000 *60,00040,00032,000 * 8,000 *Case #3Case #410,000 *6,000 * 200,000 20 300,000 *70,000 *7210,000130,000 13 *90,000118,000100,000 * 12,000 * (10,000) *Case #1 500,000 * 100%400,00080%100,00020% *93,000 7,000 *Case #3 2515 10 * 5035 15Case #2 400,000 * 100%260,000 * 65%140,00035%100,000 * 40,000Case #4 250,000100% 600,000 * 100%100,00040%420,000 * 70%150,00060% * 180,00030%130,000 *185,000 20,000 * (5,000) **Given The McGraw-Hill Companies, Inc., 2021. All rights reserved.Solutions Manual, Chapter 529
Exercise 5-12 (30 minutes)1.Flight DynamicAmount %Sales . 150,000 100Variableexpenses .30,000 20Contributionmargin . 120,000 80Fixed expensesNet operatingincome .Sure ShotAmount % 250,000 100Total CompanyAmount% 400,000100.0160,00064190,00047.5 90,00036210,000183,75052.5* 26,250* 210,000 400,000 52.5%2. The break-even point for the company as a whole is:Dollar sales to Fixed expensesbreak evenOverall CM ratio 183,750 350,0000.5253. The additional contribution margin from the additional sales is computedas follows: 100,000 52.5% CM ratio 52,500Assuming no change in fixed expenses, all of this additional contributionmargin of 52,500 should drop to the bottom line as increased netoperating income.This answer assumes no change in selling prices, variable costs perunit, fixed expense, or sales mix. The McGraw-Hill Companies, Inc., 2021. All rights reserved.30Managerial Accounting, 17th Edition
Exercise 5-13 (20 minutes)1. Sales (20,000 units 1.15 23,000 units).Variable expenses .Contribution margin .Fixed expenses .Net operating income .TotalPer Unit 345,000 15.00207,0009.00138,000 6.0070,000 68,0002. Sales (20,000 units 1.25 25,000 units).Variable expenses .Contribution margin .Fixed expenses .Net operating income . 337,500225,000112,50070,000 42,500 13.509.00 4.503. Sales (20,000 units 0.95 19,000 units).Variable expenses .Contribution margin .Fixed expenses .Net operating income . 313,500171,000142,50090,000 52,500 16.509.00 7.504. Sales (20,000 units 0.90 18,000 units).Variable expenses .Contribution margin .Fixed expenses .Net operating income . 302,400172,800129,60070,000 59,600 16.809.60 7.20 The McGraw-Hill Companies, Inc., 2021. All rights reserved.Solutions Manual, Chapter 531
Exercise 5-14 (30 minutes)1. Variable expenses: 40 (100% – 30%) 282. The break-even points in unit sales (Q) and dollar sales are computed asfollows:Selling price .Variable expenses .Contribution margin .Profit 0 12Q Q Q 40 100%28 70% 12 30%Unit CM Q Fixed expenses 12 Q 180,000 180,000 180,000 1215,000 unitsIn dollar sales: 15,000 units 40 per unit 600,000Alternative solution:Profit 0 0.30 Sales Sales Sales CM ratio Sales Fixed expenses0.30 Sales 180,000 180,000 180,000 0.30 600,000In unit sales: 600,000 40 per unit 15,000 units3. The unit sales and dollar sales needed to attain the target profit arecomputed as follows:Profit 60,000 12Q 12QQQ Unit CM Q Fixed expenses 12 Q 180,000 60,000 180,000 240,000 240,000 1220,000 unitsIn dollar sales: 20,000 units 40 per unit 800,000 The McGraw-Hill Companies, Inc., 2021. All rights reserved.32Managerial Accounting, 17th Edition
Exercise 5-14 (continued)Alternative solution:Profit 60,000 0.30 Sales Sales Sales CM ratio Sales Fixed expenses0.30 Sales 180,000 240,000 240,000 0.30 800,000In unit sales: 800,000 40 per unit 20,000 units4. The new break-even points in unit sales and dollar sales are computedas follows:The company’s new cost/revenue relation will be:Selling price .Variable expenses ( 28 – 4) .Contribution margin .Profit 0 16QQQ 40 100%24 60% 16 40%Unit CM Q Fixed expenses( 40 24) Q 180,000 180,000 180,000 16 per unit11,250 unitsIn dollar sales: 11,250 units 40 per unit 450,000Alternative solution:Profit 0 0.40 Sales Sales Sales CM ratio Sales Fixed expenses0.40 Sales 180,000 180,000 180,000 0.40 450,000In unit sales: 450,000 40 per unit 11,250 units The McGraw-Hill Companies, Inc., 2021. All rights reserved.Solutions Manual, Chapter 533
Exercise 5-14 (continued)4. The dollar sales required to attain the target profit is computed asfollows:Profit 60,000 0.40 Sales Sales Sales CM ratio Sales Fixed expenses0.40 Sales 180,000 240,000 240,000 0.40 600,000 The McGraw-Hill Companies, Inc., 2021. All rights reserved.34Managerial Accounting, 17th Edition
Exercise 5-15 (15 minutes)1.Sales (15,000 games) .Variable expenses .Contribution margin .Fixed expenses.Net operating income .Total 300,00090,000210,000182,000 28,000PerUnit 206 14The degree of operating leverage is:Degree of operating Contribution marginleverageNet operating income 210,000 7.5 28,0002. a. Sales of 18,000 games represent a 20% increase over last year’ssales. Because the degree of operating leverage is 7.5, net operatingincome should increase by 7.5 times as much, or by 150% (7.5 20%).b. The expected total dollar amount of net operating income for nextyear would be:Last year’s net operating income .Expected increase in net operating income nextyear (150% 28,000) .Total expected net operating income . 28,00042,000 70,000 The McGraw-Hill Companies, Inc., 2021. All rights reserved.Solutions Manual, Chapter 535
Exercise 5-16 (30 minutes)1. The contribution margin per person would be:Price per ticket .Variable expenses:Dinner.Favors
Profit CM ratio Sales Fixed expenses 0 0.40 Sales 6,000 0.40 Sales 6,000 Sales 6,000 0.40 Sales 15,000 The dollar sales to break-even ( 15,000) can also be computed by multiplying the selling price per unit ( 20) by the unit sales to break- even (750 units). The McGraw-Hill Companies, Inc., 2021.