Transcription
Logistic RegressionSusan Alber, Ph.D.February 10, 20211
Learning goals Understand the basics of the logistic regression model Understand important differences between logistic regression and linear regression Be able to interpret results from logistic regression(focusing on interpretation of odds ratios)If the only thing you learn from this lecture is how to interpret odds ratio then we haveboth succeeded.2
Terminology for this lectureIn most public health research we haveOne or more outcome variable(s) (indicators of disease are common outcomes)One or more predictor variable(s) (factors that increase or decrease risk of diseaseare common predictors)Research goal: determine if there is a significant relationship between the predictorvariables and the outcome variable(s)For this talk we will call any outcome variable “disease”and any predictor variable “exposure” (exposure is anything that increases ordecreases risk of disease)3
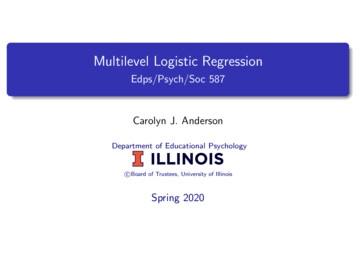
Choice of statical methodsContinuous (numerical) outcome Binary outcome(e.g. blood pressure)(e.g. disease)Categorical predictors(e.g. sex, race)2 levels T-test 2 levels ANOVAChi-square testContinuous predictors(e.g. age)Linear regressionLogistic regressionANOVA analysis of variance4
exampleOutcome: coronary artery disease (CAD) (yes/no)CAD coronary artery diseasePredictorsSex (categorical with 2 levels male/female)Age (continuous 24-72)Weight (categorical with 4 levels)Body mass index (BMI)weight 18.5underweight18.5 - 24.9normal25.0 - 29.9overweight 30obese5
Outcome (CAD) is binary (disease / no disease)andOne of the predictors is continuous (age)Therefore we need to use logistic regression6
Similarities between linear and logistic regression Based on a mathematical model of the dependence of a single outcome variable(e.g. disease) on one or more predictor (exposure) variablesPredictors outcome Predictor (exposure) variables can include any combination of continuous (e.g. age)and categorical (e.g. sex) predictors Model allows you to estimate exposure effects adjusted for confounders. Uses p-values to determine if predictors are significantly related to the outcome Uses confidence intervals for estimates of interest7
key differences between linear and logistic regressionLinear regression: outcome is continuous (e.g. blood pressure)Logistic regression: outcome is binary (e.g. disease / no disease)Linear: dependence of the outcome on predictors quantified byDifferences between means (for categorical predictors)Slopes (for continuous predictors)Logistic regression: dependence of outcome on predictors quantified by odds ratiosKey challenge for understanding logistic regression is being able to interpretodds ratios (to be defined soon)8
example: looking first at sex as a predictor of CADSexNo Disease (CAD)Disease (CAD)male162 (43%)217 (57%)female136 (56%)105 (44%)Predictor is binary (male/female)Outcome is binary (CAD / no CAD)Therefore we use chi-square testChi-square p-value 0.0009 males have significantly larger risk of CADWe do not need logistic regression for this because the predictor is not continuous (not a number)9
example: looking first at sex as a predictor of CADSexNo Disease (CAD)Disease (CAD)male162 (43%)217 (57%)female136 (56%)105 (44%)Three ways to quantify the (significant) sex effect1. Risk difference2. Relative risk3. Odds ratios (what you would get from logistic regression)10
Risk difference and relative riskSexNo Diseasediseasemale162 (42.7%)217 (57.3%)female136 (56.4%)105 (43.6%)Risk difference P(disease for male) – P(disease for females) 0.573 – 0.436 0.137Interpretation: males are about 14 percent more likely to have CADRelative risk (also called risk ratio) 𝑃𝑃 ��𝑑 𝑓𝑓𝑓𝑓𝑓𝑓 𝑚𝑚𝑚𝑚𝑚𝑚𝑚𝑚𝑚𝑚𝑃𝑃 ��𝑑 𝑓𝑓𝑓𝑓𝑓𝑓 ��𝑓 0.5730.436 1.31Interpretation: males are about 1.3 times as likely to have CAD11
odds ratiosThe plandefine oddsdefine odds ratios for sex and CADdefine odds ratios for weight (4 levels) and CADdefine odds ratios for age (continuous)logistic regression with sex, weight, and age as predictors12
What are the odds?Suppose have game where the odds of winning are 2 to 1on average for every 2 games won 1 game is lost on average win 2 out of every 3 games probability of winning is 2/3 probability of loosing is 1 – (probability of winning) 1 - 2/3 1/3odds 𝑃𝑃 𝑤𝑤𝑤𝑤𝑤𝑤𝑃𝑃 l𝑜𝑜𝑜𝑜𝑜𝑜 More generally for any eventodds 𝑃𝑃 𝑤𝑤𝑤𝑤𝑤𝑤1 𝑃𝑃 𝑤𝑤𝑤𝑤𝑤𝑤 (2/3)(1/3) 2𝑃𝑃 event1 𝑃𝑃 event13
Odds ratios (OR)odds ratio is a ratio of odds under two different conditions: for example exposed versusunexposed𝑜𝑜𝑜𝑜𝑜𝑜𝑜𝑜 ��𝑑 𝑓𝑓𝑓𝑓𝑓𝑓 ��𝑒OR ���𝑑𝑑𝑑𝑑𝑑𝑑𝑑𝑑𝑑 𝑓𝑓𝑓𝑓𝑓𝑓 ��𝑢𝑢𝑢𝑢𝑢)Because odds are always positive OR 0OR 1 odds(disease for exposed) odds(disease for unexposed) Exposure does not affect risk of diseaseOR 1 odds(disease for exposed) odds(disease for unexposed) exposed have higher risk of disease than unexposedOR 1 odds(disease for exposed) odds(disease for unexposed) exposed have lower risk of disease than unexposed14
Null values for hypothesis testingNull hypothesis is P(disease given exposed) P(disease given unexposed)The null values are𝑜𝑜𝑜𝑜𝑜𝑜𝑜𝑜 ��𝑑 𝑓𝑓𝑓𝑓𝑓𝑓 ��𝑒Odds ratios (OR) ���𝑑𝑑𝑑𝑑𝑑𝑑𝑑𝑑𝑑 𝑓𝑓𝑓𝑓𝑓𝑓 ��𝑢𝑢𝑢𝑢𝑢) 1Relative risk 𝑃𝑃 ��𝑑 𝑓𝑓𝑓𝑓𝑓𝑓 ��𝑒𝑃𝑃 ��𝑑 𝑓𝑓𝑓𝑓𝑓𝑓 ��𝑢𝑢𝑢𝑢𝑢 1Risk difference P(disease given exposed) - P(disease given unexposed) 015
SexCADnProbability of diseaseoddsmale217379217/379 0.5730.573/(1-0.573) 1.342female105241105/241 0.4360.436/(1-0.436) 0.773𝑜𝑜𝑜𝑜𝑜𝑜𝑜𝑜 ��𝑑 𝑓𝑓𝑓𝑓𝑓𝑓 𝑚𝑚𝑚𝑚𝑚𝑚𝑚𝑚OR ���𝑑𝑑𝑑𝑑𝑑𝑑𝑑𝑑𝑑 𝑓𝑓𝑓𝑓𝑓𝑓 𝑓𝑓𝑓𝑓𝑓𝑓𝑓𝑓𝑓𝑓𝑓𝑓) 1.342/0.773 1.74The odds of CAD for men is 1.74 times larger than for womenIt is common practice to make the numerator the category we expect to have higher odds, but it is not necessary.OR 𝑜𝑜𝑜𝑜𝑜𝑜𝑜𝑜 ��𝑑 𝑓𝑓𝑓𝑓𝑓𝑓 �𝑑𝑑𝑑𝑑𝑑𝑑𝑑𝑑𝑑 𝑓𝑓𝑓𝑓𝑓𝑓 𝑚𝑚𝑚𝑚𝑚𝑚𝑚𝑚) 0.773/1.342 0.574To interpret the OR we need to know which is in the numerator.1.74 is OR for male to female, 0.574 is odds ratio for female to male16
95% confidence interval for the odds ratio OR 1.7 95% confidence interval is (1.3, 2.4)We say we are “95% confident” that the true odds ratios is between 1.3 and 2.4.Why is this statement justified?What does it actually mean?17
95% confidence interval for the odds ratio 95% confidence interval is (1.3, 2.4) H0: OR 1 (null hypothesis)Two ways to test if null hypothesis is true at significance level (“alpha”) 0.051.p-value 0.05 (0.0009 0.05 significance)2.1 not in the confidence interval (1 is not in interval (1.3,2.4) significance)18
Questions?19
RR and OR are close when the risk is smallRelative risk (RR) Odds ratios (OR) ���𝑑𝑑𝑑 𝑓𝑓𝑓𝑓𝑓𝑓 ��𝑑𝑑𝑑𝑑𝑑 𝑓𝑓𝑓𝑓𝑓𝑓 ��𝑑𝑑𝑑𝑑𝑑𝑑𝑑𝑑𝑑 𝑓𝑓𝑓𝑓𝑓𝑓 ��𝑒)/𝑃𝑃(𝑛𝑛𝑛𝑛 ��𝑑 𝑓𝑓𝑓𝑓𝑓𝑓 ��𝑑𝑑𝑑𝑑𝑑 𝑓𝑓𝑓𝑓𝑓𝑓 ��𝑢𝑢𝑢𝑢𝑢)/𝑃𝑃(𝑛𝑛𝑛𝑛 ��𝑑 𝑓𝑓𝑓𝑓𝑓𝑓 ��𝑢𝑢𝑢𝑢𝑢)If the disease is rare for both exposed and unexposed thenP(no disease for exposed) 1P(no disease for unexposed) 1 RR OR20
Looking only at age 38 (to get data with small risks)SexNo Diseasediseasemale16 (84.21%)3 (15.79 %)female10 (83.33%)2 (16.67%)Relative risk (RR) 1.056Odds ratio (OR) 1.067Small risk in both sexesRR and OR very close because the risk for both males and females is small.21
Looking only at age 40SexNo Diseasediseasemale22 (88.00%)3 (12.00%)female14 (77.78%)4 (22.22%)Relative risk (RR) 1.85Odds ratio (OR) 2.095Small risk for females, but risk isnot small for menRR and OR are NOT very close because the risk is NOT small for both male and female22
Now that we understand how to interpret odds ratios for 2 groups we need to extend to1.Categorical predictors with 2 groups2.Continuous predictors23
odds ratios for more than 2 categoriesweightNo Diseasediseaseunderweight7 (63.64)4 (36.36)normal69 (51.49)65 (48.51)overweight97 (41.99)134 (58.01)obese125 (51.23)119 (48.77)Categorical predictor (4 levels) binary outcome (disease / no disease)chi-square test is appropriatep-value 0.11Since this p-value is not significant (0.11 0.05) we would normally not calculate any effect measures (such as riskdifference, relative risk or odds ratios). Will do it here to learn about odds ratios.24
odds ratios for more than 2 categoriesweightNo Diseasediseaseunderweight7 (63.64)4 (36.36)normal69 (51.49)65 (48.51)overweight97 (41.99)134 (58.01)obese125 (51.23)119 (48.77)6 different OR can be calculated (corresponding to 6 different pairwise comparisons).Generally a good idea to limit how many OR we calculate by making choices for which comparisons we want to focus on.A “reference group” is a group that we choose to be the reference so that all odds ratios will be a comparison to thereference group.Suppose choose normal as the reference group. Then we would compare underweight, overweight, and obese to normal25
odds ratios for more than 2 categoriesweightOdds ratio (OR)Interpretationunderweight0.607Less risk than normal weightoverweight1.466More risk than normal weightobese1.011Approximately equal risk to normal weightnormal1.000Sometimes, but not always papers will include this to indicate normal is the reference group: which means the OR fornormal is odds(normal)/odds(normal) which of course is 126
Questions?27
Relationship between age and CADAge (in years) is linear so now we need to use logistic regression.From the logistic regression model we getOdds ratio 1.073, p-value 0.0001, 95% confidence interval (1.054,1.093)interpretationOlder age is a significant risk for CADFor every one year increase in age the odds is 1.073 times larger28
Logistic regression with all 3 predictorsLogistic regression allows us to look at all three predictors (sex, weight, and age)simultaneously.Looking at relationships between each predictor and CAD separately is a good firststep before proceeding to the full logistic regression model. It is important tounderstand these relationships first before looking at the full model.29
Logistic regression results with all 3 predictorsOdds ratioP-value95% confidence intervalsex (male vs female)1.8290.0007(1.29,2.59)Age (in years)1.074 0.0001(1.015,1.095)weight (obese vs normal)1.2250.4968(0.780,1.952)weight (overweight vs normal)1.5130.0903(0.959,2.386)weight (underweight vs normal)0.6950.4008(0.177,2.724)Can look at either the p-values or check if 1 is in the confidence interval to determine significanceconclusionsMale associated with increase risk of CADRisk of CAD increases with age with the odds increasing by 1.074 times for each one unit increase in ageWeight (with this categorization) not significantly associated risk of CADSame conclusions as we had with individual comparisons30
A peak under the hood of the logistic regression modelOne predictor: age call X and one outcome call this YLogistic regression model log𝑃𝑃 𝑌𝑌 1 𝑋𝑋𝑃𝑃 𝑌𝑌 0 𝑋𝑋Compare to linear regression model b0 b1 X𝑌𝑌 𝑏𝑏0 𝑏𝑏1 𝑋𝑋 𝑒𝑒Term inside the square brackets is the odds conditional on the value of XEntire term on left side of equals sign is a log odds𝑏𝑏1 is a log odds ratio odds ratio is OR exp(𝑏𝑏1 )Note: here log is the natural log (with base e) which is some fields is written as ln(x)31
(default) output from logistic regression in SASAbsence offemale tells youthat is thereference groupAbsence of normal tells youthat is the reference grouplog odds ratiosp-values32
Converting from log odds ratios to odds ratiosOdds ratio exp(log odds ratio)Example: to get the odds ratio for sexLog odds ratio 0.6037Odds ratio exp(0.6037) 1.82933
SAS output with both log odds ratios and odds ratioslog odds ratiosodds ratiosp-values (same for log odds ratiosand odds ratios)34
Interpretation of odds ratio for age (from logistic)Odds ratio 1.074Log odds ratio log(1.074) 0.072For every 1 year increase in age the log odd increases by 0.072 For every 10 year increase in age the log odds increases by 0.072 x 10 0.72Exponentiate to get back on the odds scaleexp(0.72) 2.05 For every 10 year increase in age the odds doubles (i.e. twice the size)35
How to tell if values are log odds ratios or odds ratios Some statistical software is nice enough to actually label outcome as being eitherodds ratios or log odds ratios, but otherwise If any of the estimates are negative then values are log odds ratios (minimum valuefor an odds ratio is 0) If the confidence intervals are symmetric around the estimate (i.e. distance betweenthe estimate and the bounds are the same for lower and upper limit) then values arelog odds ratios (confidence intervals for odds ratios are not symmetric around theestimate)36
Questions?37
Compare linear and logistic regressionlinear regressionY is a linear function of X𝑌𝑌 𝑏𝑏0 𝑏𝑏1 𝑋𝑋 𝑒𝑒We estimate the values of 𝑏𝑏0 and 𝑏𝑏1can then use the estimates and the model to make prediction about the value of Y for agiven value of X.38
logistic: model dependence of Y on X through the log oddslogistic regressionlog𝑃𝑃 𝑌𝑌 1 𝑋𝑋𝑃𝑃 𝑌𝑌 0 𝑋𝑋 b0 b1 XLog oddsTwo reasons why it is good to know this.1.2.the log part is why b1 is a log odds ratio not an odds ratiomodel can be inverted (which means solved for P(Y 1 X)) and then used toestimate P(Y 1 X) for any X39
Would usually use statistical software to calculate the inverse, so not necessary toknow the function, but here it is𝑃𝑃 𝑌𝑌 1 𝑋𝑋log𝑃𝑃 𝑌𝑌 0 𝑋𝑋Invert: solve for P(Y 1 X)𝑃𝑃 𝑌𝑌 1 𝑋𝑋 log1 𝑃𝑃 𝑌𝑌 1 𝑋𝑋𝑃𝑃 𝑌𝑌 1 𝑋𝑋 exp 𝑏𝑏0 𝑏𝑏1 𝑋𝑋1 exp 𝑏𝑏0 𝑏𝑏1 𝑋𝑋 b0 b1 X(inverse function)Can now plug in any value of X to get P(Y 1 X)40
The inverse function is more complicated when we have multiple predictors (as in ourexample).But we can still use the logistic regression model to estimate the probability of diseasefor any combination of sex, weight, and age.Example: If I wanted to compare probabilities of disease for overweight 30 year oldmen to women, using the logistic regression model.Probability of disease for 30 year old overweight men is 0.21Probability of disease for 30 year old overweight women is 0.13(I used SAS to get these estimates from the model.)41
Conditions needed for logistic regression Outcome is binary (can be extended to multinomial, but model is more complicatedand a bit more difficult to interpret) Sample size needs to be large (larger than required for linear regression)necessary sample size is a function of1. number of predictors (more predictors requires larger sample size)2. probability values (close to 0 or 1 requires larger sample size)Note: for linear regression sample size only needs to be large if the outcome is notnormally distributed.For logistic regression the outcome is binary, so not possible to be normally distributed.42
what you need to know to interpret results from logistic regressionDirection of the outcome (is the model for the probability of disease or for theprobability of no disease).When focus is on studying factors that increase the probability of disease we usuallymodel the probability of disease (as we did in our example).When focus is on studying factors that decrease the probability of disease then wouldusually model the probability of no disease.However for statistical software there is usually a default choice which may or may notbe the one you want.(you get the same conclusions, but need to know to interpret results) For each categorical variable what is the reference group? (there are other ways tospecify a model that do not use the reference group coding) Are the results odds ratios or log odds ratios? What are the scales for each continuous variable? For example, is age in years orsome other unit 43
Thank youQuestions?44
Therefore we use chi -square test. Chi-square p-value 0.0009 males have significantly larger risk of CAD. We do not need logistic regression for this because the predictor is not continuous (not a number) 10 example: looking first at sex as a predictor of CAD Sex. No Disease (CAD) Disease (CAD) male: 162 (43%) 217 (57%)


![Advanced Analytics in Business [D0S07a] Big Data Platforms .](/img/28/3-20-20supervised-20learning.jpg)
