Transcription
The Logistic Maturity Model: guidelines forlogistic processes continuous improvementC. Battista, A. Fumi, M. M. SchiraldiDepartment of Enterprise Engineering, “Tor Vergata” University of Rome,Via del Politecnico, 00133, Roma, Italy(claudia.battista@uniroma2.it, ract: This paper presents a Logistic Maturity Model. The goal is to providecompanies with a system that allows both to assess their logistic processes current statusand to outline an action plan for improvement, considering four key elements: ModelingFramework, Maturity Framework, Performance Framework and Improvement Systems.Keywords: Maturity Model; Performance; Best Practice; Improvement System.
IntroductionA business process oriented organization (BPO) gives a great dynamism to enterprises, andconsequently a better answer to any possible external change, and confers a better control on thebusiness performance (Hammer, 1999) (CMMI Product Team, 2010).In literature, many authors point out a clear relationship between the adoption of an organizationalstructure focused on the processes and the progressive increase of the business performance interms, for instance, of increase of profit, increase of the customer service, decrease of delays, errorsand incomprehension (McCormack, 2004) (Netland, Alfnes, & Fauske, 2007). The same studiesshow as the effectiveness of a BPO organizational structure results to be tightly related to thepresence and interaction of three key elements: Process Maturity System - framework to evaluate the maturity level of the businessprocess through the definition of true criterions of analysis and classification; Process Measurement System - framework for the performance monitoring of theprocesses through the definition of a suitable system of indicators; Process Improvement System - framework to define a list of optimization measures ofthe business processes, in order to reach a continuous improvement.There is a plenty of examples that show how researchers and industrial managers focused, in thelast ten years, on the development of a framework able to define the firm maturity level in order tohelp the management to identify the main solution to tune business processes.The idea of Model of Maturity finds its bases in software engineering: in 1993 the SoftwareEngineering Institute (Six) of Carnegie Mellon University, Pittsburgh (USA), planned the firstCapability Maturity Model (CMM), developing a standard process in order to assess the level of
quality of IT organizations, through the analysis of performance levels of software developmentprocess.This model was developed in order to give, as output, something called “improvement road map”:steps of evolution that the firm should follow to upgrade from a level of immaturity in the softwareprocesses, to a better management of them, with the consequent increase of quality service, savingtime and costs.The success of this model brought to the proliferation of many new CMMs for different businessareas. A huge fragmentation that pushed SEI to start a project of synthesis of the existing models byrealizing in 2002 an extensible unique framework - the Capability Maturity Model Integration(CMMI) - that is, by now, the main benchmark in the research of the Models of Maturity (Turner,2002).According to statistics published by SEI in 2009, the application of such methodology of analysisand optimization of the processes recorded an exponential growth in the last years withinterventions from all over the world and extremely positive results: by the introduction of a CMMIproject, SEI declared that the test-firms recorded a 34% average reduction of costs, an averageincrease in productivity around 61% and a 400% increase of the ROI.As to these results, many authors put their own attention on the development of new models ofmaturity focused on specific sectors: from the Information Technology (Gibson & Nolan, 1974)(Crosby, 1979) (Radice, Harding, Munnis, & Phillips, 1985) (Software Engineering Institute, 1995)(CMMI Product Development Team, 2000) (CMMI Product Team, 2007) (CMMI Product Team,2010) (CMMI Product Team, 2002), to the project management (PMI, 2003) (Kerzner, 1998)(Bourne, 2007), to the health (Wetering, 2009) (Staggers, et al., 2011), to the knowledgemanagement (Klimko, 2001) (Ehms & Langen, 2002) (Kochikar, 2000), to the supply chainmanagement (Johnson & McCormack, 2003) (McCormack & Lockamy III, 2004) (Srai & Gregory,
2005) (Hunsche, 2006) (Netland, Alfnes, & Fauske, 2007) (Bolstorff & Rosenbaum, 2007)(Kauremaa & Suzuki, 2007) (Lambert, 2008) (Supply Chain Council, 2010) (Garcia & Giachetti,2010). Nevertheless, in some studies that praise and apply the Models of Maturity as tools ofanalysis and optimization of the business processes, there are some important limits that don't allowtheir diffused affirmation in the industrial level, especially in the logistics (Valadares, Ladeira, &McCormack, 2005): lack of a framework able to incorporate an identification methodology of thequalitative and quantitative relationships among the business performance indicators(KPI), the strategic objectives and the improvement actions to be undertaken in theproper area of process (Valadares, Ladeira, & McCormack, 2005); no easy use of the existing frameworks in industrial process, because of the lowflexibility of the modeling architecture of the business logistic processes (Garcia &Giachetti, 2010); hard understanding by the consumers of the criterions of process modeling and ofevaluation of the level of maturity (Visconti & Cook, 1998); lack of a holistic framework able to incorporate a global vision of the business logisticprocesses, caring about direct and indirect points of contact (Netland & Alfnes, 2008).This article is about a Model of Maturity for Logistic Processes - defined LMM - with the aim tosupport the enterprises to understand the more critical areas of process in terms of "immaturity",improvement and the right actions to be undertaken for increasing the performances. The model isin phase of validation. A famous Italian firm of female fashion is adopting the LMM as a guide linefor the management and optimization of its logistic supply chain.
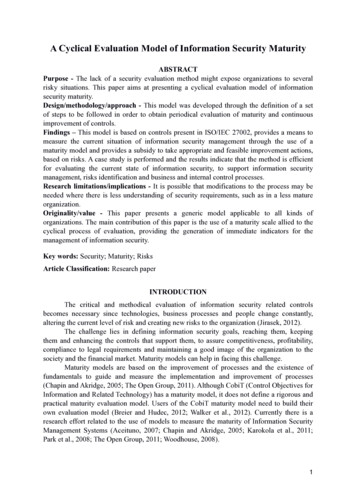
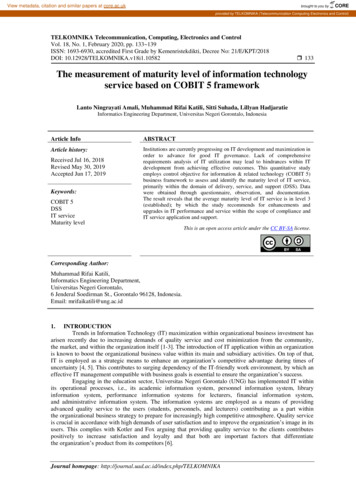
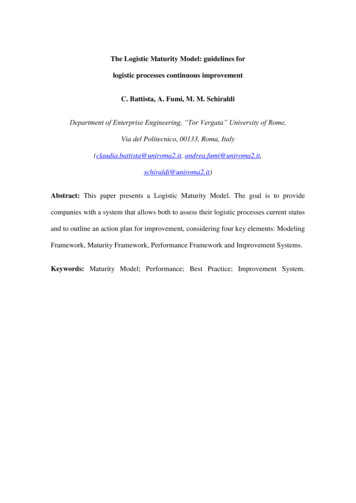
The Logistic Maturity Model structureLMM focuses on the business logistic processes, the processes useful to plan, manage and check theflow of raw materials, of finished goods and their informative flows from the place of origin to thatof consumption. LMM works as a specific maturity model: likewise to the Capability MaturityModel, developed in development software range, LMM focuses, for instance, on the specificdominion of logistics.In this way we have to exclude the processes of human resources management, project managementor knowledge management. Processes that, crossing the different business sectors, are examinedinside the general maturity model.Therefore, LMM aims to appraise the maturity of inside and external logistics of an organization:the possible processes of production developed by the firm are not considered as much as theprocesses related to the sales management and clients assistance have been excluded. Finally it wasdecided not to consider, in this first version of LMM, the reverse logistics aspects: at the end of thephase of deploy, it is foreseen a further extension of the model finalized to the inclusion of sucharea.Related to the main problems due to the analysis of the state of the current maturity models inlogistic area, the following architecture is proposed for the LMM (Figure 1):I. Modeling Framework - logistic processes reference model;II. Maturity Framework - business maturity measurement system;III. Performance Framework – performance measurement system;IV. Improvement System - Best Practice system finalized to the processes continuousimprovement.
IMPROVEMENTSYSTEMPERFORMANCEFRAMEWORKMATURITY TOIMPACT GRIDMATURITY FRAMEWORKBEST PRACTICES GRID TOMATURITY GRIDKPITEMPICOSTIMATLEV SMATLEV 4MATLEV 3MATLEV 2MATLEV 1MODELING FRAMEWORKSUBPROCESSESPROCESSESAREASFigure 1: LMM ArchitectureLMM is based on a modeling framework planned on more steps of processes aggregation. At thefirst level there are four Logistic Areas, each of them is split in more processes/subprocesses by amultilevel tree structure. On the first level we decided to apply a remake of the classificationproposed by SCOR identifying four Logistic Area (Table 1). Every Logistic Area has been dividedin processes of second and third level (Table 2).SCORLMMDescriptionPlanPlanProcesses about demand nReturnN.A.Processes about procurement planning, identification andselection of the suppliers and operative management ofprocurement ordersProcesses about stock management, in/out warehouseflow control, storage areas management and goodstransportation managementProcesses about shipment planning and transportmanagementN.A.Table 1: SCOR – LMM Comparison
LALA0LA1LA2LA3Liv ProcessesID CodeRelational code2Demand PlanningPDP0.12Suppliers managementGFP1.12Procurement orders mgmt.GOP1.22Procurement planningPAP1.33Procurement batch settingLAP1.3.1/P2.1.23Procurement batch timingTAP1.3.2/P2.1.32Inventory ManagementIMP2.12Inventory ControlICP2.22WarehousingWHP2.32Material HandlingMHP2.43Shipment batch setting and timingTLSP2.1.1/P3.1.13Procurement batch settingLAP2.1.2/P1.3.13Procurement batch timingTAP2.1.3/P1.3.22Shipment planningPSP3.12Transport mgmt.GTP3.23Shipment batch setting and timingTLSP3.1.1/P2.1.1Table 2: LMM Modeling Framework ProcessesEvery process/subprocess must go with four informative elements: objective - informative element related to the description of the area of reference; activity - informative element useful to the description of the principal activitiescharacterizing the process. Such information results to be very important in the firststeps of implementation of LMM inside an organization because it helps to draw a mapbetween the true business processes and LMM's ones; correlated processes - informative element useful to weigh up of the degree ofcorrelation between the processes of the model. In particular, the link between thedifferent processes is based on the number of shared Achievements (AC): the
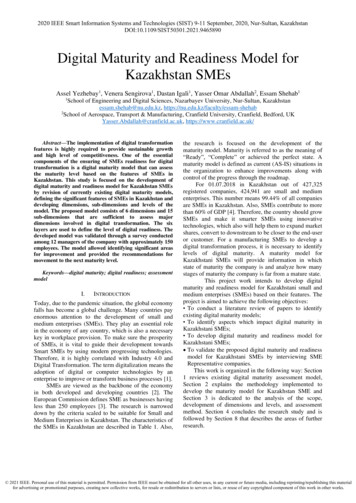
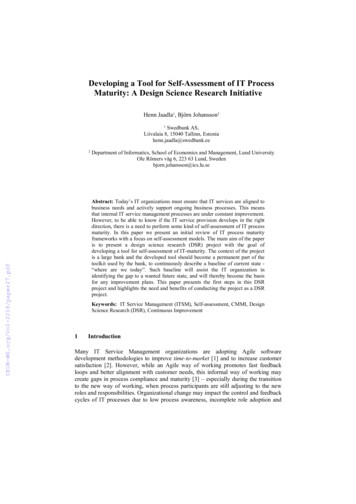
correlation is as stronger as high is the number of shared aims. Such information cansupport the management in the choice, other external conditions being equal, of theprocess area where prioritily the attention should focuses: to improve the degree ofmaturity of a strongly connected process with the other ones, asks a better increase ofthe maturity of the whole logistic system; control dashboard – informative element useful to find the principals ControlIndicators of the performance. The information can support the management inmonitoring and evaluating the reached performances.To every process is associated a maturity method assessment based on a 5-level staircase ofmaturity: from an initial and no-structured state - level 1 - to a standardized and optimized one level 5 (Figures 2). The degree of maturity of the process is connected to the number of reachedAchievements, that is the number of satisfied objectives for every level of maturity.Therefore a first step of analysis is given by checking the level of maturity through the controlof the Achievements that should be reached in a certain process and of those reasonablyattainable in the future. The implementation of LMM in a firm will allow the management,therefore, to know the profile of maturity of every single sub-process, process, logistic area orwhole logistic system. The model proposes a maturity profile for every planned degree ofaggregation in the Framework of Modeling.Liv 5 – OptimizedMaturity levelsLiv 4 – MeasuredOptimization actionsimplementedPerformance SystemimplementedLiv 3 – DefinedConsolidation phaseLiv 2 – ManagedDevelopment phaseLiv 1 – Start-upStart-up
Figure 2: LMM Maturity FrameworkEvery Achievement, besides, is related both with specific Best Practices (Improvement System),that list the methods to achieve a particular objective, and with different Indicators ofPerformance categories, according to the reference maturity level. For this reason we proposethree classes of indicators: Performance Indicator (IP) – Indicators connected to Achievements related to thesecond maturity level. The IPs show the standards that can be used to monitor theperformance after reaching the goal; Achievement Indicator (AI) – Indicators connected to Achievements related to the thirdand fourth maturity levels. The AIs show the standards that can be used to monitor thelevel of attainment of the goal; Key Performance Indicator (KPI) – Indicators connected to Achievements related tothe fifth maturity level. The KPIs show the key standards that can be used to monitorthe performance after reaching the goal.Best Practices and Indicators are therefore referable to a process, but not necessarily to only one.That is why we created a net of indicators that contributes to explain how to reach the desiredperformances. The integration inside the LMM of a framework of evaluation of the performanceintroduces three main goals: support the management to find out the main indicators of performance in everyprocess; support the management to pick out, for every strategic/ tactical / operational objective,the right KPIs in order to measure the increase of performance in gaining the plannedgoal;
support the management to single out the concerning KPIs of each Best Practice, thatallow to measure the increase of performance from the implementation of a specificaction of intervention.The attainment of the three goals above listed, implicated a four level integration: definition and settlement of the relationships between processes/subprocesses and KPIto support the firm in a preliminary detection of the areas where, assuming an indicatorto be improved, it is necessary to focus on; definition and settlement of the relationships between Achievements and KPI realizingsome charts (Impact Grid) in order to define the positive or negative impact when anAchievement is reached according to the different identified KPIs; definition and settlement of the relationships between Best Practice and KPI throughcharts (BP List and BP Maturity Grid) with aim to associate to every KPI the relativeaction of intervention, in order to increase the performances; definition and settlement of the links among KPI with the aim to build a net andformalize the dependence between the different indicators.We have identified six kinds of connection, four relational and two causal: very strong direct/inverse bond (relational) – by two indicators KPIi and KPIm, there'sa mathematical formula like KPIi f(x) leading to KPIm f(x). Increase/decrease ofKPIm determines, being equal the other terms of f(x), an increase/decrease of KPIi. Wecan see, for example, two KPIis: Percentage of storage costs on turnover (KPI 2) andValue of fixed assets in stock (KPI 51). We can put KPI 2 as a function of KPI 51, andvice versa. Besides, if we increase KPI2/KPI51 we also see KPI51/KPI2 increasing. Insuch a way, the two KPIs show a very strong direct bond.
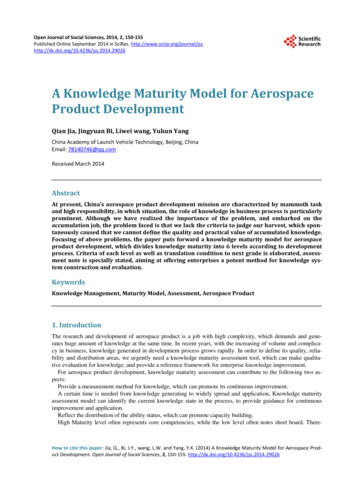
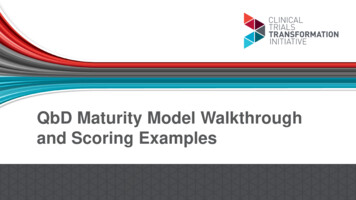
strong direct/inverse bond (relational) – by two indicators KPIi and KPIm, such asKPIi f(x) and KPIm g(y) there is a variable Ω such as Ω f(x) and Ω g(y),whose variation, being equal the other terms belonging to f(x) e g(y), determines anincrease/decrease both of KPIi and KPIm. We can consider, for example, two KPIs:average balance of products (KPI 39) and Value of fixed assets in stock (KPI 51).When we increase the number of units stored in the warehouse, we can observe anincrease both of the average balance of products and the value of fixed assets in stock.In such a way, the two KPIs show a strong direct bond. weak direct/inverse bond (causal) – by two indicators KPIi and KPIm, such as KPIi f(x) and KPIm g(y) there is no mathematical formula or variable linking the twoindicators. An increase/decrease of KPIi could determine an increase/decrease of KPImonly under specific conditions. We can see, for example, two KPIs: Percentage of nonconforming procurement orders (KPI 7) and Percentage of reworked procurementorders (KPI 6). An increase of the number of non-conformed orders could determine anincrease of reworked orders, if the firm decides to ask the supplier a further order. Insuch a way, KPI 7 is bond to KPI 6 by cause-effect: the two KPIs show a weak directbond.From the analysis of the relationships it was fixed, for every indicator, the corresponding degree ofincidence, or the degree of connection with the other indicators fixed in the model. In order togather in this index the three typologies of links above described (very strong, strong and weak) itwas attributed to every kind of relationship a different weight: weak, strong, very strong.So, the degree of incidence of a KPIi, for instance, was calculated as a weighted average of thenumber of indicators linked to it. This allows to support the firm in choosing the priority tasks to
start: an improvement of an indicator of another degree of incidence involves a more rapid andconsistent improvement of the whole logistic system(Appendix A).So the LMM structure allows the firm: appraising its own degree of maturity on a specific process/subprocess – by comparingitself with the reached Achievements, it is possible to value the reached degree ofcompetence, the chance of improvement and above all if the improvement reallycontributes to pursue the business strategic goals; coming down in the net of indicators - considering a KPI that the firm wants toimprove, it can be determined on what further indicators it is possible to act and,finding them again in Processes/subprocesses, select areas that need a focus or whichare the Best Practices to implement; appraising the chance to adopt/determine Practices – starting from a specificmethodology suggested by external suppliers, it can be easily understood on whichareas and which indicators will impact (also understanding the collateral effect on otherindicators in other areas) and if it is useful to pursue the improvement of the KPIs ofour interest.ConclusionThis article proposes a Model of Maturity for Logistics Processes. It aims to support the firms in themanagement and optimization of the processes in order to continuous improvement of theperformances. One of the greatest problems for the management is, indeed, to find the main causesof a possible low level of performance: a decrement of clients service level could be connected toan inefficient management of supply from the retailers, as to a not suitable system of distribution of
the products inside the supply chain, or could be also due to delays in the phase of the procurementof raw materials. This Logistic Maturity Model allows to: value the degree of maturity on one or more process Areas; identify the most proper actions to increase specific indicators of performance; value the opportunity to implement determined BP in order to increase the level ofmaturity reaching an AC of higher level; understand the direct or inverse correlations between different indicators of differentAreas of process, for a complete vision of the impacts of any action of improvement.LMM was planned with the aim to overcome the limits of the Models of Maturity proposed inliterature within the Supply Chain Management. Through a critical analysis of the main MaturityModels developed since 1999 up today in fields similar to logistics one, we identified and refinedthe hinge elements that prevented from a suitable diffusion in business circle. LMM integrates fourdifferent systems: a reference model of the logistic processes (Modeling Framework); a business maturity measure system (Maturity Framework); a performance measure system (Performance Framework); a Best Practice system for a continuous improvement of the processes (ImprovementSystem).The whole business area related to logistics was planned on four Logistic Areas, each of one wasactually divided in processes and subprocesses to reach the proper level of detail. Inside everyprocess we defined specific Achievements, such as goals to reach, determining the level of maturityof the firm in the analyzed area.
So, a first step of analysis is given by the evaluation of the level of maturity through the control ofthe Achievements to reach in a specific area, and of those achievements that could be reached(Achievements target). In the specific case, LMM is based on a 5 level staircase of maturity: froman initial not structured level (level 1) to the optimized one (level 5), according to the mostaccredited standard among the Maturity Models. Every Achievement is, besides, connected bothwith determined Practices and with specific indicators of performance: Practices and Indicators aretherefore related to a Process Area but not necessarily to one only. In this way the result is a net ofindicators that contributes to explain how to reach the desired performances, and this represents anelement of absolute innovation. According to the previously defined architecture we pointed outfour Logistic Area: Procurements Planning Storage DistributionEach area was divided, according to a tree structure, in three or four processes/subprocesses. Forevery area / process / subprocess and for every level of maturity we have identified around 5Achievements, with 2-3 indicative of performance and 1-2 connected Practices. The proposedLMM introduces a total of 249 Achivements, 46 Performance Indicator, 27 AchievementsIndicator, 53 Key Performance Indicator and 252 Best Practice. Every KPI can be connected tomore Achievements of different Process Areas so creating a deeper net of relationships. It wasstudied defining and formalizing three kinds of links among the KPIs (very strong, strong andweak) allowing the firms to understand the impacts in terms of performance of a specific action.The future of the search activity on this subject could aim to three goals :
the extension of the Modeling Framework including the reverse logistic; the development of a benchmark system of business performances, comparing themwith the ones of the corresponding sector of activity; the development of a measure system of the business maturity with achievementsweighted by the sector of activity.Such extensions will allow to support the firms in a continuous and constant evaluation of their ownposition in comparison with the main competitors, allowing to quickly and effectively adjuststrategies according to the course of markets in continuous transformation.
Appendix AIndicatorPerformanceKeyKeyPerformance IndicatorPercentualedi incidenzadei KPIKPI IncidencePercentageKPI 53KPI 52KPI 51KPI 50KPI 49KPI 48KPI 47KPI 46KPI 45KPI 44KPI 43KPI 42KPI 41KPI 40KPI 39KPI 38KPI 37KPI 36KPI 35KPI 34KPI 33KPI 32KPI 31KPI 30KPI 29KPI 28KPI 27KPI 26KPI 25KPI 24KPI 23KPI 22KPI 21KPI 20KPI 19KPI 18KPI 17KPI 16KPI 15KPI 14KPI 13KPI 12KPI 11KPI 10KPI 9KPI 8KPI 7KPI 6KPI 5KPI 4KPI 3KPI 2KPI 10%5%10%15%20%25%30%Percentualedi incidenzadel nodoIncidencePercentage35%40%45%50%
ReferencesBolstorff, P., & Rosenbaum, G. (2007). Supply Chain Excellence. Amacom.Bourne, L. a. (2007). Comparing Maturity Models: CMMI . OPM3 and P3M3 . PMOZConference .CMMI Product Development Team. (2000). CMMI for Systems Engineering/SoftwareEngineering/Integrated Product and Porcess Development, Version 1.02, Staged Representation.Carnegie Mellon University. Pittsburgh: Addison-Wesley.CMMI Product Team. (2002). The People Capability Maturity Model: guidelines for improving theworkforce. Pittsburg: Addison Wesley.CMMI Product Team. (2007). CMMI for Acquisition, Version 1.2. Pittsburgh: Addison-Wesley.CMMI Product Team. (2010). CMMI for Services, version 1.3. Pittsburgh PA: Addison-Wesley.Crosby, P. (1979). Quality is Free: the Art of Making Quality Certain. New York: McGraw-Hill.Ehms, K., & Langen, M. (2002). Holistic development of KM with KMMM. Siemens AG CorporateTechnology Knowledge Management and Business Trasformation.Garcia, H., & Giachetti, R. (2010). Using Experts to Develop a Supply Chain Maturity Model inMexico. Supply Chain Management: An International Journal.Gibson, C. K., & Nolan, R. L. (1974). Managing the four stages of EDP growth. Harvard BusinessReview, 76-88.Hammer, M. (1999). How process enterprises really work. 77(6).Hunsche, C. (2006). Introducing the Design Chain . Supply-ChainCouncil.Johnson, W. C., & McCormack, K. P. (2003). Supply Chain Networks and Business ProcessOrientation: Advanced Strategies and Best Practices. New York: CRC Press.Kauremaa, J., & Suzuki, S. (2007). Evaluating SCM Practices with the SCM Scorecard: Evidencefrom an International Study. POMS 18th Annual Conference. Dallas, Texas, U.S.A.Kerzner, H. (1998). Project Management: A systems approach to planning, scheduling andcontrolling. New Jersey.Klimko, G. (2001). Knowledge Management and Maturity Models: Building commonunderstanding. Proceeding of the 2nd European Conference on Knowledge Management, (p. 269278).Kochikar, T. (2000). The Knowledge Management Maturity Model - A staged framework forleveraging knowledge. The KM World 2000 Conference.
Lambert, D. M. (2008). Supply Chain Management: Processes, Partnerships, Performance (Terzaedizione). Sarasota, Florida: Supply Chain Management Istitute.McCormack, K. (2004). The Development of a Supply Chain Management Process Maturity ModelUsing the Concepts of Business Process Orientation. Supply Chain Management, 1-12.McCormack, K., & Lockamy III, A. (2004). The Development of a Supply Chain ManagementProcess Maturity Model Using the Concepts of Business Process Orientation . Supply ChainManagement journal.Netland, T., & Alfnes, E. (2008). A practical tool for supply chain improvement – experiences withthe supply chain maturity assessement test (SCMAT).Netland, T., Alfnes, E., & Fauske, H. (2007). How mature is your supply chain? A supply chainmaturity assessment test. EurOMA, (p. 17-20). Ankara.PMI, P. M. (2003). Organizational Project Management Maturity Model (OPM3) knowledgefondation. Milano.Radice, R., Harding, J., Munnis, P., & Phillips, R. (1985). A programming process study. IBMSystems Journal 24, 79-90.Software Engineering Institute. (1995). The Capability Maturity Model: Guidelines for Improvingthe Software Process. Pittsburgh: Addison-Wesley.Srai, J., & Gregory, M. (2005). Supply Chain Capability Assessment of Global operations usingMaturity Models. Proceedings of EurOMA, (p. 19-22). Budapest.Staggers, N., Rodney, M., Alafaireet, P., Backman, C., Bochinski, J., Schumacer, B., & Xiao, Y.(2011). Promoting Usability in Health Organizations: initial steps and progress toward ahealthcare usability maturity model. Healthcare Information and Management System Society.Supply Chain Council. (2010). Supply Chain Operations Reference Model. USA.Turner, R. a. (2002). Agile meets CMMT: Culture clash or common cause? Computer Science, 153165.Valadares, O., Ladeira, B., & McCormack, P. (2005). The Supply Chain Process ManagementMaturity Model - SCPM3. Supply Chain Management.Visconti, M., & Cook, C. (1998). Evolution of a maturity model - critical evaluation and lessonslearned. Software Quality Journal, 223-237.Wetering, R. a. (2009). A PACS maturity model: a systematic meta-analytic review on maturationand evolvability of PACS in the hospital enterprise. International Journal of Medical Informatics,127-140.
The Logistic Maturity Model structure LMM focuses on the business logistic processes, the processes useful to plan, manage and check the flow of raw materials, of finished goods and their informative flows from the place of origin to that of consumption. LMM works as a specific maturity model: likewise to the Capability Maturity