Transcription
Migrant integrationstatistics2018 editionCO M PAC TGUIDES
Migrant integrationMember States of the EU have traditionally been a destination formigrants, whether from elsewhere within the EU or from elsewhere inthe world. The flow of migrants has led to a range of skills and talentsintroduced into local economies, while also generally increasing culturaldiversity.The integration of migrants has increasingly become a key area forpolicy focus, with measures to help immigrants and their descendantsto overcome various integration barriers so they may be more activeparticipants in society.The Zaragoza declaration adopted in 2010 by the European MinisterialConference on Integration identified a number of policy areas relevantto migrant integration and agreed on a set of common indicators formonitoring the situation of migrants and the outcome of integrationpolicies.Four areas of integration have been currently identified as priorityareas, building on national experiences and key for the common basicprinciples. Employment is a vital part of the integration process, andefforts in education are essential in helping immigrants to becomesuccessful and more active participants in society. Social inclusion isimportant not only for access to the labour market, but also for entryinto society more generally. The participation of immigrants in thedemocratic process as active citizens supports their integration andenhances their sense of belonging.Apart from the Zaragoza indicators, Eurostat also publishes additionalindicators on health and housing, as well as regional employment andindicators related to second-generation migrants.To respond to policy and the user needs, data analyses are performed bycountry of birth and by country of citizenship, based on data availabilityand reliability. The target population can then be divided into thefollowing groups:By country of birth:By country of citizenship: Native-born Foreign-born, of which:ʂʂ EU-bornʂʂ Non-EU-born Nationals Foreign citizens, of which:ʂʂ EU citizensʂʂ Non-EU citizens
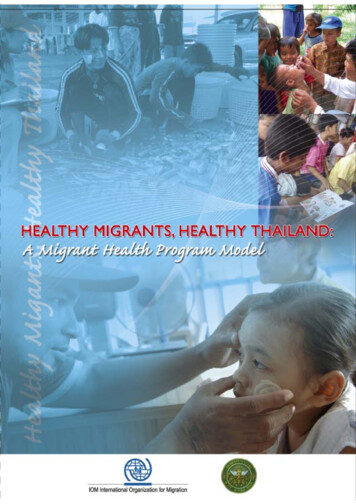
EmploymentAs a vital part of the integration process, the employment of migrants ismeasured through a series of indicators which are: unemployment rate; employment rate; activity rate; self-employment; temporary employees; part-time employment; long-term unemployment; newly employed persons.DID YOU KNOW THAT IN 2017 EU citizens living abroad in another EU country had a higheremployment rate (76.1 %) than those residing in the country of whichthey were citizens (72.1 %)? The unemployment rate for migrants born outside the EU was 6.4percentage points higher than the rate for the native-born population? In the EU, almost one in five migrants born outside the EU wasa temporary employee, compared to one in eight for native-bornemployees?Employment rates for the population aged 20-64, by sex, educationlevel and country of birth, EU-28, rn (except reporting country)Source: Eurostat (online data code: lfsa ergaedcob)Tertiary educationUpper secondary orpost- secondarynon-tertiary educationAt most lowersecondary educationTertiary educationUpper secondary orpost- secondarynon-tertiary educationAt most lowersecondary educationTertiary educationUpper secondary orpost- secondarynon-tertiary education0At most lowersecondary education10WomenNon-EU-born
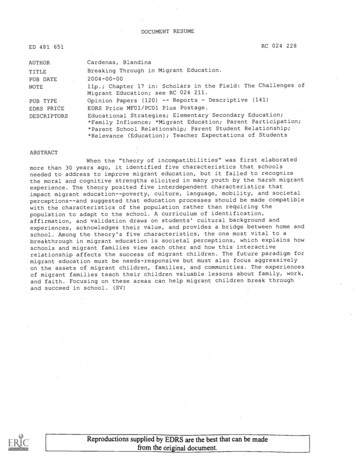
EducationEducation is essential in helping immigrants to become successful andmore active participants in society. Education, as a measure of migrantintegration, is currently evaluated using the following indicators: highest educational attainment; share of 30–34-year-olds with tertiary educational attainment; share of early leavers from education and training; adult participation in learning; people not in employment, education or training (NEETs).DID YOU KNOW THAT IN 2017 In around half of the EU Member States a higher percentage ofthe foreign-born working-age population had a tertiary level ofeducation compared to the native-born population? Compared to the native-born, the young non-EU-born persons wereat twice greater risk of leaving education and training early? In 26 EU Member States the share of young foreign-born peoplewho were not in employment, education or training was higherthan for their native-born peers?Share of the population aged 25-54 with a tertiary level ofeducational attainment, by country of birth, 2017(%)60PolandBulgariaLuxembourg50IrelandUnited CyprusLatviaBelgiumCzech RepublicPortugal EU-28 FranceMalta SlovakiaAustria roatia100GreeceItaly0102030Native-bornNote: Only available data is shown.Source: Eurostat (online data code: edat lfs 9912)405060
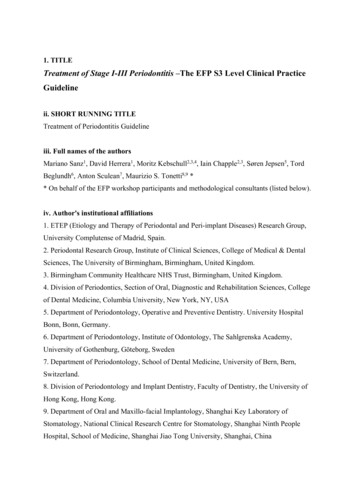
Social inclusionSocial inclusion is important not only for access to the labour market, butalso for entry into society more generally. The main indicators assessingthe social inclusion of migrants are: mean and median income; at-risk-of-poverty; in-work at-risk-of-poverty; people at-risk-of-poverty or social exclusion; at-risk-of-poverty rate for children; income distribution and monetary poverty.DID YOU KNOW THAT IN 2016 Almost 4 out of 10 foreign citizens in the EU faced the risk of beingin poverty or socially excluded? The median equivalised income of EU citizens living in another EUMember State was 9.6 % higher than that recorded for nationals;whereas the median income of non-EU citizens was 24.2 % lowerthan the one for nationals? The risk of poverty for children in the EU who had at least one parentwith foreign citizenship stood at 35.8 %, almost twice as high than itwas for children whose both parents were nationals (18.8 %)?Median equivalised income of the population aged 20-64,by country of citizenship, EU-28, 2010-2016(EUR)20 00017 50015 00012 50010 0002010201120122013EU citizens (except reporting country) (1)2014Nationals(¹) 2010 and 2013-2016: low reliability. 2011 and 2012: estimates.(²) 2010: low reliability. 2011-2016: estimates.Source: Eurostat (online data code: ilc di15)20152016Non-EU citizens (2)
Living conditions and materialdeprivationAlongside income-related measures of poverty, a broader perspective ofsocial inclusion can be obtained by studying other measures, for example,those relating to housing and material deprivation. These measures areconsidered important elements for the well-being of individuals: home ownership; overcrowding rate; housing cost overburden rate; material and social deprivation; severe material deprivation; people living in households with very low work intensity.DID YOU KNOW THAT IN 2016 In the EU, 7 out of 10 nationals owned their home, compared to only 3in 10 foreign citizens? On average, 1 in 4 foreign citizens living in the EU was considered to beoverburdened by housing costs, compared with1 in 10 for nationals? Across the EU, foreign citizens were more likely to live in anovercrowded household than nationals and the highest overcrowdingrates were usually recorded among non-EU citizens?Housing cost overburden rate among the population aged 20-64,by country of citizenship, 2016(%)9080706050403020Non-EU citizens (1)EU citizens (except reporting country) ndNetherlandsDenmarkRomaniaItalyUnited KingdomSloveniaPortugalBelgiumCzech aCroatiaMalta0EU-2810NationalsNote: Only available data is shown. Ranked on the share for all foreign citizens.(¹) Data not reliable for: EU-28, Bulgaria, Estonia, Croatia, Latvia, Lithuania, Hungary, Poland, Romaniaand Slovakia.(²) Data not reliable for: Bulgaria, Croatia, Lithuania, Hungary, Poland, Romania, Slovakia and Iceland.Source: Eurostat (online data code: ilc lvho25)
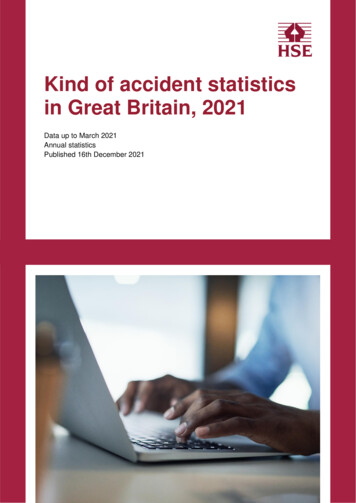
HealthHealth status and healthcare of migrants are part of the social inclusionarea identified in the Zaragoza Declaration. The collected data focuseson self-perceived health and well-being and self-reported unmet needsfor medical examination: self-perceived health; people having a long-standing illness or health problem; self-perceived long-standing limitations in usual activities due tohealth problem; self-reported unmet needs for medical examination; self-reported unmet needs for dental examination.DID YOU KNOW THAT IN 2016 In the EU, the share of foreign citizens who perceived their healthas good or very good was 4.5 percentage points higher than thatof the nationals? The share of non-EU citizens who perceived their health as verygood or good ranged from as high as 94.4 % in Cyprus to only41.3 % in Estonia? For the EU, more nationals reported some or severe long-standinglimitations compared to foreign citizens (18.3 % of nationals vs.13.1 % of foreign citizens)?Self-reported unmet needs for medical examination bymain reason declared and country of citizenship (populationaged 20-64), EU-28, 2016(%)5.04.54.03.53.02.52.01.51.00.50.0EU citizens (exceptreporting country) (1)Non-EU citizensOtherWanted to wait and see if problemgot better on its ownFear of doctor, hospital, examinationor treatmentWaiting list(¹) Data not reliable for all categories.Source: Eurostat (online data code: hlth silc 30)NationalsDidn't know any good doctoror specialistNo timeToo far to travelToo expensive
Active citizenshipThe participation of immigrants in the democratic process as activecitizens supports their integration and enhances their sense ofbelonging. The key indicators in the area of active citizenship, whichcovers civic and political participation by migrants and the acquisitionof equal rights and responsibilities by migrants, are: naturalisation rate; the share of non-EU citizens having long-term residency status; long-term residents among all non-EU citizens holding residencepermits; residents who acquired citizenship as a share of resident non-citizens.DID YOU KNOW THAT IN 2016 EU Member States granted citizenship to almost 1 million persons,around 3 % of all foreign citizens in the EU? Across the age groups, the highest naturalisation rates in the EUfor people who were formerly non-EU citizens were recorded forchildren aged 10-14 years (5.7 %)? 56.2 % of non-EU citizens living in the EU held long-term residentstatus?Naturalisation rate, by broad group of former citizenship,2016(%)15.012.510.07.55.0EU citizens (except reporting iaCyprusSwedenPortugalRomania ( )NetherlandsFinlandSpainGreeceUnited Kingdom ( )IrelandMaltaItalyBelgiumDenmark ( )France ( )Poland ( zech RepublicAustriaLithuaniaEstoniaLatvia0.0EU-28 ( )2.5Non-EU citizens(¹) Estimates.(²) Acquisitions of citizenship include some persons not living in the country, although theimpact is thought to be negligible.(³) Provisional.Source: Eurostat (online data codes: migr acq and migr pop1ctz)
Second-generation migrantsApart from general migrant population, Eurostat also collects dataspecifically on second-generation immigrants using Labour Force Survey(LFS) ad hoc modules that run every eight years. They allow for the collectionof data on the second-generation immigrants who are defined as nativeborn persons with at least one foreign-born parent. The latest ad-hocmodule ‘Migration and labour market’ was conducted in 2014. The proposedchanges to the LFS foresee to include the information on the country of birthof parents in the core LFS list of variables.DID YOU KNOW THAT IN 2014 52.4 % of ‘second-generation immigrants’ in the EU worked in a highlyskilled white-collar job, compared with 42.0 % of ‘the native born withnative background’ and 32.0 % of the ‘first-generation immigrants’? Employment rate of ‘second-generation immigrants’ in the EU (78.7 %)was similar to ‘native-born with a native background’ (78.6 %)? In the EU, ‘second-generation immigrants’ aged 25-54 with EU-bornand non-EU-born parents had higher tertiary educational attainmentrates (38.5 % and 36.2 % respectively) than their peers with a nativebackground (30.9 %)?Objective over-qualification by migration status andbackground, 25-54 age group, EU-28, 2014 and 2.419.621.650born inside EUborn outside EUFirst-generationimmigrantsof EU originsof non EU originsSecond-generationimmigrants2008Source: Eurostat, LFS 2014 ad hoc module2014of native backgroundNative-born
Regional dataAn influx of migrants has the potential to provide a range of skills and talentsinto local/regional labour markets. Recognising migrants’ educationalattainment and understanding regionally specific migrants’ labour marketsituation are core aspects of the integration process. Eurostat compiles andpublishes education and labour market statistics by migration backgroundfor EU regions and by degree of urbanisation for the following indicators: highest educational attainment; people not in employment, education or training (NEETs); activity rates; employment rates; unemployment rates; part-time employment; self-employment; temporary employees.DID YOU KNOW THAT IN 2017 The highest employment rates in the EU for non-EU citizens wererecorded in several regions of the Czech Republic and the UnitedKingdom? In the EU cities, male employment rates for citizens from other EUMember States were higher than female rates except French cities?Activity rate for non-EU citizens, by NUTS 2 regions, 2017(% share of population aged 20-64)Activity rate for non-EU citizens, by NUTS 2 regions, 2017(% share of population aged 20-64)Canarias (ES)Guadeloupe (FR)0 1000Martinique (FR)Guyane (FR)020Réunion (FR)00 100Mayotte (FR)20Malta025015Açores (PT)100 50Madeira (PT)Liechtenstein0 2005Administrative Boundaries: EuroGeographics UN-FAO TurkstatCartography: Eurostat — IMAGE, 19-06-18EU-28 68.5 5555 – 650200400600800 km65 – 7575 – 85 85Data not availableNotes:Notes:- Only available data is shown.Datanot reliablefor selected regions of: BE, BG, CZ, EL, ES, FR, HR, LT, NL, PL, RO, SK, UK, MK.- Only available- Fordatais shown.more details please consult the database.Source: Eurostat (online data code: lfst r lfp2actrtn)- Data not reliablefor selected regions of: BE, BG, CZ, EL, ES, FR , HR , LT, NL, PL, R O, SK, UK, MK.For more details please consult the database.Source: Eurostat (online data code: lfst r lfp2actrtn)
Statistics Explained, database anddedicated section presentedStatistics Explained‘Statistics Explained’ presents articles on statistical topics in anunderstandable way. The articles on migrant integration are included inthe section on Asylum and Migration and include articles on each of theareas of integration. Articles are presented in two on-line books: ‘Migrantintegration’ and ‘First and second-generation immigrants - a at/statistics-explained/index.php/Main PageDedicated sectionMIGRANT INTEGRATIONThis serves as an overview of migrant integration data, listed by topics.It also provides a list of surveys from which the data are taken, links to EUpolicy tools and access to the methodological notes for each integration/overview
Eurostat together with the members of the European Statistical Systemhave set up a system of multi-lingual user support, which can bereached via the ‘Help’ tab on Eurostat’s tPDF: KS-02-18-877-EN-NPrint: KS-02-18-877-EN-CUser supportMedia and institutional supportThe Eurostat Press Office maintains the communication with themedia and publishes news releases and items on a range of datacovering the EU, the euro area, the Member States and their partners.To obtain news releases on the day of their publication and thecalendar of forthcoming releases:Tel: ( 352) 4301 33444 eurostat-pressoffice@ec.europa.euTo request data or ask questions on Eurostat statistics:Tel: ( 352) 4301 33408 eurostat-mediasupport@ec.europa.euYou can follow Eurostat on twitter:https://twitter.com/EU EurostatContact details:Eurostat5, rue Alphonse Weicker, 2721 LuxembourgLUXEMBOURGE-mail: estat-user-support@ec.europa.euMore information: https://ec.europa.eu/eurostatPrinted by Imprimerie Centrale in LuxembourgLuxembourg, Publications Office of the European Union, 2018 European Union, 2018Reuse is authorised provided the source is acknowledged.The reuse policy of European Commission documents is regulated byDecision 2011/833/EU (OJ L 330, 14.12.2011, p. 39).Copyright for the photograph: Shutterstock/Rawpixel.comFor any use or reproduction of photos or other material that is not under the EUcopyright, permission must be sought directly from the copyright holders.For more information, please es/copyrightPDF: ISBN 978-92-79-88746-8 doi:10.2785/31470Print: ISBN 978-92-79-88747-5 doi:10.2785/49911
GUIDES Migrant integration statistics 2018 edition. Migrant integration Member States of the EU have traditionally been a destination for migrants, whether from elsewhere within the EU or from elsewhere in the world. The flow of migrants has led to a range of skills and talents introduced into local economies, while also generally increasing cultural diversity. The integration of migrants has .