Transcription
View metadata, citation and similar papers at core.ac.ukbrought to you byCOREprovided by CONICET DigitalARTICLE IN PRESSJournal of Atmospheric and Solar-Terrestrial Physics 68 (2006) 1698–1708www.elsevier.com/locate/jastpUse of CRISTA mesopause region temperatures for theintercalibration of ground-based instrumentsJ. Scheera, , E.R. Reisina, O.A. Gusevb, W.J.R. Frenchc, G. Hernandezd, R. Huppie,P. Ammosovf, G.A. Gavrilyevaf, D. OffermannbaInstituto de Astronomı a y Fı sica del Espacio, CONICET-UBA, Buenos Aires, ArgentinabPhysics Department, University of Wuppertal, Wuppertal, GermanycSpace and Atmospheric Sciences, Australian Antarctic Division, Kingston, Tasmania, AustraliadDepartment of Earth and Space Sciences, University of Washington, Seattle, WA 98195-1310, USAeElectrical and Computer Engineering, Utah State University, 6 Fairlane Terrace, Winchester, MA 01890, USAfInstitute of Cosmophysical Research and Aeronomy, Yakutsk, RussiaAvailable online 28 July 2006AbstractMost available ground-based (GB) techniques for measuring temperatures in the upper mesosphere to lowerthermosphere (or mesopause region) have systematic errors that are comparable to those of orbiting instruments.Determining these unknown biasses would normally require colocated observations that are only seldom feasible. Satellitemeasurements can be used as a ‘‘transfer standard’’ between GB observations that are not colocated. In this context, evenwith a reproducible or known bias in the satellite data, the comparison is still meaningful. Since Cryogenic InfraredSpectrometers and Telescopes for the Atmosphere (CRISTA) temperatures cover the mesopause region with very goodaccuracy (statistical errors do not exceed 1.5 K and systematic uncertainties range from about 3–7.5 K), they are quitesuitable for this purpose. Because of the nearly constant precision over the height range of interest, also rotationaltemperatures of airglow emissions from different altitudes like the OH and O2 bands (or the OI 558 nm line) can besuccessfully compared with each other. In spite of the limited number of overpasses during the relatively short CRISTAmissions, the feasibility of such an intercalibration is demonstrated for widely separated GB sites. Here, the resultsobtained for GB measurements at eight different sites, using CRISTA-1 and CRISTA-2 data, are presented. For OHtemperatures, the standard deviation between the different instruments is only 5.4 K, confirming previous estimates.r 2006 Elsevier Ltd. All rights reserved.Keywords: Mesopause region; Temperature; Airglow; Satellite1. IntroductionIn the validation of satellite data by comparisonagainst ground-based (GB) observations, the pri Corresponding author. Tel.: 54 11 47832642;fax: 54 11 4786 8114.E-mail address: jurgen@caerce.edu.ar (J. Scheer).1364-6826/ - see front matter r 2006 Elsevier Ltd. All rights reserved.doi:10.1016/j.jastp.2005.12.009mary aim is establishing the quality of the satellitemeasurements. In such a case, the data againstwhich the comparison is made should be morereliable than the instrument to be validated.However, most available GB techniques for measuring temperatures in the upper mesosphere tolower thermosphere (or mesopause region, betweenabout 80 and 100 km) have systematic errors
ARTICLE IN PRESSJ. Scheer et al. / Journal of Atmospheric and Solar-Terrestrial Physics 68 (2006) 1698–1708comparable to those of orbiting instruments, oreven greater.The opposite approach, namely to use the satelliteinstrument as a ‘‘transfer standard’’ for an intercomparison of different GB instruments may alsobe useful, because it leads to the comparability ofdifferent measuring techniques obviating the needto transport them to the same site.The idea has been pursued in the past (Torr et al.,1977), for the intercomparison of GB airglowphotometers via the AE-C satellite. The target ofthat work was photometry and revealed considerable differences in the sensitivities of the GBphotometers, pointing to problems with GB calibration procedures.For upper atmospheric temperature measurements until about 65 km altitude, the intercalibration between the LIMS instrument on the Nimbus-7satellite and meteorological rockets (Gille et al.,1984) has been one of the first applications of thistechnique. This led to an extensive intercomparisonbetween US and USSR rocketsondes of the typesthat had been launched together only in twoprevious dedicated campaigns.For mesopause region temperatures, a recentexample is the paper by von Savigny et al. (2004),where satellite and GB rotational temperaturesfrom OH airglow bands were compared, using theSCIAMACHY instrument on Envisat. Althoughmainly meant as a validation of the satelliteinstrument, it can also be considered as an exampleof an intercomparison between GB instruments atthree different sites.The quality of the recently refined retrieval ofmesopause region temperatures from the CryogenicInfrared Spectrometers and Telescopes for theAtmosphere (CRISTA) satellite instrument is sogood that they can serve excellently as a transfer1699standard for GB instrument comparisons (seeGusev et al., this issue). The purpose of the presentpaper is to take advantage of this, the nearly globalcoverage of the two CRISTA missions, and theavailability of GB observations at many sites,during the related campaigns.2. Data availableAlthough the number of ground stations thattook temperature measurements during the twoCRISTA flights has been considerable (nearly twodozens), only about one-third of these could be usedin the present study because of the miss time anddistance criteria that require nearly simultaneousCRISTA and GB observations, within a reasonablemaximum distance (here, a radius of 1000 km wassomewhat arbitrarily chosen). In principle, mesopause region temperatures from any source aresuitable for this study. However, only temperaturesderived from nocturnal airglow observations couldactually be employed here, for meeting the criteriamentioned. Most of the available data are rotationaltemperatures of OH emissions in different Meinelbands (or as Doppler temperatures, from one site)that originate in a layer centered at 87 km, and6–10 km wide. There are also rotational temperatures from the O2b(0–1) atmospheric band, orDoppler temperatures of the OI 558 nm emissionline, available from two instruments. These emissions correspond to nominal heights of 95 or 96 km,respectively (with layer thickness not much differentfrom OH).Table 1 contains information about the instrumentation and data characteristics at the sites:Maimaga Observatory near Yakutsk (YAK) inSiberia; Booth Bay (BOO), Millstone Hill (MIH),and Wallops Island (WAL) in the United States;Table 1Observation sites and ground-based instrumentation. (Stc ¼ station code; IF ¼ interferometer; SP ¼ spectrometer)StcObs. siteGeogr.Loc.(fov) Airglow emission Theor. coeff.BOOBUEBooth BayBuenos Aires44.671N 69.681W34.591S 58.441WOH (3–1), (4–2)OH (6–2),O2 (0–1)DAV Davis68.581S 77.971E OH (6–2)LEO El Leoncito31.801S 69.301W OH (6–2),O2 (0–1)MIH Millstone Hill 41.831N 71.501W OH (3–1), (4–2)MJO Mt. John43.981S 170.421E OI 558, OHWAL Wallops Island 37.931N 75.471W OH (3–1)YAK Yakutsk631N129.51E OH (7–3)Mies (1974)Mies (1974)Watson (1968)Langhoff et al. (1986)Mies (1974)Watson (1968)Mies (1974)DopplerMies (1974)Krassovsky et al. (1962)Instrument typeInstrument referenceMichelson IFTilting filter SPEspy et al. (1995)Scheer and Reisin (2001)Czerny–Turner SP French et al. (2000)Tilting filter SPScheer and Reisin (2001)Michelson IFFabry–Perot IFEbert–Fastie SPGrating SPEspy et al. (1995)Hernandez et al. (1995)Bittner et al. (2002)Ammosov et al. (1992)
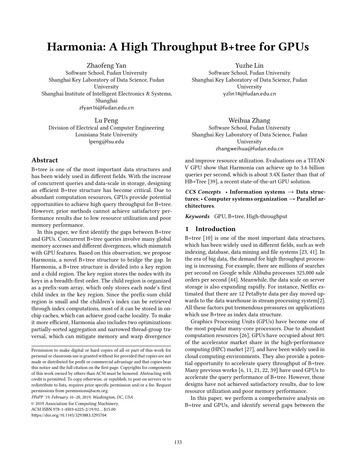
ARTICLE IN PRESS1700J. Scheer et al. / Journal of Atmospheric and Solar-Terrestrial Physics 68 (2006) 1698–1708El Leoncito (LEO) and Buenos Aires (BUE) inArgentina; Mount John Observatory (MJO) in NewZealand; and Davis (DAV) in Antarctica. Thegeographical locations are given with respect tothe field of view, at the altitude of the airglow layers.Also, references are given about theoretical transition probabilities and about descriptions of instrumentation and data reduction technique used, ineach case. The different airglow bands and transition probabilities are expected to lead to differentunrelated systematic errors in the determination ofrotational temperatures (Turnbull and Lowe, 1989),which makes empirical intercomparisons morenecessary. The MJO data are Doppler temperaturesthat are expected to be free from such errors.The CRISTA instrument and mission characteristics of the two flights in November 1994 andAugust 1997 have been described by Offermann etal. (1999) and by Grossmann et al. (2002, 2004).CRISTA temperatures for the mesopause region arederived from limb radiance measurements of theCO2 bands at 4.3 and 15 mm. A detailed descriptionof the instrument characteristics, orbital geometryand other factors related to the temperaturemeasurements during the CRISTA-1 mission hasbeen given by Riese et al. (1999). An account of thedetermination of CO2 densities necessary for temperature retrieval is contained in the paper byKaufmann et al. (2002). The present data are basedon the refined non-LTE temperature retrievaldeveloped recently by Gusev et al. (this issue). It isimportant to understand that the vertical temperature profiles needed for the comparison with GBobservations are obtained after a complex geometrical transformation from radiances integratedalong an approximately horizontal path aroundthe tangent point (for a given altitude) that involveshorizontal averaging. This somewhat reduces therelevance of zero miss distance comparisons.Although the total time of measurements was 9days during each flight, less than one half of thetime was employed to determine mesopause regiondata. The fraction of time corresponding tonocturnal overpasses depends on latitude. DuringCRISTA-2, most northern latitudes only had daytime overpasses (Grossmann et al., 2002), makingdirect comparison with nighttime airglow observation impossible.3. ProcessingThe CRISTA data from both missions wereaccessed through the CRISTA data managementand visualization program GLOBAL that allows usto selectively extract the pertinent temperature datafor the overpasses at the different geographicallocations. Without this and other software tools,even the detection of overpass conditions wouldhave been a laborious and error-prone task.Fig. 1. Example of CRISTA profiles for one overpass at El Leoncito (LEO), for the overpass times and miss distances corresponding tothe labels a–d, and the map view (right-hand insert). Center panel shows profiles weighted with airglow-equivalent Gaussian shape (seetext). Horizontal dashed lines mark nominal airglow levels.
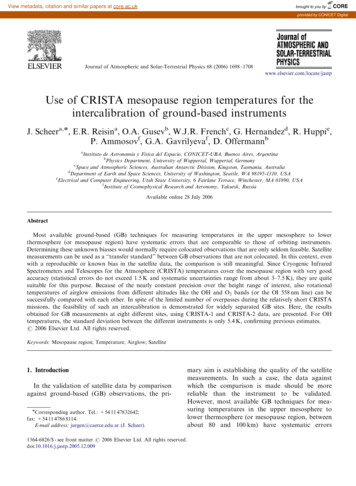
ARTICLE IN PRESSJ. Scheer et al. / Journal of Atmospheric and Solar-Terrestrial Physics 68 (2006) 1698–1708Individual CRISTA profiles during a singleoverpass can vary considerably. An example foran overpass at a midlatitude site (LEO) can be seenin Fig. 1 (left panel). The geometry of this overpasscan be appreciated in the map view inserted in theright-hand panel, which presents the geographicposition of the four tangent points relative to theLEO site, during the northward passage of CRISTA-2, on 14 August 1997 at about 9:10 UT. In spiteof the small temporal spacing of the individualprofiles that are not more than 1 min apart,temperature differences reach 40 K, at some altitudes. This variation is almost completely geophysical, since the statistical error bars (not shown) donot exceed 71 K, at 87 km, and 71.5 K, at 100 km(Gusev et al., this issue). The vertical oscillationsvisible in the profiles are part of the three-dimensional (3D) wave structure that also causes thedifference between profiles. This complex wavestructure, which CRISTA samples along its track,is a superposition of different modes of planetarywaves (Ward et al., 2000; Smith et al., 2002) andtides (Ward et al, 1999; Oberheide and Gusev, 2002;Oberheide et al., 2000, 2003), including transients,and also some gravity waves (Preusse et al., 2001).To improve the comparison with airglow-derivedtemperatures, CRISTA profiles are smoothed with aGaussian weighting function of 8 km full-width athalf-maximum, as an approximation to a typicalvertical emission profile, for any of the three airglowemissions considered here. These filtered profiles areshown in the center panel of Fig. 1. The smoothingalso reduces somewhat the variation from profile toprofile. For the nominal altitudes of the airglowlayers, at 87 and 95 km (or 96 km, for the OI 558 nmemission), ‘‘airglow-equivalent’’ CRISTA temperatures, Tc, are thus defined, and are used instead ofthe values taken from the raw profiles, in thefollowing analysis. Although variations from thenominal airglow emission altitudes by a few kilometers are known to occur, we assume, as is usuallydone in airglow work, that the nominal values aregood approximations and do not introduce seriouserrors, on average. The estimates of the possibleerror due to this altitude uncertainty that we givefor examples from LEO and MJO (see below) showthat this assumption is reasonable.Fig. 2 gives an impression of the typical relationbetween temporal variations of CRISTA and GBtemperatures during the same overpass. The figureshows a 1-h section of the data from LEO centeredon the CRISTA passage. The upper panel compares1701O2 temperatures to airglow-equivalent CRISTAdata for 95 km, while the lower panel does the samefor OH and CRISTA temperatures at 87 km. Errorbars for the airglow data are derived from photoncounting statistics for each point (Reisin andScheer, 2004). Since the statistical errors forCRISTA are only slightly greater than the size ofthe symbols, they are omitted here.The scatter of the CRISTA temperatures isgreater than that of the airglow data. This reflectsthe fact that the spatial variation (due to mediumand large-scale waves, as mentioned) sampled byCRISTA surpasses the short-term temporal variability at a fixed ground station. Ground stationvariability cannot be so strong. For instance, at afixed place, the tidal variation corresponding to thegreatest observed semidiurnal amplitudes of 25 Kdoes not exceed 0.2 K/min, and a strong gravitywave with 10 min period and 5 K amplitude createsa maximum variation of only about 3 K/min. On theother hand, during the overpass in Fig. 2, CRISTAtemperatures at 95 km vary by 20 K in less than aminute, during which the satellite moves by about400 km. At 87 km, neighboring CRISTA points varyby as much as 16 K, over the same time span anddistance. There is however no prominent correlationbetween the CRISTA and LEO data, at the timescale of an overpass.Two different overpasses at DAV (incidentallyfor the same date as Fig. 2) are documented inFig. 3, with OH temperatures and CRISTAobservations at 87 km. The upper panel focusseson the 17:55 UT overpass, and the lower one on thefollowing overpass near 19:30 UT. In the latter case,the six CRISTA profiles involved are the maximumnumber possible within the 1000 km miss distancecircle under normal (non-‘‘stare mode’’) observingconditions. Geophysical variability as sampled byCRISTA appears only small, here. However, this isnot the typical situation at DAV, where CRISTAsees even stronger variations than at LEO, in mostoverpasses. Namely, the mean standard deviation(SD) within the individual overpasses at DAV(including those without GB data) was 8.9 K, whileat LEO, it was 6.5 K. So, both figures give an idea ofhow strongly the observed variability can actuallydiffer.Since there is no simple regularity in the variationof CRISTA temperatures with miss distance, thereis no straightforward way to extrapolate to zeromiss distance, and so get rid of the bias from thespatial modulation. This would require a more
ARTICLE IN PRESS1702J. Scheer et al. / Journal of Atmospheric and Solar-Terrestrial Physics 68 (2006) 1698–1708Fig. 2. Temporal variations of ground-based (open circles) and airglow-equivalent CRISTA temperatures (dots) for the same overpass asin Fig. 1. Upper (lower) panel shows O2 (OH) rotational temperatures and CRISTA data at 95 km (87 km). Error bars for airglowtemperatures are derived from photon statistics. CRISTA errors (not shown) are approximately the size of the symbols.Fig. 3. Temporal variations of ground-based (open circles) and airglow-equivalent CRISTA temperatures (dots) during two consecutiveoverpasses at Davis (DAV). Time scale for the upper panel is shown on top. As in Fig. 2, error bars for airglow temperatures are derivedfrom photon statistics.detailed knowledge of the 3D spatial structure of thewave system than available from the limitedsampling resolution. Therefore, we can only com-pare directly with the simultaneous GB data,without taking distances into account (except forthe 1000 km miss distance limit), hoping that
ARTICLE IN PRESSJ. Scheer et al. / Journal of Atmospheric and Solar-Terrestrial Physics 68 (2006) 1698–1708statistics will help to reduce bias. Of course, such ahope could only be more fully justified for missionsof long duration, when a considerable number ofoverpasses is available at each site. For the shortduration CRISTA flights, this neglect of missdistance may affect some of our results.Instead of individual GB temperatures (Tg), it ispreferable to use averages /TgSj over intervalsaround each overpass sufficiently long to reduce thenoise level below that due to the spatial variations.For the data at several sites, averaging over such‘‘miss time intervals’’ (MTIs) of 715 min wasadequate, but for some instruments, longer intervalswere chosen. For each overpass, the mean airglowequivalent CRISTA temperature over the individualprofiles is determined to behT c ij ¼ P1jPjXT ci ,i¼1where Pj is the number of profiles in overpass j, andT ci are the airglow-equivalent CRISTA temperatures, as mentioned. For the LEO overpass examplegiven above, this process leads to the mean filteredprofile in the right-hand panel of Fig. 1. Theuncertainty in the true airglow emission height leadsto an effect of only 1–2 K/km, in this example,which is expected to diminish with averaging overseveral overpasses./TcSj is then subtracted from the average GBtemperature /TgSj. The mean difference /TdS isobtained for each site, weighted by the number ofCRISTA profiles Pj,PNj¼1 Pj ðhT g ij hT c ij ÞhT d i ¼,PNj¼1 Pjwhere N is the number of overpasses at the site.The 1s uncertainty of /TdS and the SD arecomputed in a manner consistent with the weightingby the number of profiles. This implies that thenumber of statistical degrees of freedom (dof) is thetotal number of CRISTA profiles used. Althoughthere should be no systematic bias due to randomfluctuations, the quality of the statistical estimatorof SD degrades inevitably for small dof.In addition to this direct overpass (‘‘zero’’ misstime) method, it would have been desirable to beable to process data for daytime overpasses usingGB data from neighboring nights. This would haveincreased the number of overpasses and dataavailable from other sites. However, tidal effects,especially from the diurnal tide, can be expected to1703defeat such a scheme. Comparison of daytimeCRISTA data with the average of GB temperaturesobtained in the previous and following nightsindeed showed results appreciably different fromthose obtained by night overpasses alone. Becauseof the unpredictable day-to-day and day-to-nightvariability, these tidal effects cannot be correctedwithout additional information. Therefore, thisalternative method had to be abandoned, and theanalysis had to be based exclusively on directoverpass data.4. Results and discussionTable 2 lists the GB and CRISTA data corresponding to each of the direct overpasses, at thedifferent sites (in the same alphabetic order as inTable 1). Data type is distinguished by the labelsOH, O2, or OI for the nominal altitudes 87, 95, and96 km, respectively. Date, day of the year (doy), andoverpass time are given consistently with respect touniversal time. MTIs used in the calculation of themean GB data, /TgS, are as listed in Table 3. P isthe number of CRISTA profiles with the meantemperature /TcS at the nominal altitude, andTd ¼ /TgS–/TcS is the corresponding temperature offset.The mean results of the intercomparison for eachsite are shown in Table 3. The SD describes therepeatability of an individual GB minus CRISTAcomparison, with the main contribution due tospatial variability. The maximum MTI has beenincreased from the default value of 715 minwhenever necessary to ensure that the GB noiselevel stays below the uncertainty from the spatialvariability.The most reliable result in the table is obtained atDAV, due to the considerable number of overpassesand CRISTA-2 profiles. On average, OH temperatures at DAV are nearly 5 K higher than CRISTAtemperatures at 87 km, with an uncertainty of only1.4 K. Note that the DAV data are derived withEinstein coefficients after Langhoff et al. (1986),and that use of the improved empirical values byFrench et al. (2000) would reduce the offset to about2.8 K. This result thus lends credibility to theempirical Einstein coefficients.The results for LEO are based on nine CRISTAprofiles during three overpasses. Because of thisrelatively good statistics, the conclusions aboutoffsets different from zero can therefore be drawnwith confidence. While there is a negative bias of
ARTICLE IN PRESSJ. Scheer et al. / Journal of Atmospheric and Solar-Terrestrial Physics 68 (2006) 1698–17081704Table 2Ground-based (/TgS) and CRISTA data (/TcS) for each overpass at sites StcStcDTDatedoy/TgSOverpass 78.66 4.39 1.34 0.936.8411.51 2.516.38 6.964.30 5.446.132.8310.0810.825.1517.38 14.4118.70 3.436.83 1.643.86 1.614.4719.94 2.62 3.9210.874.151.01Data type (DT) distinguishes airglow emission and corresponding CRISTA altitude. Td ¼ /TgS /TcS, and P gives the number ofCRISTA profiles. Times and dates are in UT.Table 3Comparison of GB rotational temperatures of OH (87 km) and O2/OI 558 (95 km/96 km) with CRISTA overpass temperatures, at thedifferent ground stationsStcCRMTI (min)/TdS (87 km) (K)SD 7757157750.272.211.57(8.1)4.871.4 6.773.22.871.5 9)/TdS (95 km) (K)6.87(7.9)SD 033131Station codes (Stc) are as defined in Table 1. CRISTA missions 1 and 2 are distinguished in column CR. MTI is the (nominal) miss timeinterval used, /TdS the mean difference between GB and CRISTA temperature (see text for details), accompanied by 1s error andstandard deviation (SD), dof the number of CRISTA profiles, and ovp the number of overpasses. For dof ¼ 1, errors are estimated fromtypical standard deviations (in parentheses; see text).aOI 558 nm Doppler temperature at 96 km.
ARTICLE IN PRESSJ. Scheer et al. / Journal of Atmospheric and Solar-Terrestrial Physics 68 (2006) 1698–1708about 7 K, for OH temperatures, there is a positiveone of nearly 16 K for O2 temperatures. A veryuseful conclusion from these results, which has notbeen available otherwise, is the offset between theabsolute scales of the OH and O2 temperaturesobtained with the Argentine airglow spectrometer.Although both parameters are measured with thesame instrument, systematic errors for both emissions are independent, because of the differenttransition probabilities. The present results meanthat for the data set obtained at LEO since August1997, the O2 temperatures had a bias of 22.374.3 Kwith respect to the OH temperatures, so that it nowbecomes possible to talk about temperature differences between both altitudes in absolute terms, andto derive vertical temperature gradients from thesedata. Note that the uncertainty in this bias does notinclude a small effect of systematic errors fromCRISTA (see Gusev et al., this issue). Since only thedifference of these errors at the two altitudesmatters, a contribution not greater than 71.5 Kfrom this source should be expected.There is a zero offset for the data at BOO,supported by five CRISTA-1 profiles in four overpasses. For MIH, the offset is only slightly positive(less than 3 K). Because of the small geographicalseparation between the fields of view of theinstruments at MIH and BOO (350 km), all fourCRISTA profiles corresponding to MIH coincidewith those at BOO (see Table 2), and therefore theerrors are not completely uncorrelated. The closeness between the results at both sites (within thecombined error bars) is what one would expect oftwo instruments with the same characteristics anddata reduction technique (Espy et al., 1995).The result for WAL is derived from threeCRISTA-1 profiles, each in a different overpass(two profiles are shared with MIH and BOO). Theoffset is nearly 4 K, but the error bar makes this stillconsistent with zero. Since this same instrument hasbeen used at different sites, including duringcolocated comparisons of the other University ofWuppertal spectrometer, GRIPS-2 (Graef, 1991),this result has consequences beyond the operation atWAL (see also, von Savigny et al., 2004).GB data for only one overpass in 1997 areavailable at MJO, and therefore results are moresubject to statistical uncertainties than the previouscases. However, the data are particularly valuablefor this comparison because they are Dopplertemperatures, not rotational temperatures, andtherefore do not depend on poorly known transition1705probabilities. Since there were four CRISTA profiles to compare with, the contribution of spatialvariability to the final error can be estimateddirectly, while the GB contribution must be deducedfrom Tg statistics. OH Doppler temperature, withan offset of about 3 K, is well consistent withCRISTA. The Doppler temperature derived fromthe OI 558 nm line, with an emission layernominally centered at 96 km, has a considerablepositive bias of nearly 2076 K, contrary to expectation. Emission height changes even by severalkilometers do not affect the outcome by more than1 K, in this case. Such an offset, taken at face value,would be difficult to explain. However, the missdistance effect may have played an important role:during closest approach (192 km miss distance), theoffset was only 8.9 K. That is, the main contribution to the mean offset comes from the data atgreater miss distance (340–970 km). The offset mayalso be affected by the systematic error of CRISTA,estimated to be 6 K at this altitude. Thus, thediscrepancy may be not as serious as it seems.At YAK, the offset obtained is 178 K, based ononly one CRISTA-1 profile (as also occurred forBUE, see below). Since the error bar cannot bedetermined explicitly from the data alone, as in thecases with more than one overpass, the error isestimated from the variability of individual CRISTA profiles during a single overpass at LEO (6.5 K,as mentioned above). This value does not includevariations between different overpasses, and is usedas an ad-hoc estimator expected to be applicableeverywhere, when there is no better alternative.Combined with the statistical error of /TgS atYAK, the error given in parentheses in Table 3 isobtained. The good agreement is also interestingbecause little is known about the reliability of thetransition probabilities used in this case (given byKrassovsky et al., 1962).At BUE, with only one CRISTA-1 profile tocompare with, error analysis must be done in thesame way as for YAK. Although the instrument isthe same as that used at LEO, a different opticalfilter was employed, and spectral background fromstrong city light contamination had to be correctedfor, so that the data at BUE and LEO need not beexpected to agree. For OH temperature, an offset ofabout 1278 K results, and for O2, of about 778 K.The behavior for OH is really different in comparison with LEO, but for O2 the offset is still similar,within the large error margin. The results for BUEare applicable only for the measuring conditions
ARTICLE IN PRESS1706J. Scheer et al. / Journal of Atmospheric and Solar-Terrestrial Physics 68 (2006) 1698–1708that prevailed during the 1994 campaign, becausefilter characteristics were probably also differentfrom previous campaigns. The present results haveno impact on the long-term trend analysis performed with this instrument (Reisin and Scheer,2002), since the 1994 data were not used there.An overview of the results can also be gleanedfrom Fig. 4, where the offsets between GB andCRISTA temperatures are plotted, for the eightdifferent sites. The figure establis
tion between the LIMS instrument on the Nimbus-7 satellite and meteorological rockets (Gille et al., 1984) has been one of the first applications of this technique. This led to an extensive intercomparison . Watson (1968) MIH Millstone Hill 41.831N 71.501W OH (3-1), (4-2) Mies (1974) Michelson IF Espy et al. (1995)