Transcription
State of LouisianaDepartment of Health & HospitalsHealthy Blue (Previously Amerigroup)Annual External Quality Review Technical ReportReview Period: July 1, 2017 – June 30, 2018Report Issued: April 23, 2019
TABLE OF CONTENTSI.INTRODUCTION . 1II.MCO CORPORATE PROFILE . 2III. ENROLLMENT AND PROVIDER NETWORK . 3Enrollment . 3Provider Network . 4IV. QUALITY INDICATORS . 5Performance Improvement Projects . 5Member Satisfaction: Adult and Child CAHPS 5.0H . 13Health Disparities . 15V.COMPLIANCE MONITORING. 17Medicaid Compliance Audit Findings for Contract Year 2016 . 17VI. STRENGTHS, OPPORTUNITIES FOR IMPROVEMENT & RECOMMENDATIONS. 19Strengths . 19Opportunities for Improvement . 19Recommendations. 20Response to Previous Year’s Recommendations . 21Healthy Blue Annual EQR Technical Reporting Year July 1, 2017 – June 30, 2018ii
LIST OF TABLESTable 1: MCO Corporate Profile .2Table 2: Medicaid Enrollment as of June 20171 .3Table 3: Primary Care & OB/GYN Counts by Geographic Service Area (GSA) .4Table 4: GeoAccess Provider Network Accessibility – as of July 27, 2018 .4Table 5: HEDIS Effectiveness of Care Measures – 2016-2018 . 10Table 6: HEDIS Access to/Availability of Care Measures – 2016-2018 . 11Table 7: Use of Services Measures – 2016-2018 . 12Table 8: Adult CAHPS 5.0H – 2016-2018 . 13Table 9: Child CAHPS 5.0H General Population – 2016-2018. 14Table 10: Child CAHPS 5.0H CCC Population – 2016-2018 . 14Table 11: 2017 Compliance Audit Determination Definitions. 17Table 12: Audit Results by Audit Domain . 18HEDIS and Quality Compass are registered trademarks of the National Committee for Quality Assurance (NCQA). NCQA HEDIS Compliance Audit is a trademark of the NCQA. NCQA is a trademark of the National Committee for Quality Assurance.CAHPS is a registered trademark of the Agency for Healthcare Research and Quality (AHRQ).Healthy Blue Annual EQR Technical Reporting Year July 1, 2017 – June 30, 2018iii
I.INTRODUCTIONThe Centers for Medicare and Medicaid Services (CMS) require that state agencies contract with an ExternalQuality Review Organization (EQRO) to conduct an annual external quality review (EQR) of the services providedby contracted Medicaid managed care organizations (MCOs). This EQR must include an analysis and evaluationof aggregated information on quality, timeliness and access to the health care services that an MCO furnishes toMedicaid recipients. Quality is defined in 42 Code of Federal Regulations (CFR) 438.320 as “the degree to whichan MCO or PIHP increases the likelihood of desired health outcomes of its enrollees through its structural andoperational characteristics and through the provision of health services that are consistent with currentprofessional knowledge”.In order to comply with these requirements, the Louisiana Department of Health (LDH) contracted with IPRO toassess and report the impact of its Medicaid managed care program, the Healthy Louisiana Program, and each ofthe participating MCOs on the accessibility, timeliness and quality of services. Specifically, this report providesIPRO’s independent evaluation of the services provided by Healthy Blue for review period July 1, 2017 – June 30,2018.The framework for IPRO’s assessment is based on the guidelines and protocols established by CMS, as well asLouisiana State requirements. IPRO’s assessment included an evaluation of the mandatory activities, whichencompass: performance measure validation, Performance Improvement Project (PIP) validation andcompliance audits. Results of the most current HEDIS and CAHPS surveys are presented and are evaluated incomparison to the NCQA’s Quality Compass 2018 South Central – All Lines of Business (LOB) ExcludingPreferred-Provider Organizations (PPOs) and Exclusive Provider Organizations (EPOs) Medicaid benchmarks.Section VI provides an assessment of the MCO’s strengths and opportunities for improvement in the areas ofaccessibility, timeliness and quality of services. For areas in which the MCO has opportunities for improvement,recommendations for improving the quality of the MCO’s health care services are provided. To achieve fullcompliance with federal regulations, this section also includes an assessment of the degree to which the MCOhas effectively addressed the recommendations for quality improvement made by IPRO in the previous year’sEQR report. The MCO was given the opportunity to describe current and proposed interventions that addressareas of concern, as well as an opportunity to explain areas that the MCO did not feel were within its ability toimprove. The response by the MCO is appended to this section of the report.Healthy Blue Annual EQR Technical Reporting Year July 1, 2017 – June 30, 2018Page 1
II.MCO CORPORATE PROFILETable 1: MCO Corporate ProfileType of OrganizationTax StatusYear OperationalProduct Line(s)Total Medicaid Enrollment (as of June 2017)Healthy BlueHealth Maintenance OrganizationFor Profit02/01/2012Medicaid and LaCHIP248,050Healthy Blue Annual EQR Technical Reporting Year July 1, 2017 – June 30, 2018Page 2
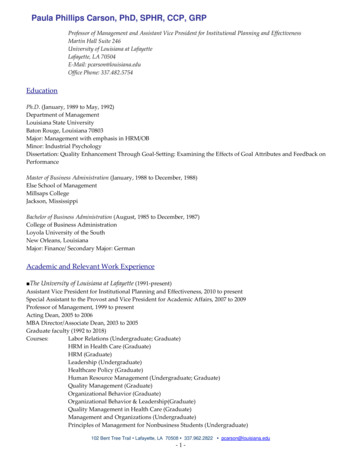
III.ENROLLMENT AND PROVIDER NETWORKEnrollmentMedicaid EnrollmentAs of June 2018, the MCO’s Medicaid enrollment totaled 248,050, which represents 17% of Healthy Louisiana’sactive members. Table 2 displays Healthy Blue’s Medicaid enrollment for 2016 to 2018, as well as the 2018statewide enrollment total. Figure 1 displays Health Louisiana’s membership distribution across all MedicaidMCOs.Table 2: Medicaid Enrollment as of June 20181Healthy BlueJune 2016June 2017June 2018% ChangeTotal Enrollment207,406236,196248,0505.0%June 2018StatewideTotal21,473,685Data Source: Report No. 125-A1This report shows all active members in Healthy Louisiana as of the effective date above. Members to be disenrolled at the endof the reporting month are not included. Enrollees who gained and lost eligibility during the reporting month were not included.Enrollees who opted out of Healthy Louisiana during the reporting month were not included.2Note: The statewide total includes membership of all Medicaid MCOs.Figure 1. Healthy Louisiana Membership by MCO as ofJune 2018UHCCP29%Aetna8%Healthy Blue17%Amerihealth14%LHCC32%Healthy Blue Annual EQR Technical Reporting Year July 1, 2017 – June 30, 2018Page 3
Provider NetworkProviders by SpecialtyLDH requires each MCO to report on a quarterly basis the total number of network providers. Table 3 shows thesum of Healthy Blue’s primary care providers, OB/GYNs and other physicians with primary care responsibilitieswithin each LDH region as of March 7, 2018.Table 3: Primary Care & OB/GYN Counts by LDH RegionHealthy BlueLDH RegionSpecialtyFamily Practice/ GeneralMedicinePediatricsNurse PractitionersInternal a source: Network Adequacy Review 2018 Q2LDH Region 1: New Orleans; Region 2: Baton Rouge; Region 3: Houma Thibodaux; Region 4: Lafayette; Region 5: Lake Charles; Region 6:Alexandria; Region 7: Shreveport; Region 8: West Monroe; Region 9: Hammond1The FQHC/RHC mapping for miles and minutes are incorrect and will be corrected prior to quarter 3.Provider Network AccessibilityHealthy Blue monitors its provider network for accessibility and network capability using the GeoAccesssoftware program. This program assigns geographic coordinates to addresses so that the distance betweenproviders and members can be assessed to determine whether members have access to care within areasonable distance from their homes. Table 4 shows the percentage of members for whom geographic accessstandards were met.Table 4: GeoAccess Provider Network Accessibility – as of July 27, 2018Access Standard1Provider TypeX Provider(s) within X MilesUrban1 within 10 milesAdult PCPRural1 within 30 milesUrban1 within 10 milesAdolescent PCPRural1 within 30 milesUrban1 within 15 milesOB/GYNRural1 within 30 milesData Source: Network Adequacy Review 2018 Q21The Access Standard is measured in distance to member address.Healthy Blue Annual EQR Technical Reporting Year July 1, 2017 – June 30, 2018Page 4Percentage of Members forWhom Standard was Met98.3%100.0%98.7%100%95.8%95.4%
IV.QUALITY INDICATORSTo measure quality of care provided by the MCOs, the State prepares and reviews a number of reports on avariety of quality indicators. This section is a summary of findings from these reports, including PerformanceImprovement Projects (PIPs), as well as HEDIS and CAHPS.Performance Improvement ProjectsPIPs engage MCO care and quality managers, providers and members as a team with the common goal ofimproving patient care. The MCO begins the PIP process by targeting improvement in annual baselineperformance indicator rates. The next step is to identify barriers to quality of care, and to use barrier analysisfindings to inform interventions designed to overcome the barriers to care. Interventions are implemented andmonitored on an ongoing basis using quarterly intervention tracking measures. Declining quarterly interventiontracking measure rates signal the need to modify interventions and re-chart the PIP course. Improvingintervention tracking measures are an indication of robust interventions.Healthy Louisiana is in the process of conducting two collaborative PIPs: (1) Improving Prenatal and PostpartumCare to Reduce the Risk of Preterm Birth and (2) Improving the Quality of Diagnosis, Management and CareCoordination for Children and Adolescents with Attention-Deficit Hyperactivity Disorder (ADHD). The five MCOsagreed upon the following intervention strategies for each PIP:(1) Improving Prenatal and Postpartum Care to Reduce the Risk of Preterm Birth Implement the Notice of Pregnancy communication from provider to MCO Implement the High-Risk Registry communication from MCO to provider Conduct provider education for how to provide and bill for evidence-based care Develop and implement or revised care management programs to improve outreach to eligible and atrisk members for engagement in care coordination(2) Improving the Quality of Diagnosis, Management and Care Coordination for Children and Adolescents withADHD Improve workforce capacity Conduct provider education for ADHD assessment and management consistent with clinical guidelines Expand PCP access to behavioral health consultation Develop and implement or revised care management programs to improve outreach to eligible and atrisk members for engagement in care coordinationSummaries of each of the PIPs conducted by Healthy Blue follow.Healthy Blue Annual EQR Technical Reporting Year July 1, 2017 – June 30, 2018Page 5
Improving Prenatal and Postpartum Care to Reduce the Risk of Preterm BirthIndicators, Baseline Rates and Goals: The indicators, baseline rates and corresponding target rates forperformance improvement from baseline to final measurement are as follows: Initiation of injectable progesterone for preterm birth prevention between the 16th and 24th week ofgestation: increase from 18.60% to 19.40% Chlamydia test during pregnancy: increase from 52.40% to 65.00% HIV test during pregnancy: decrease from 31.70% to 27.20% Syphilis test during pregnancy: decrease from 44.50% to 28.60% Use of most effective contraceptive methods: decrease from 15.84% to 4.12% Use of moderately effective contraceptive methods: decrease from 34.20% to 10.60% Use of LARC during delivery hospitalization: decrease from 1.40% to 0.51% Use of LARC outpatient 56 days post-partum: decrease from 10.60% to .10% HEDIS Postpartum Care measure: increase from 61.97% to 65.21%Intervention Summary Provider- Send NOP fax blast to all OB/GYNs- Medicaid 101 Roadshow- OB Practice Consultant targeting providers with lowest LARC usage MCO:- Notification of high-risk pregnant members to providers- OB Practice Consultant to provide education to internal case management department on importance ofengaging with high risk pregnant members Member:- Care Management Outreach and Engagement Program- Home visits for women who fall in the “difficult to reach population” to help educate them about alphahydroxyprogesterone caproate (17P) injection and postpartum health- Member Incentive Plan- LARC pregnancy packets distributed to high risk members.Results From first to fourth quarter 2017, the rate of NOP forms received from providers increased from 39% to44%. From first to fourth quarter 2017, the percentage of pregnancy packets distributed increased from 10% to56% From first to fourth quarter 2017, the percentage of women who received incentive payments forcompleting screenings for sexually transmitted diseases increased from 7% to 10%, and the percentage whoreceived incentive payments for completing the postpartum visit increased from 8% to 14%. From interim to final measurement, the percentage of pregnant women who were screened for chlamydiaincreased from 58% to 65%.Overall Credibility of Results: The validation findings generally indicate that the credibility of the PIP results isnot at risk. Results must be interpreted with some caution due to the decrease of the 17P eligible populationfrom baseline to final-re-measurement period.Strengths: The use of 17-P had an improvement from baseline to final measurement due to the increase ineducation to members and providers.Healthy Blue Annual EQR Technical Reporting Year July 1, 2017 – June 30, 2018Page 6
Opportunities for Improvement: LDH Managed Care Prematurity Prevention Improvement Project is seeking novel ways to engage providersin the fight against prematurity. As a next step, LDH has requested that each Healthy Louisiana MedicalDirector, together with each MCO’s Prematurity Prevention Performance Improvement (PIP) quality team,and a volunteer physician representing the Medicaid Quality Maternity Care Subcommittee, meet with oneprovider practice to support quality improvement efforts at that practice. Based upon an analysis ofopportunities to improve high risk member receipt of 17P, each PIP quality team has selected one providerto meet with on-site at their practice. At the provider site visit, each MCO team should complete thePractice Engagement Worksheet in collaboration with the practice providers to inform planning of furtherPDSA cycles and interventions. As part of ongoing PDSA efforts to improve early identification and outreach of members at risk for pretermbirth and/or preeclampsia, MCOs should identify and address any outstanding care coordination and dataintegrity challenges. For example: clarification, communication and integration of data sources, collectionmethods, tasks, persons responsible, and timeframes are merited to ensure that members with a history ofpreterm birth, as well as those at risk for preeclampsia, are identified early for care management outreach,care coordination and engagement. The ITM workgroup should continue monitoring the Intervention Tracking Measures (ITMs) and, in responseto issues revealed by the pattern analysis using the IHI Rules for Interpreting Charts, conduct barrier analysisto identify root causes, and use barrier analysis findings to inform modifications to interventions on anongoing basis as part of the PDSA quality improvement process.Improving the Quality of Diagnosis, Management and Care Coordination for Children and Adolescents withADHDIndicators, Baseline Rates and Goals: The indicators, baseline rates and corresponding target rates forperformance improvement from baseline to interim measurement are as follows: Validated ADHD screening instrument: increase from 22.70% to 46.67% ADHD screening in multiple settings: decrease from 28.00% to 17.33% Assessment of other behavioral health conditions/symptoms: increase from 57.30% to 57.33% Positive findings of other behavioral health conditions: increase from 57.30% to 60.00% Referral for evaluation of other behavioral health conditions: increase from 41.90% to 57.78% Referral to treat other behavioral health conditions: decrease from 41.90% to 22.22% Primary care provider care coordination: decrease from 29.30% to 26.67% MCO care coordination: decrease from 62.70% to 2.66% MCO outreach with member contact: decrease from 62.70% to 1.33% MCO outreach with member engagement: decrease from 66.00% to 0.00% First line behavior therapy for children less than 6 years: decrease from 81.00% to 11.36% Percentage of members aged 6-12 years as of the index prescription start date (IPSD) with anambulatory prescription dispensed for ADHD medication, who had one follow-up visit with practitionerwith prescribing authority during the 30-day initiation phase: increase from 47.42% to 48.70% Percentage of members aged 6-12 years as of the IPSD with an ambulatory prescription dispensed forADHD medication, who remained on the medication for at least 210 days and who, in addition to thevisit in the initiation phase, had at least two follow-up visits with a practitioner within 270 days (ninemonths) after the initiation phase ended: increase from 60.21% to 62.95% Percentage of any ADHD cases, aged 0-20 years, stratified by age and foster care status, withdocumentation of behavioral health pharmacotherapy (ADHD medication, antipsychotic medication,and/or other psychotropic medication), with behavioral therapy: increase from 20.80% to 28.60%Healthy Blue Annual EQR Technical Reporting Year July 1, 2017 – June 30, 2018Page 7
Percentage of any ADHD cases, aged 0-20 years, stratified by age and foster care status, withdocumentation of behavioral health pharmacotherapy (ADHD medication, antipsychotic medication,and/or other psychotropic medication), without behavioral therapy: increase from 35.75% to 43.88%Percentage of any ADHD cases, aged 0-5 years, stratified by age and foster care status, withdocumentation of behavioral health pharmacotherapy (ADHD medication, antipsychotics, and/or otherpsychotropics), without behavioral therapy: increase from 42.26% to 46.76%Intervention Summary: Develop targeted provider and member outreach for children in foster care. Train PCPs on available behavioral health educational resources and online resources for assessment andtreatment, tailored to the unique educational needs of pediatricians and family practitioners as identified bythe ADHD provider survey findings. Expand access to in-person or telephonic case consultation to PCPs Quality Management outreach specialist to assist with scheduling 30-day follow-up appointment withmembers’ prescribed ADHD medication. Educational letters mailed and faxed to the PCP’s of members who were newly prescribed an ADHDmedication. Connect families to non-pharmacologic interventions for a minimum of 6 months prior to initiatingmedication.Results: The use of validated ADHD screening instrument results from baseline to interim improved by 23.97%. Theinterim rate has exceeded the target goal by 14.07%. BH Drug without Behavioral Therapy has increased from baseline to interim (inverted measure). The interimrate is 18.88 percentage points above the inverted goal.Strengths: The MCO achieved improvement for some measures through provider and member education andoutreach.Opportunities for Improvement: Increase the proportion of PCPs who treat children who received the ADHD PCP TOOLKIT with MCO ProviderEducation on using the Vanderbilt Assessment for ADHD evaluation and diagnosis. Increase the proportion of targeted Evidence-Based Practice (EBP) Behavior Therapists Qualified to treatchildren 6 years of age diagnosed with ADHD who completed EBP training. Increase the proportion of PCPs who treat children who received behavioral provider referral list with MCOProvider Education on the EBP qualifications of behavioral providers on the referral listHealthy Blue Annual EQR Technical Reporting Year July 1, 2017 – June 30, 2018Page 8
Performance Measures: HEDIS 2018 (Measurement Year 2017)MCO-reported performance measures were validated as per HEDIS 2018 Compliance Audit specificationsdeveloped by the National Committee for Quality Assurance (NCQA). The results of each MCO’s HEDIS 2018Compliance Audit are summarized in its Final Audit Report (FAR).HEDIS Effectiveness of Care MeasuresHEDIS Effectiveness of Care measures evaluate how well a MCO provides preventive screenings and care formembers with acute and chronic illnesses. Table 5 displays MCO performance rates for select HEDISEffectiveness of Care measures for HEDIS 2016, HEDIS 2017, and HEDIS 2018, Healthy Louisiana 2018 statewideaverages and Quality Compass (QC) 2018 South Central – All Lines of Business (LOB) (Excluding PPOs and EPOs)Medicaid benchmarks.Healthy Blue Annual EQR Technical Reporting Year July 1, 2017 – June 30, 2018Page 9
Table 5: HEDIS Effectiveness of Care Measures – 2016-2018HEDIS 2016HEDIS 2017HEDIS 201877.67%52.16%71.46%43.51%81.75%48.79%QC 2018South Central –All 9%84.67%32.36%33.33rd66.67th10th10th90th33.33rd .71% 10th45.10%Healthy BlueMeasureAdult BMI AssessmentAntidepressant Medication Management - Acute PhaseAntidepressant Medication Management - ContinuationPhaseAsthma Medication Ratio (5-64 Years)Breast Cancer Screening in WomenCervical Cancer ScreeningChildhood Immunization Status - Combination 3Chlamydia Screening in Women (16-24 Years)Comprehensive Diabetes Care - HbA1c TestingControlling High Blood PressureFollow-Up Care for Children Prescribed ADHD Medication- Continuation and Maintenance PhaseFollow-Up Care for Children Prescribed ADHD Medication- Initiation PhaseMedication Management for People With Asthma Total Medication Compliance 75% (5-64 Years)Weight Assessment and Counseling for Nutrition andPhysical Activity for Children/Adolescents - BMI PercentileWeight Assessment and Counseling for Nutrition andPhysical Activity for Children/Adolescents - Counseling forNutritionWeight Assessment and Counseling for Nutrition andPhysical Activity for Children/Adolescents - Counseling forPhysical ActivityBR: Biased RateHealthy Blue Annual EQR Technical Reporting Year July 1, 2017 – June 30, 2018Page 10HealthyLouisiana2018 Average81.97%54.05%
HEDIS Access to/Availability of Care MeasuresThe HEDIS Access to/Availability of Care measures examine the percentages of Medicaid children/adolescents, child-bearing women and adults whoreceive PCP/preventive care services, ambulatory care (adults only) or receive timely prenatal and postpartum services. Table 6 displays MCO rates forselect HEDIS Access to/Availability of Care measure rates for HEDIS 2016, HEDIS 2017, HEDIS 2018, Healthy Louisiana 2018 statewide averages andQuality Compass 2018 South Central – All Lines of Business (LOB) (Excluding PPOs and EPOs) Medicaid benchmarks.Table 6: HEDIS Access to/Availability of Care Measures – 2016-2018MeasureHEDIS 201612–24 Months25 Months–6 Years7–11 Years12–19 Years94.30%82.06%84.78%83.26%20–44 Years45–64 Years65 Years77.76%86.09%79.43%Timeliness of Prenatal CarePostpartum Care82.16%61.97%QC 2018South Central –Healthy BlueAll LOBs(ExcludingPPOs/EPOs)MedicaidHEDIS 2017HEDIS 2018BenchmarkMet/ExceededChildren and Adolescents’ Access to .16%10th85.10%87.36%25thAdults’ Access to Preventive/Ambulatory 1%10thAccess to Other Services77.89%76.89%25th65.11%65.21%50thHealthy Blue Annual EQR Technical Reporting Year July 1, 2017 – June 30, 2018Page 11Healthy Louisiana2018 8.40%64.04%
HEDIS Use of Services MeasuresThis section of the report details utilization of Healthy Blue’s services by examining selected HEDIS Use of Services rates. Table 7 displays MCO rates forselect HEDIS Use of Services measure rates for HEDIS 2016, HEDIS 2017, HEDIS 2018, Healthy Louisiana 2018 statewide averages and Quality Compass2018 South Central – All Lines of Business (LOB) (Excluding PPOs and EPOs) Medicaid benchmarks.Table 7: Use of Services Measures – 2016-2018HEDIS 2016HEDIS 2017HEDIS 201841.20%47.24%51.09%QC 2018South Central –All 5266.67th418.7473.71%66.09%Retired2Not 4.40%63.49%68.13%33.33rd68.06%Healthy BlueMeasureAdolescent Well-Care VisitAmbulatory Care Emergency Department Visits/1000Member Months1Ambulatory Care Outpatient Visits/1000 MemberMonthsFrequency of Ongoing Prenatal Care - 81%Well-Child Visits in the First 15 Months of Life 6 VisitsWell-Child Visits in the 3rd, 4th, 5th and 6th Years ofLife12A lower rate is desirable.NCQA retired this measure from HEDIS 2018.Healthy Blue Annual EQR Technical Reporting Year July 1, 2017 – June 30, 2018Page 12HealthyLouisiana2018 Average54.18%
Member Satisfaction: Adult and Child CAHPS 5.0HIn 2018, the Consumer Assessment of Healthcare Providers and Systems (CAHPS ) 5.0H survey of AdultMedicaid members and Child Medicaid with Chronic Care Conditions (CCC) was conducted on behalf of HealthyBlue by the NCQA-certified survey vendor, DSS Research. For purposes of reporting the Child Medicaid with CCCsurvey results, the results are divided into two groups: General Population and CCC Population. The GeneralPopulation consists of all child members who were randomly selected for the CAHPS 5.0H Child survey duringsampling. The CCC Population consists of all children (either from the CAHPS 5.0H Child survey sample or theCCC Supplemental Sample) who are identified as having a chronic condition, as defined by the member'sresponses to the CCC survey-based screening tool.Table 8, Table 9 and Table 10 show Healthy Blue’s CAHPS rates for 2016, 2017, and 2018 as well as QualityCompass 2017 South Central – All Lines of Business (LOB) (Excluding PPOs and EPOs) Medicaid benchmarks.Table 8: Adult CAHPS 5.0H – 2016-2018Healthy BlueMeasure1Getting Needed CareGetting Care QuicklyHow Well Doctors CommunicateCustomer ServiceShared Decision Making2Rating of All Health CareRating of Personal DoctorRating of SpecialistRating of Health PlanCAHPS 2016CAHPS 2017CAHPS .74%75.86%77.59%1QC 2017South Central –All ded10th 10th10th50th66.67th50th33.33rd 10th33.33rdNote: for “Rating of” measures, Medicaid rates are based on ratings of 8, 9 and 10; for measures that call for respondents to answerwith “Always,” “Usually,” “Sometimes” or “Never” the Medicaid rate is based on responses of “Always” or “Usually”.2In 2016, NCQA revised measure specifications and response options.Healthy Blue Annual EQR Technical Reporting Year July 1, 2017 – June 30, 2018Page 13
Table 9: Child CAHPS 5.0H General Population – 2016-2018Healthy BlueMeasure1Getting Needed CareGetting Care
Healthy Blue (Previously Amerigroup) Annual External Quality Review Technical Report . OB/GYN 175 115 49 76 47 27 86 49 66 594 Data source: Network Adequacy Review 2018 Q2 LDH Region 1: New Orleans; Region 2: Baton Rouge; Region 3: Houma Thibodaux; Region 4: Lafayette; Region 5: Lake Charles; Region 6: .