![4535&(* '3.&803, '03 %&.* 41 & ] - University Of Virginia](/img/39/uvaacademicspaceframeworkplan.jpg)
Transcription
STRATEGICFRAMEWORKFORACADEMICSPACE 2018
Table of ContentsACKNOWLEDGEMENTS. 1executive summary. 3overview of academic space. 7instructional space utilization. 23synthesis of Previous studies . 37changing modalities. 43recommendations. 53appendices. 61A. ADDITIONAL ANALYSISB. Additional Case studiesc. Previous studies & summariesD. Meeting minutes
sAcknowledgements 1
executive summaryThe University of Virginia manages a complex portfolio of buildings that includes over four millionassignable square feet of academic space (excluding athletics, clinical, and residential space).Understanding how this space is used and managed today is critical for contextualizing each of theUniversity’s schools’ projections of future growth and space requirements, and for creating a rigorousstrategic framework to inform future capital-investment decisions. This study therefore has threeprimary purposes. To: Analyze the use, configuration, and future needs of the University’s instructional space portfolio;Synthesize the myriad of space studies conducted for individual schools and/or around specifictopics, and to identify common themes, minimize the need for duplication, and identifyopportunities for sharing;Provide a series of policy recommendations that together form a strategic framework for themanagement and prioritization of academic space at UVA, and that can be used to support thedevelopment of the University’s new strategic plan.Our key findings are that: UVA’s current approach to space planning and capital development is decentralized, and thatthere is likely value in the University adopting a more synergistic and strategic posture.The University faces a climate of shifting modalities, primarily in active learning and interdisciplinaryresearch, and the majority of its current space portfolio is not well-suited to this change.Optimizing the use of existing resources is therefore critical so as to enlarge the pie for potentialreinvestment.The University could better drive positive culture change if it had a governance structure thatintegrated academic, financial, and physical planning, supported by data, tools, and processesthat empower transparent, analytical, and rigorous decision making.With respect to the University’s Provost-controlled classroom portfolio, the data strongly suggests thatUVA has a sufficient quantity of classroom space to meet current and projected demand, and thatmore efficient use of this portfolio is realistically achievable, particularly on Monday and Wednesdaymornings.However, qualitatively, UVA will need a different kind of classroom in the future. Future pedagogies atUVA will almost certainly continue shifting toward active learning models, but the existing classroominventory restricts the University’s ability to implement this change. In the near-term, the Universitycan (slightly) improve the utilization of existing active learning classrooms, and it can, on a small scale,convert existing traditional classrooms to active learning classrooms. But intermediate- and long-termneeds will not be met by these changes. There are likely very few, if any, candidates for conversion oflarger rooms, particularly at the 120-person capacity, identified as an area of significant need. The studyfinds that for every shift of 5% of the total number of sections from traditional to active learning, theUniversity will need to provide seven to eight additional active learning classrooms.With respect to research space, 62% of UVA’s existing portfolio is outmoded, in poor condition, and/or notwell-suited to the kinds of interdisciplinary, problem-based team research the University is increasinglyemphasizing (the data provided, and our analysis, do not reflect the renovations of Chemistry, Gilmer,and Pinn Hall). Modernizing the University’s research space portfolio is therefore a critical priority.2Executive Summary 3
Approximately one-third of the University’s academic space is offices. Several studies, includingthe UVA Administrative Staff Space Study and the Health Sciences Integrated Space Plan, havesuggested alternative workplace configurations. Because of the sheer quantity of office ASF, continuedexperimentation with workplace models is a high-value proposition.Over the last several years, UVA has conducted multiple, independent space needs studies, primarilyat the level of individual schools. A simple aggregation of stated need totals approximately 587,000ASF (excluding non-academic space from the Health System). This decentralized approach to spaceplanning and capital development likely overstates need (this is certainly the case for classrooms), andignores opportunities for sharing. We therefore conclude that while new space is warranted in somecases (for example: growth in engineering will require more space), an emphasis on adaptive reuse orreplacement, and the creation of a holistic context from which to consider future unit-based studiesshould be a high priority for UVA.With respect to future development, the University is fortunate to have multiple opportunities in anumber of different districts: Ivy Corridor, Stacey-West Main, Brandon Avenue, and Fontaine ResearchPark. These zones represent over 2.5 million square feet of development potential (and a futureredevelopment of what is now the West Complex could offer another 500,000 square feet). Each ofthese opportunities could be transformative, and their order and character will define the future ofGrounds. It is therefore imperative to prioritize these opportunities in conjunction with an overall visionfor UVA that integrates academic, financial, and physical planning.Finally, the study makes several policy recommendations. The key finding is that UVA’s academic spacegovernance structures need to be unified and activated. To accomplish this, the study recommendsundertaking a grounds-plan update that, based on identified redevelopment zones, assesses andprioritizes synergies for the location and phasing of future uses on Grounds; helps shape space needsdeveloped by schools or other planning efforts; and helps form a platform for integrated planning.The University should also consider adjusting incentive and organizational structures to impact theformation of capital projects, promote interdisciplinarity, and better support project prioritization.4
Overview of academic space
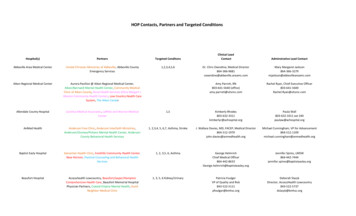
OVERVIEWThe Strategic Framework for Academic Space was a six-month inquiry, conducted from April throughOctober 2018. It engaged various stakeholders from the Office of the Architect for the University,Facilities Management, the Office of the Provost, and individual schools and colleges.The key purpose of the study was to understand how academic space at the University is used andmanaged today, and to lay the groundwork for the future prioritization of capital projects.The study’s key tasks were to:1. Review and synthesize existing data and previously-completed unit studies2. Undertake an instructional space and informal learning space study3. Create a strategic framework for managing and prioritizing academic spaceACADEMIC SPACE ACROSS GROUNDSassignable square feet of academic spaceby space typeThe study explored the composition and utilization of over four million assignable square feet (ASF) ofacademic space at the University of Virginia. The pie chart below shows the breakdown of this spaceby space type, with athletics, clinical, and residential space excluded. Across Grounds, UVA’s academicspace includes approximately 300,000 ASF of classroom space (7%), 840,000 ASF of research labs (21%),1.3 million ASF of offices (32%), 500,000 ASF of study space (12%), of which nearly half is made up ofstacks, and 400,000 ASF of general use space (10%). This last category includes assembly, exhibition,dining, lounge, auditoria, gallery and other assorted spaces. Among large research universities similarto UVA, this space breakdown, including the relative percentages of classroom and office space, is fairlytypical.BREAKDOWN OF ACADEMIC SPACE (4.1 MILLION ASF)*Excludes athletics, clinical, and residential space8Overview of academic space 9
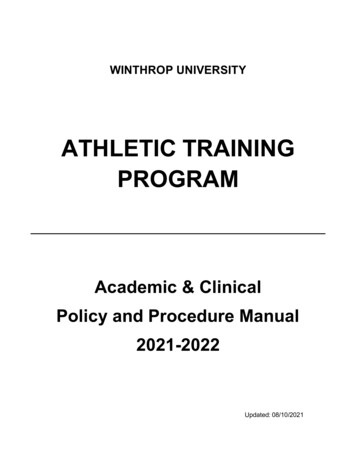
BENCHMARKINGoffice asf/student fte110Brown100Georgia TechCase Western9080Office ASF/Student FTENormative approaches to university space planning have inherent limitations because explorationsof per student square foot space allocations in major space categories across different colleges anduniversities reveal an almost linear distribution, with little clustering of the data (presumably if therewere a “correct” answer or a perfect space-need formula, this would produce clustering aroundspecific per square foot values in real-world institutional space inventories). Benchmarking is alsoperilous because it is often difficult to achieve true “apples to apples” comparisons, with matchingassumptions in how data is collected across institutions. All of this notwithstanding, here are severalcomparisons that provide high-level feedback on UVA’s relative position regarding available space.Our comparison dataset contains information from over 100 different institutions, and the graphsbelow and on the opposite page show UVA’s assignable square feet per student in classroom, office,study, and general use categories. Several relevant comparator institutions are noted. In general,UVA’s classroom and general use ASF/student FTE is in the middle of the dataset, while UVA is on thehigher end with respect to office and study space ASF/student FTE.UT Austin70Ohio S tyCommunity Collegestudy asf/student fte7060classroom asf/student fteStudy ASF/Student FTE507040Brown30602021.8UGAOhio StateCase WesternRutgersSyracuseMissouri GeorgetownGeorgiaTechArizonaS Carolina FloridaPurdue10500University4070302010Community Collegegeneral use asf/student fteOhio StateGeorgetown S CarolinaRutgersArizona FloridaPurdueUT Austin MissouriGeorgia TechUGA UNLUNC CH0UniversityCommunity CollegeCase WesternSyracuseBrown60BrownUVA13.4General Use ASF/Student FTEClassroom ASF/Student FTEUVAUT AustinUNL5040UNL Case WesternUT AustinSyracuse30Georgia TechS CarolinaOhio 17.2Arizona0University10Community CollegeOverview of academic space 11
classrooms by SIZE & station COUNTCLASSROOMsThe pie charts below show the capacity and “ownership” of UVA’s 280 classrooms. Most classrooms(84%) have station counts between one and 80 seats. The majority of UVA’s classrooms (71%) fall underthe jurisdiction of the Provost; these classrooms are centrally managed and are open to all academicunits. The remaining classrooms (29%) are controlled by individual schools/colleges and units.distribution of classroomsby station countThe graph below shows the distribution of classrooms arranged from left to right by ASF per stationin ascending order, with each classroom colored based on its capacity. The diagram shows that roomswith smaller capacities have a higher ASF per station and vice versa (this is typical and is usually drivenby the type of furniture used to configure the different kinds of classrooms). Note, in particular, thatthe University’s current supply of rooms in the 120-seat range have an average station size around 16ASF. This will be relevant in our latter discussion of the need for additional active learning classrooms.distribution of classroomsby “owner”total classrooms: 28012Overview of academic space 13
classroom asf distributionThe heatmap below shows the distribution of classroom space across Grounds. The darker a buildingis colored, the more ASF of classroom space that building contains. The map illustrates an importanteast-west academic spine, stretching from Gilmer Hall in the west, to the University Hospital in the east.The professional schools also support a significant classroom concentration in North Grounds. The fourbuildings with the highest concentrations of classroom space are New Cabell Hall, Robertson Hall, theLaw School, and the Darden School of Business.teaching labORATORIESThe pie charts below describe UVA’s teaching laboratory space. The left pie chart shows the breakdownbetween class labs, which have regularly-scheduled formal instruction, and open labs, which include bothprogram-specific non-scheduled spaces and other University resources like computer labs and makerspaces. The right pie chart shows the distribution of these open laboratories by their administrator. TheCollege of Arts and Sciences controls just over half of all open laboratories on Grounds, and the Schoolof Engineering and Applied Sciences administers nearly one-third, with the remainder under the controlof a variety of entities, as shown.scheduled and open teaching labsopen labs by “owner”total labs: 25814Overview of academic space 15
open lab distribution by asfteaching lab asf distributionThe graph below shows the distribution of open labs arranged from left to right by ASF in ascendingorder, with each lab colored based on its administrator. We have labeled the five largest open labs onGrounds as well as several of the smallest. While open labs are an important part of many programs,the nature of the labs usually prevents good record keeping of their usage. It would therefore beappropriate for the University to review open lab assignments on a periodic basis to ensure optimalspace allocations.The heatmap below shows the distribution of teaching lab ASF across Grounds (this includes both spaces usedfor scheduled instruction and open labs). The darker blue a building is colored, the more ASF of lab spaceit contains. Labs are largely clustered around the science, engineering, and architecture buildings. The twobuildings with the highest concentrations of teaching lab space are the Chemistry Building and Campbell Hall.(Note that the square footage indicated for Chemistry shows the building’s pre-renovation configuration)ASFResearch lab asf distribution16The heatmap below shows the distribution of research lab ASF across Grounds. The darker blue a buildingis colored, the more ASF of lab space it contains. This map reveals three centers of research activity onGrounds—one at the medical center in the east, one around the science and engineering district in thewest, and the Fontaine Research Park southwest of Central Grounds. The three buildings with the highestconcentrations of research lab space are the Chemistry Building, Gilmer Hall, and Pinn Hall. (Note that thesquare footage indicated for Gilmer Hall shows the building’s pre-renovation configuration)Overview of academic space 17
maker space distributionThe map below shows the distribution of maker spaces across Grounds. These are collaborative workspaces with special features and technologies to facilitate learning, exploration, and fabrication of items.At UVA, maker spaces include wood shops, 3D printing labs, computer labs, and other productionoriented spaces.MECHATRONICS LAB, MECHANICAL ENGINEERING BUILDINGdrama department scene & prop shop, drama buildingscholars’ lab, alderman libraryschool of architecture “fab lab”, campbell hallPhotos courtesy of University Communications18Overview of academic space 19
office asf per stationoffice asf distributionThe office space category is the single largest category of academic space at UVA (and all otheruniversities) with over 1.3 million ASF, nearly one-third of all the University’s academic space. The graphbelow shows the distribution of offices by station size, arranged from left to right in ascending order.The top five offices with the largest ASF per station figures are labeled. Per the Administrative SpaceStudy, the recommended figure for private offices is 130 ASF; this line is marked on the chart. UVA,however, currently has an average (academic) office station size of 134 ASF, with 47% of offices havingan ASF per station figure greater than 130. Note that these station size calculations include large openspace and bullpen configurations as well as private offices.The heatmap below shows the distribution of office space across Grounds. The darker blue a building iscolored, the more ASF of office space it contains. The four buildings with the highest concentrations ofoffice space are Thornton Hall, Rice Hall, New Cabell Hall, and 560 Ray Hunt Drive.20Overview of academic space 21
Instructional space utilization
classroom utilizationuva-wide classrooms by controlling school/college/unitUsing data provided by UVA’s Office of the Registrar and the individual colleges (where available), wemeasured the number of hours in the week a room is used for scheduled instruction (termed weeklyroom hours or WRH) for the Fall 2017 semester. The scatter plot at the top of the opposite page showsthe utilization of all classrooms, measured by WRHs, indexed by the number of stations in the room,and colored by the room’s controlling entity. SCHEV targets 40 hours per week of classroom use forscheduled instruction. This is consistent with other states, although some still use what is now an oldfashioned 30-hour-per-week minimum target.WRHClassrooms at UVA are controlled by multiple entities. The Provost is responsible for the generalclassroom pool that can be used by any department for scheduled instruction (198 rooms); other roomsare controlled by the School of Medicine (27), Law (21), Darden (18), Engineering (6), Libraries (1), andNursing (1).This minimum target range is indicated by a yellow band on the graph; classrooms in or above thisband can be considered to have reasonable usage. In general, the scatterplot indicates that with afew exceptions, the majority of classrooms across Grounds, regardless of size or owner, are used lessthan 40 hours per week for scheduled instruction. Law, Darden, and the School of Medicine’s roomsare, generally speaking, lightly utilized (though there are questions about the completeness of the dataprovided).provost-controlled classrooms by configurationWRHThe scatterplot at the bottom of the opposite page shows only the Provost-controlled rooms, andexplores the utilization of these rooms by their configuration: sloped-floor, flat-floor, or raised-floor (toaccommodate technology). Note that almost all rooms with capacities greater than 75 have a slopedfloor, which limits teaching flexibility, and may hinder conversion for active learning purposes.24Instructional Space Utilization 25
room utilization by day and timeWhile the majority of classroom utilization is for scheduled instruction, many classrooms are also usedfor departmental events and student group usage. The graph below shows cumulative scheduledinstructional and non-instructional space utilization over the course of the semester. Scheduledinstruction is relatively consistent, while student group use has discernible peaks toward the end of thesemester. The yellow bar shows where utilization (i.e. the blue area) would be if all classrooms werescheduled for 30 to 40 WRH.The histograms below show fluctuations in the percentage of Provost-controlled classrooms throughoutthe day, by day of the week, for the busiest week of the Fall 2017 semester. Peak classroom use takesplace on Tuesday and Thursday mornings (between 9:30 AM and 11:00 AM), at which time nearly 100%of classrooms have scheduled activity. Classrooms are also used at UVA for non-instructional purposes,and in particular are an important venue for student meetings (largely because of a lack of alternativelocations for these meetings). It was therefore important to analyze the impact of non-instructional useof UVA’s classrooms. The data suggests that this non-instructional activity (departmental and studentgroup events) generally takes place after 5pm and is therefore complementary to instructional activity.While this is not a perfect arrangement, particularly given limitations on food and other amenitiesthat students would like to include in their meetings, from purely a utilization perspective the currentarrangement does not present an obstacle. Finally, we note the relatively low use during the earlymorning hours, and on Fridays; this pattern is not atypical.WRHinstructional & non-instructional classroom utilizationWRHThe bar chart below shows a single week’s worth of scheduled activity in the 10 busiest buildings onGrounds. At over 2,000 WRH, New Cabell Hall is over four times busier than the next busiest building,Robertson Hall.26Instructional Space Utilization 27
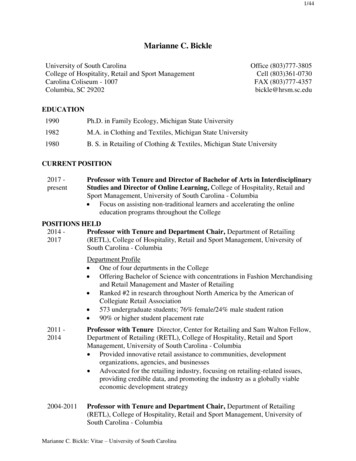
classroom metricAlong with WRH measurements, the other important consideration in classroom use is the sense ofthe overall fit of the classroom pool (and its associated station counts) with section sizes in the courseschedule. Our proposed classroom metric captures both of these considerations in a single diagram. Theexamples on the opposite page are for demonstration purposes only and do not represent conditions atUVA. The blue area shows classroom supply; each classroom generates a rectangle with height dictatedby the number of seats and width determined by the target 40 hours of scheduled use. Rooms areordered from largest to smallest. The orange area shows all scheduled instruction in classrooms. Eachcourse in the schedule generates a rectangle. The duration of the courses is represented on the x-axisand its enrollment on the y-axis. Courses are not necessarily placed in the classrooms where they aretaught, but are arranged from largest enrollment to smallest, and distributed evenly across the x-axis.LOW utilization04080120160200high utilization04080The pictures show the potential for two kinds of opportunity. “Vertical” opportunity is any blue areathat lies above an orange block, and “horizontal” opportunity is any blue area that lies betweenorange blocks. Vertical opportunity represents empty seats in a room while class is in session andcaptures notions that are traditionally resolved through the use of an average seat occupancy factor –i.e., the capacity for larger section sizes or for renovations to create smaller rooms with lower stationcounts (obviously pedagogical considerations about academic delivery need to be the primary driver).Horizontal opportunity represents the capacity to schedule more sections – i.e., times when rooms arevacant and available for use. In the example diagrams to the left, the top example shows capacity foradditional scheduled activity as well as increased enrollments, while the bottom example shows a goodfit between the classroom portfolio and sheduled instruction/course enrollment levels.The graph can easily be translated into a numerical metric by taking the ratio of the orange areato the blue area. Our diagram for UVA can be found overleaf. UVA’s classroom metric (Provost-onlyclassrooms) for the Fall 2017 semester is .467. While state systems that have adopted the use of thismetric typically target scores of .500 to .700, UVA’s score is good relative to other similar institutionswith whom we have conducted this exercise. For UVA, the diagram identifies rooms with capacities inthe 50 to 150 range as currently having fewer corresponding courses of similar size.120160200*These excerpted figures are illustrative, and do not depict UVA data.28Instructional Space Utilization 29
SPACE FILLMETRIC SCORE: 0.467TIME FILL30Instructional Space Utilization 31
enrollment PROJECTIONSPROJECTED CLASSROOM DEMANDUVA’s formal enrollment projections anticipated 22,590 students in Fall 2017. Actual enrollmentexceeded the projection by approximately 500 students. We can adjust the former projections to theactual Fall 2017 enrollment; this results in a projected student headcount of 23,523 in 2025. Currentthinking at the University, however, assumes a more “typical” (i.e. historically based) year-over-yeargrowth rate of 1% per year. When applied to actual Fall 2017 enrollment, this method results in aprojected student body of almost almost 24,989 in 2025. The graph below reflects these projections.With this rate of growth, it will be important for UVA to better utilize classrooms in order toaccommodate the increased enrollment.The graph below describes current and projected demand for classroom space, calculated in WRH(Y-axis), and compares this demand to the likely available classroom supply (again calculated in WRH).The orange bars, broken down by classroom size, represent available WRH if all rooms of that sizewere scheduled for 40 hours per week. The yellow portions of the bars represent actual Fall 2017WRH demand, and the blue portions represent projected WRH demand if enrollment were to grow1% annually through 2025. The demand for small rooms (20 seats or less) indicates the prevalence ofsmall, seminar-style courses. Note that the perceived “shortage” of smaller rooms shown in the diagramdoes not exist in practice, as these smaller sections are in reality scheduled in larger rooms, which havesignificant additional scheduling capacity. The analysis suggests that, even with relatively significantenrollment growth, UVA does not have a quantitative need for additional classrooms, assuming goodscheduling practices.CURRENT WRH DEMAND (Fall 2017):TOTAL MAX PROJECTED DEMAND (Fall 2025):TOTAL SUPPLY @ 40 WRH:326,100 WRH6,600 WRH7,900 WRHInstructional Space Utilization 33
science & engineering labs utilizationnon-science & engineering lab utilizationUnderstanding the use of teaching laboratories requires a more nuanced approach. This room categoryincludes specialized spaces used primarily for scheduled instruction, from traditional science labs todance studios and music practice rooms. Because of their specialized nature, these rooms are inherentlynot fungible, and so we divide them into departmental categories, and explore their use on a room-byroom basis.The diagram below illustrates the use of non-science teaching laboratories across Grounds. The nonscience intensive labs on Grounds show a reasonable utilization pattern, with multiple labs being usedto support more than one program. Wherever possible, the University should continue to monitoropportunities to virtualize software, and thus promote this kind of shared use.WRH target-use guidelines for science-intensive teaching labs are typically lower than similar guidelinesfor classrooms, because teaching labs also need to support project work, and required dedicated set-uptime. Usage guidelines are typically around 20 WRH for science-intensive labs, although labs servingbasic first-year introductory courses often see substantially higher utilization.For non-science intensive labs (typically computer labs of one form or another, and scheduled artsspaces), targets are more like those for classrooms, typically at 30 WRH. We recognize that some artsspaces are sometimes used for both scheduled and non-scheduled instruction, and this can complicateWRH calculations. These rooms should be considered on a case-by-case basis.The diagram below illustrates the use of scheduled science and engineering teaching laboratoriesacross Grounds. Each box in the diagrams represents an individual room. The number in the box is theroom’s WRH. The box is colored on a gradient relative to the usage guidelines discussed above. Redboxes indicate highly utilized rooms; green boxes show rooms with additional scheduling capacity. Wenote that some specialized disciplines (and sub-disciplines) may require a lab in order for the programto exist, but the WRH need for that lab may be relatively low, and because of its highly specializednature, the lab may not be suitable or use by other groups. These are always difficult (but important)considerations, and we therefore make no judgment here as to the merits of any program. At UVA,core biology and chemistry labs are well utilized. The extreme utilization value shown for the nursingteaching laboratory is likely a reflection of how record keeping for the simulation lab is handled, withthe room automatically being booked all day every day.34Instructional Space Utilization 35
synthesis of previous studies
Historically, UVA has explored the needs of individual schools or topics on an individual basis, typicallythrough the exercise of a specific, unit-based planning study. We reviewed a dozen such studies,including What’s Next for STEM at UVA? (2015), Health Systems Integrated Space Plan (2017), and Arts& Sciences Space Planning Organizational Roadmapping (2018), all of which were completed withinthe last four-to-five years. A complete list of the studies we referenced can be found in the appendix.While the studies were specific to the needs of their sponsoring unit, they did have several commoncomponents. These included a quantitative assessment of additional space needs (usually due torecent and projected student and faculty growth; i.e., Curry School, School of Engineering and AppliedSciences), or space needs associated with new programs (i.e. Contemplative Commons, a dedicatedbuilding for the Batten School). They also include significant qualitative concerns around the conditionof research space (i.e. School of Engineering and Applied Sciences, School of Medicine), and an overalldearth of flexible, collaborative space (a theme identified across the studies).aggregated space needs from studiesWRHWe reviewed and aggregated the space needs identified by the individual studies (using the “mid-term”projection for SEAS and excluding the clinical component of the School of Medicine’s projections) byspace type. The result is an aggregate “need” of almost 600,000 ASF, including over 100,000 ASF ofclassroom space (a 33% increase in the current portfolio), 186,000 ASF of laboratory space, 92,000additional ASF of
study, and general use categories. Several relevant comparator institutions are noted. in general, uvA's classroom and general use AS f/student fTE is in the middle of the dataset, while uvA is on the higher end with respect to office and study space ASF/student FTE. 0 10 20 30 40 50 60 70 80 90 100 110 Office ASF/Student FTE University .