Transcription
Benchmarking ETL WorkflowsAlkis Simitsis1, Panos Vassiliadis2, Umeshwar Dayal1,Anastasios Karagiannis2, Vasiliki Tziovara21HP Labs, Palo Alto, CA, USA,{alkis, Umeshwar.Dayal}@hp.com2University of Ioannina, Dept. of Computer Science, Ioannina, Hellas{pvassil, ktasos, vickit}@cs.uoi.grAbstract. Extraction–Transform–Load (ETL) processes comprise complex dataworkflows, which are responsible for the maintenance of a Data Warehouse. Aplethora of ETL tools is currently available constituting a multi-million dollarmarket. Each ETL tool uses its own technique for the design and implementation of an ETL workflow, making the task of assessing ETL tools extremelydifficult. In this paper, we identify common characteristics of ETL workflowsin an effort of proposing a unified evaluation method for ETL. We also identifythe main points of interest in designing, implementing, and maintaining ETLworkflows. Finally, we propose a principled organization of test suites based onthe TPC-H schema for the problem of experimenting with ETL workflows.Keywords: Data Warehouses, ETL, benchmark.1 IntroductionData warehousing is a technology that enables decision-making and data analysis inlarge organizations. Several products are available in the market and for their evaluation, the TPC-H benchmark has been proposed as a decision support benchmark [16].TPC-H focuses on OLAP (On-Line Analytical Processing) queries and it mainly dealswith the data warehouse site. Another version termed TPC-DS has been around forthe last few years, but this version is still in a draft form [11, 15]. TPC-DS considers abroader picture than TPC-H including the whole flow from the sources to the targetdata warehouse. However, it partially covers the data warehouse maintenance part,considering only simple mechanisms for inserting and deleting tuples.To populate a data warehouse with up-to-date records extracted from operationalsources, special tools are employed, called Extraction – Transform – Load (ETL)tools, which organize the steps of the whole process as a workflow. To give a generalidea of the functionality of these workflows we mention their most prominent tasks,which include: (a) the identification of relevant information at the source side; (b) theextraction of this information; (c) the transportation of this information to the DataStaging Area (DSA), where most of the transformation usually take place; (d) thetransformation, (i.e., customization and integration) of the information coming frommultiple sources into a common format; (e) the cleansing of the resulting data set, onthe basis of database and business rules; and (f) the propagation and loading of thedata to the data warehouse and the refreshment of data marts.This is the author's version of the work. It is posted here for your personal use. Not for redistribution. The definitive version waspublished in TPCTC 2009 and it should be cited as: “A. Simitsis, P. Vassiliadis, U. Dayal, A. Karagiannis, V. Tziovara. Benchmarking ETL Workflows. In Proceedings of the First International TPC Technology Conference on Performance Evaluation &Benchmarking (TPC-TC'09), Lyon, France, August 24, 2009.” The original publication is available at www.springerlink.com.
Due to their importance and complexity (see [2, 12] for relevant discussions andcase studies), ETL tools constitute a multi-million dollar market. There is a plethoraof commercial ETL tools available. The traditional database vendors provide ETLsolutions along with the DBMS’s: IBM with InfoSphere Information Server [7], Microsoft with SQL Server Integration Services (SSIS) [9], and Oracle with OracleWarehouse Builder [10]. There also exist independent vendors that cover a large partof the market (e.g., Informatica with Powercenter [8] and Ab Initio [1]). Nevertheless,an in-house development of the ETL workflow is preferred in many data warehouseprojects, due to the significant cost of purchasing and maintaining an ETL tool. Thespread of existing solutions comes with a major drawback. Each one of them followsa different design approach, offers a different set of transformations, and provides adifferent internal language to represent essentially similar functions.Although Extract-Transform-Load (ETL) tools are available in the market for morethan a decade, only in the last few years have researchers and practitioners started torealize the importance that the integration process has in the success of a data warehouse project. There have been several efforts towards (a) modeling tasks and theautomation of the design process, (b) individual operations (with duplicate detectionbeing the area with most of the research activity) and (c) some first results towards theoptimization of the ETL workflow as a whole (as opposed to optimal algorithms fortheir individual components). For lack of space, we refer the interested reader to [12]for a detailed survey on research efforts in the area of ETL tools.The wide spread of industrial and ad-hoc solutions combined with the absence of amature body of knowledge from the research community is responsible for the absence of a principled foundation of the fundamental characteristics of ETL workflowsand their management. A small list of shortages concerning such characteristics include: no principled taxonomy of individual activities exists, few efforts have beenmade towards the optimization of ETL workflows as a whole, and practical problemslike recovering from failures and handling evolution have mostly been ignored. Thus,a commonly accepted, realistic framework for experimentation is also absent.Contributions. In this paper, we aim at providing a principled categorization oftest suites for the problem of experimenting with a broad range of ETL workflows.First, we provide a principled way for constructing ETL workflows (Section 2). Weidentify the main functionality provided by representative commercial ETL tools andcategorize the ETL operations into abstract logical activities. Based on that, we propose a categorization of ETL workflows, which covers frequent design cases. Then,we describe the main configuration parameters and a set of measures to be monitoredfor capturing the generic functionality of ETL tools (Section 3). Finally, we providespecific ETL scenarios based on the aforementioned analysis, which can be used as anexperimental testbed for the evaluation of ETL design methods or tools (Section 4).2.Problem FormulationIn this section, we introduce ETL workflows as graphs. Then, we zoom in the microlevel of ETL workflows inspecting each individual activity in isolation and then, wereturn at the macro-level, inspecting how individual activities are “tied” altogether tocompose an ETL workflow. Finally, we discuss the characteristics of ETL executionand we tie them to the goals of the proposed benchmark.2
2.1ETL workflowsAn ETL workflow is a design blueprint for the ETL process. The designer constructsa workflow of activities (or operations), usually in the form of a graph, to specify theorder of cleansing and transformation operations that should be applied to the sourcedata, before being loaded to the data warehouse. In what follows, we use the termrecordsets to refer to any data store that obeys a schema (such as relational tables andrecord files) and the term activity to refer to any software module that processes theincoming data, either by performing any schema transformation over the data or byapplying data cleansing procedures. Activities and recordsets are logical abstractionsof physical entities. At the logical level, we are interested in their schemata, semantics, and input-output relationships; however, we do not deal with the actual algorithmor program that implements the logical activity or with the storage properties of arecordset. When in a later stage, the logical-level workflow is refined at the physicallevel a combination of executable programs/scripts that perform the ETL workflow isdevised. Then, each activity of the workflow is physically implemented using variousalgorithmic methods, each with different cost in terms of time requirements or systemresources (e.g., CPU, memory, disk space, and disk I/O).Formally, we model an ETL workflow as a directed acyclic graph G(V,E). Eachnode v V is either an activity a or a recordset r. An edge (a,b) E is a provider relationship denoting that b receives data from node a for further processing. Nodes a andb are the data provider and data consumer, respectively. The following wellformedness constraints determine the interconnection of nodes in ETL workflows: Each recordset r is a pair (r.name, r.schema), with the schema being a finite listof attribute names. Each activity a is a tuple (N,I,O,S,A). N is the activity’s name. I is a finite set ofinput schemata. O is a finite set of output schemata. S is a declarative descriptionof the relationship of its output schema with its input schema in an appropriatelanguage (without delving into algorithmic or implementation issues). A is the algorithm chosen for activity’s execution. The data consumer of a recordset cannot be another recordset. Still, more thanone consumer is allowed for recordsets. Each activity must have at least one provider, either another activity or a recordset. When an activity has more than one data providers, these providers can beother activities or activities combined with recordsets. The data consumer of an activity cannot be the same activity.2.2Micro-level activitiesAt a micro level, we consider three broad categories of ETL activities: (a) extractionactivities, (b) transformation and cleansing activities, and (c) loading activities.Extraction activities extract the relevant data from the sources and transport themto the ETL area of the warehouse for further processing (possibly including operations like ftp, compress, etc.). The extraction involves either differential data sets withrespect to the previous load, or full snapshots of the source. Loading activities have todeal with the population of the warehouse with clean and appropriately transformed3
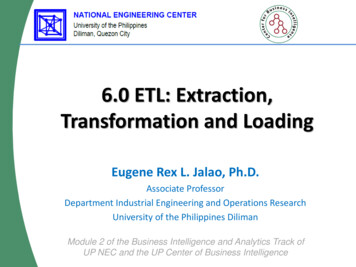
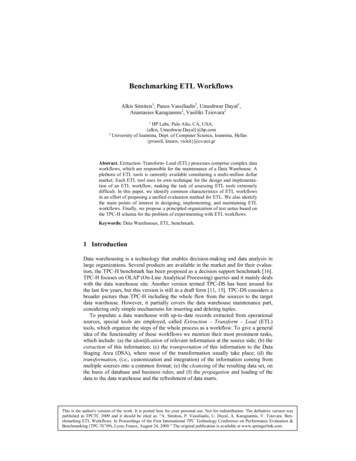
left wingbodyright wingFigure 1. Butterfly configurationdata. This is typically done through a bulk loader program; nevertheless the processalso includes the maintenance of indexes, materialized views, reports, and so on.Transformation and cleansing activities can be coarsely categorized with respect tothe result of their application to data and the prerequisites, which some of them shouldfulfill. In this context, we discriminate the following categories of operations: Row-level operations, which are locally applied to a single row. Router operations, which locally decide, for each row, which of the many (output) destinations it should be sent to. Unary Grouper operations, which transform a set of rows to a single row. Unary Holistic operations, which perform a transformation to the entire data set.These are usually blocking operations. Binary or N-ary operations, which combine many inputs into one output.All frequently built-in transformations in the majority of commercial solutions fallinto our classification (see for example Figure A3 – in the appendix).2.3Macro level workflowsThe macro level deals with the way individual activities and recordsets are combinedtogether in a large workflow. The possibilities of such combinations are infinite. Nevertheless, our experience suggests that most ETL workflows follow several high-levelpatterns, which we present in a principled fashion in this section.We introduce a broad category of workflows, called Butterflies. A butterfly (see also Figure 1) is an ETL workflow that consists of three distinct components: (a) theleft wing, (b) the body, and (c) the right wing of the butterfly. The left and right wings(separated from the body with dashed lines in Figure 1) are two non-overlappinggroups of nodes which are attached to the body of the butterfly. Specifically: The left wing of the butterfly includes one or more sources, activities and auxiliary data stores used to store intermediate results. This part of the butterfly performs the extraction, cleaning and transformation part of the workflow and loadsthe processed data to the body of the butterfly. The body of the butterfly is a central, detailed point of persistence that is populated with the data produced by the left wing. Typically, the body is a detailedfact or dimension table; still, other variants are also possible. The right wing gets the data stored at the body and utilizes them to support reporting and analysis activity. The right wing consists of materialized views, reports, spreadsheets, as well as the activities that populate them. In our setting, weabstract all the aforementioned static artifacts as materialized views.4
Balanced Butterflies. A butterfly that includes medium-sized left and right wingsis called a Balanced butterfly and stands for an ETL scenario where incoming sourcedata are merged to populate a warehouse table along with several views or reportsdefined over it. Figure 1 is an example of this class of butterflies. This variantrepresents a symmetric workflow (there is symmetry between the left and rightwings). However, this is not always the practice in real-world cases. For instance, thebutterfly’s triangle wings are distorted in the presence of a router activity that involves multiple outputs (e.g., copy, splitter, switch, and so on). In general, the twofundamental wing components can be either lines or combinations. In the sequel, wediscuss these basic patterns for ETL workflows that can be further used to constructmore complex butterfly structures. Figure 2 depicts example cases of these variants.Lines. Lines are sequences of activities and recordsets such that all activities haveexactly one input (unary activities) and one output. Lines form single data flows.Combinations. A combinator activity is a join variant (a binary activity) thatmerges parallel data flows through some variant of a join (e.g., a relational join, diff,merge, lookup or any similar operation) or a union (e.g., the overall sorting of twoindependently sorted recordsets). A combination is built around a combinator withlines or other combinations as its inputs. We differentiate combinations as left-wingand right-wing combinations.Left-wing combinations are constructed by lines and combinations forming the leftwing of the butterfly. The left wing contains at least one combination. The inputs ofthe combination can be: Two lines. Two parallel data flows are unified into a single flow using a combination. These workflows are shaped like the letter ‘Y’ and we call them Wishbones. A line and a recordset. This refers to the practical case where data are processedthrough a line of operations, some of which require a lookup to persistent relations. In this setting, the Primary Flow of data is the line part of the workflow. Two or more combinations. The recursive usage of combinations leads to manyparallel data flows. These workflows are called Trees.Observe that in the cases of trees and primary flows, the target warehouse acts asthe body of the butterfly (i.e., there is no right wing). This is a practical situation thatcovers (a) fact tables without materialized views and (b) the case of dimension tablesthat also need to be populated through an ETL workflow. In some cases, the body ofthe butterfly is not necessarily a recordset, but an activity with many outputs (see lastexample of Figure 2). Then, the main goal of the scenario is to distribute data to theappropriate flows; this task is performed by an activity serving as the butterfly’s body.Right-wing combinations are created by lines and combinations on the right wingof the butterfly. These lines and combinations form either a flat or a deep hierarchy. Flat Hierarchies. These configurations have small depth (usually 2) and largefan-out. An example of such a workflow is a Fork, where data are propagatedfrom the fact table to the materialized views in two or more parallel data flows. Right - Deep Hierarchies. We also employ configurations with right-deep hierarchies. These configurations have significant depth and medium fan-out.A more detailed description of the above structures is given in Section 4.2.Butterflies are important for benchmarking at least in the following ways. Sincesuch constructs are based on the classification of ETL activities discussed before, theyform a taxonomy as aid for designing or understanding complex ETL workflows. In5
particular, we can use them for constructing more complex ETL workflows in a principle way. For example, if we need a memory intensive workflow, we should considerusing tree or fork flows, which include routers/joins and a significant number of sorting or aggregating operations. If we wish to examine pipelining as well, we may consider extending these flows with line workflows (we need to tune the distribution ofblocking and non-blocking operations in these flows too). In addition, to furtherenrich our workflows, we may also consider having multiple “bodies” in our design,which can represent not necessarily data warehouse tables, but ETL activities as well.Moreover, having in hand such categorization one may decompose existing complex ETL workflows into sets of primitive constructs for getting insight into theirfunctionality. This decomposition can be used for optimization purposes too. We canstudy the behavior of the abovementioned ETL patterns in isolation, and then, we canuse our findings for optimizing and tuning the whole workflow for performance,maintainability or some other quality. For example, the performance of a complexworkflow can be derived from the performance of the component primitive ones.2.4Goals of the BenchmarkThe design of a benchmark should be based upon a clear understanding of the characteristics of the inspected systems that do matter. Therefore, we propose a configuration that covers a broad range of possible workflows (i.e., a large set of configurableparameters) and a limited set of monitored measures.The goal of this benchmark is to provide the experimental testbed to be used for theassessment of ETL engines and design methods concerning their basic behavioralproperties (measures) over a broad range of ETL workflows.This benchmark’s goal is to study and evaluate workflows as a whole. Here, we arenot interested in providing specialized performance measures for very specific tasksin the overall process. We are not interested either, in exhaustively enumerating allthe possible alternatives for specific operations. For example, this benchmark is notintended to facilitate the comparison of alternative methods for duplicate detection ina data set, since it does not take the tuning of all the possible parameters for this taskunder consideration. On the contrary, this benchmark can be used for the assessmentof the integration of such methods in complex ETL workflows, assuming that all thenecessary knobs have been appropriately tuned.There are two modes of operation for ETL workflows: off-line (batch) and active(or continuous or real-time) modes. In the off-line mode, the workflow is executedduring a specific time window (typically at night), when the systems are not servicingtheir end-users. Due to the low load of both the source and warehouse systems, therefreshment of data and any other administrative activities (cleanups, auditing, and soon) are easier to complete. In the active mode, the sources continuously try to sendnew data to the warehouse. This is not necessarily done instantly; rather, small groupsof data are collected and sent to the warehouse for further processing. The two modesdo not differ only on the frequency of the workflow execution, but also on how theworkflow execution affects the load of the systems too.Independently of the mode under which the ETL workflow operates, the two fundamental goals that should be reached are effectiveness and efficiency. Hence, given6
an ETL engine or a specific design method to be assessed over one or more ETLworkflows, these fundamental goals should be evaluated.Effectiveness. Our extensive discussions with ETL practitioners and experts haveverified that in real-life ETL projects performance is not the only objective. On thecontrary, other optimization qualities are of interest as well. We refer to these collectively as QoX [6]. The QoX metric suite is incorporated at all stages of the designprocess, from high-level specifications to implementation. A non-exhaustive list ofmetrics that can be used to guide optimization include: performance, recoverability,reliability, freshness, maintainability, scalability, availability, flexibility, robustness,affordability, consistency, traceability, and auditability. Some metrics are quantitative(e.g., reliability, freshness, cost) while other metrics may be difficult to quantify (e.g.,maintainability, flexibility). Also, there are significant tradeoffs that should be takenunder consideration, since an effort for improving one objective may hurt another one[13]. For example, improving freshness typically hurts recoverability, since considering recovery points on the way to the warehouse may be prohibitive in this case; onthe other hand, having redundancy may be an interesting solution for achieving faulttolerance. Due to space consideration, we do not elaborate on all the abovementionedmeasures (for a more detailed discussion we refer to [13]).However, the main objective is to have data respect both database and businessrules. We believe that the following (non-exhaustive) list of questions should be considered in the creation of an ETL benchmark:Q1. Does the workflow execution reach the maximum possible level of data freshness, completeness, and consistency in the warehouse within the necessary time(or resource) constraints?Q2. Is the workflow execution resilient to occasional failures?Q3. Is the workflow easily maintainable?Freshness. A clear business rule is the need to have data as fresh as possible in thewarehouse. Also, we need all of the source data to be eventually loaded at the warehouse; the update latency depends on the freshness requirements. Nevertheless, thesources and the warehouse must be consistent at least at a certain frequency (e.g., atthe end of a day).Missing changes at the source. Depending on what kind of change detector wehave at the source, it is possible that some changes are lost (e.g., if we have a log sniffer, bulk updates not passing from the log file are lost). Also, in an active warehouse,if the active ETL engine needs to shed some incoming data in order to be able toprocess the rest of the incoming data stream successfully, it is imperative that theseleft-over tuples need to be processed later.Recovery from failures. If some data are lost from the ETL process due to failures,then, we need to synchronize sources and warehouse and compensate the missingdata. Of course, tuples from aborted transactions that have been sent to the warehouse(or they are on their way to it) should be undone.Maintainability. In addition, keeping the ETL workflow maintainable is crucial forthe cost of ETL lifecycle. A number of parameters may affect the maintainability ofthe system. Here, we focus on parameters indicating the cost of handling evolutionevents during the ETL lifecycle. Ideally, a simple ETL design is more maintainable,whereas in a complex one it is more difficult to keep track of a change.7
Efficiency. Efficiency is an important aspect of ETL design. Since typically ETLprocesses should run within strict time windows, performance does matter. In fact,achieving high performance is not only important per se, it can also serve as a meansfor enabling (or achieving) other qualities as well. For example, a typical techniquefor achieving recoverability is to add recovery points to the ETL workflow. However,this technique is time-consuming (usually, the i/o cost of maintaining recovery pointsis significant), so in order to meet the execution time requirements, we need to boostETL performance. Typical questions need to be answered are as follows:Q4. How fast is the workflow executed?Q5. What degree of parallelization is required?Q6. How much pipelining does the workflow use?Q7. What resource overheads does the workflow incur at the source, intermediate(staging), and warehouse sites?Parallelization. The configuration in terms of parallelism plays an important rolefor the performance of an ETL process. In general, there exist two broad categories ofparallel processing: pipelining and partitioning. In pipeline parallelism, the variousactivities are operating simultaneously in a system with more than one processor. Thisscenario performs well for ETL processes that handle a relative small volume of data.For large volumes of data, a different parallelism policy should be devised: the partitioning of the dataset into smaller sets. Then, we use different instances of the ETLprocess for handling each partition of data. In other words, the same activity of anETL process would run simultaneously by several processors, each processing a different partition of data. At the end of the process, the data partitions should be mergedand loaded to the target recordset(s). Frequently, a combination of the two policies isused to achieve maximum performance. Hence, while an activity is processing partitions of data and feeding pipelines, a subsequent activity may start operating on acertain partition before the previous activity had finished.Minimal overheads at the sources and the warehouse. The production systems areunder continuous load due to the large number of OLTP transactions performed simultaneously. The warehouse system supports a large number of readers executingclient applications or decision support queries. In the offline ETL, the overheads incurred are of rather secondary importance, since the contention with such processes ispractically non-existent. Still, in active warehousing, the contention is clear. Minimal overhead of the source systems. It is imperative to impose the minimumadditional workload to the source, in the presence of OLTP transactions. Minimal overhead of the DW system. As the warehouse is populated by loadingprocesses, other processes ask data from it. Then, the desideratum is that thewarehouse operates with the lightest possible footprints for the loading processesas well as the minimum possible delay for incoming tuples and user queries.3.Benchmark ParametersIn this section, we propose a set of configuration parameters along with a set of measures to be monitored in order to assess the fulfillment of the benchmark goals.8
Experimental parameters. The following problem parameters are of particularimportance to the measurement of ETL workflows:P1. the size of the workflow (i.e., the number of nodes contained in the graph),P2. the structure of the workflow (i.e., the variation of the nature of the involvednodes and their interconnection as the workflow graph),P3. the size of input data originating from the sources,P4. the workflow selectivity, based on the selectivities of the workflow activities,P5. the values of probabilities of failure,P6. the latency of updates at the warehouse (i.e., it captures freshness requirements),P7. the required completion time (i.e., this reflects the maximum tolerated executiontime window),P8. the system resources (e.g., memory and processing power), andP9. the “ETL workload” that determines an execution order for ETL workflows andthe number of instances of the workflows that should run concurrently (e.g., forevaluating parallelization in an ETL engine, one may want to run first a complexETL workload composed of a high number of line workflows that should run inparallel, and then, a smaller set of tree workflows for merging the former ones).Measured Effects. For each set of experimental measurement, certain measuresneed to be assessed, in order to characterize the fulfillment of the aforementionedgoals. In the sequel, we classify these measures according to the assessment questionthey are employed to answer.Q1. Measures for data freshness and data consistency. The objective is to have datarespect both database and business rules. Also, we need data to be consistent withrespect to the source as much as possible. The latter possibly incurs a certain timewindow for achieving this goal (e.g., once a day), in order to accommodate high refresh rates in the case of active data warehouses or failures in the general case. Concrete measures are: (M1.1) Percentage of data that violate business rules. (M1.2) Percentage of data that should be present at their appropriate warehousetargets, but they are not.Q2. Measures for the resilience to failures. The main idea is to perform a set ofworkflow executions that are intentionally abnormally interrupted at different stagesof their execution. The objective is to discover how many of these workflows weresuccessfully compensated within the specified time constraints. For achieving resilience to failures, we consider two strategies or quality objectives: recoverability andredundancy. For the former, the most typical technique is to enrich the ETL processwith recovery points (used for intermediate staging of data processed up to that point),so that after a failure the process may resume from the latest recovery point. However, where to put such points is not a straightforward task. Redundancy can beachieved with three techniques: replication, diversity or fail-over. For lack of space,here we refer only to replication, which involves multiple instances of the sameprocess (or of a part of it) that run in parallel. Concrete measures are: (M2.1) Percentage of successfully resumed workflow executions. (M2.2) MTBF, the mean time between failures.9
(M2.3) MTTR, mean time to repair. (M2.4) Number of recovery points used. (M2.5) Resumption type: synchronous or asynchronous. (M2.6) Number of replicated processes (for replic
for capturing the generic functionality of ETL tools (Section 3). Finally, we provide specific ETL scenarios based on the aforementioned analysis, which can be used as an experimental testbed for the evaluation of ETL design methods or tools (Section 4). 2. Problem Formulation In this section, we introduce ETL workflows as graphs. Then, we zoom .