Transcription
September 4, 2009.Report 1:Comparison of cellular changes upon exposure toallergens between ROBOCAT II versus FACSCalibur-based methods.Report#:Work Order#:47 76 2009040220090402Report for:Roger DeutschPresident, CEO.ALCAT Laboratory, Division of Cell Science Systems852 South Military TrailDeerfield Beach, FL 33442954-426-23049544288676 (FAX)r.deutsch@yahoo.comPerformed:May – August 2009Kimberlee A. RedmanAnalystReviewed by:Kathleen F. Benson Ph.D.AnalystGitte Jensen Ph.D.Date: September 4, 20091437 Esplanade Ave, Klamath Falls, OR 97601 Telephone (541) 884-0112E-mail: tech@nislabs.com Web Site: www.nislabs.com
NIS Labs Inc.ALCAT Laboratory - Report 12 of 53Report 1: Comparison of cellular changes upon exposure to allergensbetween ROBOCAT II versus FACSCalibur-based methods.PurposeThe purpose of this study was to evaluate data generated by the ROBOCAT II (ALCATLaboratory), by comparison to another particle counter, the FACSCalibur (BectonDickinson), which in addition to particle size also measures 4 other parameters for eachparticle. The FACSCalibur multi-parameter analysis allows evaluation of cellular changesin different subsets based on size, and allows functional correlations to be made, such aschanges in de-granulation, ROS production, cellular viability/death, and changes inexpression levels of antigens on the cell surface.BackgroundROBOCAT II is a machine that tests food-related allergens via a whole blood culture thathas been exposed to individual allergens coated in a microtiter plate. Results are analyzedby looking at the size dimensions of a particular cell that is currently being examined.Whether a cell is swelling, shrinking or becoming oddly shaped these configurations willcorrelate to a cellular state of stress. The physical changes lead the analyzer to interpretthat the blood cells were reacting to a given allergen.Performed workAll testing of individual donors was carried out in parallel. Experimental samples weretested both by the ROBOCAT II and FACSCalibur to evaluate similarities of results aswell as cells examined by CytoViva microscopy.LogisticsThe ROBOCAT II machine has been installed at NIS Labs and allergy testing hascommenced. Previously we have screened 4 individuals with the ALCATa antigen panelthat contains a total of 50 antigens. During the setup of the ROBOCAT II machine, initialantigen testing was performed on 1 individual and, in parallel, cells from this sameindividual were exposed to the ALCAT antigen panel and analyzed by flow cytometry.These initial experiments allowed us to identify some immediate questions that needed tobe answered in order to move forward with our goal of processing identical samples on the2 different machines without introducing any changes. The challenge comes fromdifferences between how the 2 machines process samples.Following incubation of blood with the antigen panel, the ROBOCAT II machine lyses redblood cells in samples one well at a time and immediately collects electrical impedencedata after a 20-second lysis. Red blood cells are much more sensitive to lysis than whiteblood cells but it is necessary that data collection occur rapidly to prevent adverse effectson white blood cells with longer incubation in lysis reagent. The volume of lysis reagentused is 2.5 ml.1437 Esplanade Ave, Klamath Falls, OR 97601 Telephone (541) 884-0112E-mail: tech@nislabs.com Web Site: www.nislabs.com
NIS Labs Inc.ALCAT Laboratory - Report 13 of 53In order to analyze whole blood samples on the FACSCalibur flow cytometer, samplesfirst needed to be transferred to a FACS tube following lysis and data collected. Theamount of pressure applied to the sample may be higher in the FACSCalibur machine.This increased pressure could induce cellular changes in shape, size or reactivity andeffectively alter the sample that is being analyzed when compared to the readout from theROBOCAT II.What we learned from initial exploratory work: Cells cannot stay in lysis buffer for very long without adverse effects. Oncesamples were on the FACSCalibur, ongoing and cumulative changes in cellcharacteristics were witnessed, starting after 10 seconds of data collection, andcontinued throughout the period of data acquisition. Diluting samples with 2.5 ml of lysis buffer reduces the number of events that canbe collected on the FACSCalbur per second; however, a couple thousand eventscould be acquired in the first 10 seconds. If particle concentration was higher permicroliter, data acquisition on the FACSCalibur could happen within 10 seconds. Processing of samples by FACSCalibur takes longer than sample processing by theROBOCAT II. Blood samples to be analyzed by flow cytometry may have to beexposed to only part of the allergen panel at a time (i.e. perform a staggered start ofreaction in the parallel plate to be assayed by FACSCalibur). Some agitation is necessary to ensure contact between cells and antigens in the testwells. However, the agitation initially used had a negative effect, setting offreactions in almost all wells, including the negative control wells. Reducing theintensity of agitation has helped to produce more consistent data.Further exploration and analysis in this report:Primary goal:machines.To achieve parallel patterns of particle size distribution on bothThis was essential to achieve before proceeding with either validation of the allergy test orproceeding with new methods development on lymphocyte proliferation and nutritionalstatus.Note: The results presented in this report reflect further work based upon initialhands-on pilot work and continued communications between ALCAT and NIS Labs,and feedback from Dr. Holger Fehr. Experiments were carried out on purified white blood cells. Whole blood from anormal donor was separated on a Histopaque gradient and plasma stored at 4oC.White blood cell fractions were processed through three phosphate buffered saline(PBS) washes and then reconstituted in 10% plasma in PBS. Purification of whiteblood cells avoided the need to lyse RBC prior to collection of electrical impedencedata by ROBOCAT II and prior to analysis on the FACSCalibur. The ROBOCATII was run with rinse buffer instead of Alcalyse solution.1437 Esplanade Ave, Klamath Falls, OR 97601 Telephone (541) 884-0112E-mail: tech@nislabs.com Web Site: www.nislabs.com
NIS Labs Inc.ALCAT Laboratory - Report 14 of 53o We looked at ROBOCAT II results from both a combination of PBMC andPMN cells as well as either PBMC or PMN cells alone. From this analysiswe decided that changes within separate populations of cells (PBMC orPMN cells) were easier to identify when looking at pure populations of cellsrather than a mixture of PBMC and PMN cells.o We determined the concentration of each cell type to use in order togenerate robust peaks on the ROBOCAT II machine as well as providesample for FACSCalibur flow cytometry and CytoViva microscopyanalyses. This concentration was 2 x 10⁶ cells/ml for PBMC and 3 x 10⁶/mlfor PMN cells. Similar to the ALCAT whole blood set up, 100 ul of cellswere added per well. ROBOCAT II, FACSCalibur and CytoViva analyseswere performed on sample from the same well in parallel. Comparisons between ROBOCAT II and FACSCalibur were first performed withnormal blood samples that were not exposed to ALCAT antigen cassettes. Findinga donor that gives a repeated, uniform response to exposure of blood to a specificantigen could be difficult and reactivity may vary between blood samples drawn ondifferent days. Instead, normal purified white blood cells were exposed to differentdoses of the bacterial peptide f-MLP, a classical PMN activation stimuli that triggerROS formation and degranulation. This allowed us to obtain reproducible andconcentration-dependent neutrophil activation and the resulting cellular changeswere analyzed simultaneously by both ROBOCAT II and FACSCalibur. o An increase in PMN cell size was detected by both ROBOCAT II andFACSCalibur. The decision to fix or not to fix cells for analysis by flow cytometry wasdetermined empirically. Unfixed and fixed samples were run side by side and datacompared.o We determined that fixing of cells results in cell shrinkage, making it harderto distinguish changes in size of cells resulting from exposure to antigens.All data in this report was generated from cells that were unfixed. All samples analyzed by ROCOCAT II and FACSCalibur were also examined byCytoViva microscopy.o Interesting cellular changes were observed on an individual cell basis thatcould not be obtained by either ROBOCAT II or FACSCalibur analyses.While cells responded similarly to individual treatments (specific antigen),very detailed changes could be seen in the microscope that included theflattening of cells, increases/decreases in size, rapid movement of granuleswithin PMN cells, expulsion of granules from PMN cells and alsoadherence properties of cells that were reflected in the number of cellsvisible in a microscopy field. When it was hard to find cells on the slide,this indicated that cells had most likely either disintegrated or adhered to the1437 Esplanade Ave, Klamath Falls, OR 97601 Telephone (541) 884-0112E-mail: tech@nislabs.com Web Site: www.nislabs.com
NIS Labs Inc.ALCAT Laboratory - Report 15 of 53ALCATa plate or the plastic tube that was used to store the cells prior to thepreparation of slides for microscopy.Outline of the performed work: Prepared purified white blood cells that had not been exposed to antigen.o Ran cells on both ROBOCAT II and FACSCalibur to compare size profiles.o Ran both a mixture as well as the PMN and PBMC cell fractions separatelyon ROBOCAT II to familiarize ourselves to their different size profiles onthis machine.o Compared the profile of white blood cells in the starting sample (wholeblood) to the purified white blood cells on both the ROBOCAT II andFACSCalibur.These initial tests allowed us to detect any possible adverse effects on white bloodcells due to the purification method and begin to develop an understanding of howto compare data between the two machines. Treated purified white blood cells with serial dilutions of f-MLP.o Analyzed samples on ROBOCAT II and FACSCalibur.o Tested effects of fixation on the cellular characteristics (forward scatter andside scatter) obtained from analysis of cells on FACSCalibur.1437 Esplanade Ave, Klamath Falls, OR 97601 Telephone (541) 884-0112E-mail: tech@nislabs.com Web Site: www.nislabs.com
NIS Labs Inc.ALCAT Laboratory - Report 16 of 53Secondary goal: To validate cellular changes in the allergy panel by flow cytometry.We previously identified 3 people with some known food sensitivities. These 3individuals went through a second set of blood draws and testing, where a detailedcomparison between the ROBOCAT II and FACSCalibur was performed in parallel.Testing used purified white blood cells, reconstituted in autologous plasma, and thenapplied to allergen plates.In brief: Allergen plate testing was performed on 3 blood donors, each on a separate day.On each test day 20 ml of whole blood was drawn from a single donor into 4heparinized blood collection vials. 5 ml of whole blood was added to 20 ml ofALCAT diluent and the remaining 15 ml of whole blood separated on a histopaquegradient to isolate PBMC and PMN cell fractions. The serum was stored at 4oC forlater reconstitution of PBMC and PMN cells in 10% serum. PBMC and PMN cellswere washed 3 times with PBS and stored in phosphate buffered saline until furtheruse. A 15 well whole blood control plate was then run to ascertain proper functioning ofthe ROBOCAT II machine. Next, whole blood in diluent from the donor wasadded to a 55-well ALCATa antigen plate and following a total of 45 minutes ofincubation with gentle agitation (15 min. initially at 37oC followed by 30 min. atroom temperature) the plate was loaded onto the ROBOCAT II machine and datacollected. Analysis of the antigen testing of whole blood was then used to determine whichantigen wells to expose the purified PBMC or PMN cells to for the more involvedcomparison between the ROBOCAT II and FACSCalibur machines. Four to fiveof the most positive results from the whole blood testing of the entire ALCATaantigen plate were then chosen as antigens for further analysis of PBMC and PMNcells. Separate ALCATa antigen plates were processed for PBMC and PMN cells. Following incubation of 100 ul of either PBMC or PMN cells per well in 10%serum at 2 x 10⁶ cells/ml and 3 x 10⁶/ml, respectively, aliquots of cells wereremoved to either FACS tubes for collection of flow cytometry data or topolypropylene tubes for preparation of microscope slides and microscopy on theCytoViva microscope. For each donor, we did detailed comparison between ROBOCAT II data and FACSdata for a) 3 test wells without allergens (negative controls), and b) the 4 to 5 testwells for each person that showed the most positive results (i.e. the most indicativeof an allergic reaction).1437 Esplanade Ave, Klamath Falls, OR 97601 Telephone (541) 884-0112E-mail: tech@nislabs.com Web Site: www.nislabs.com
NIS Labs Inc.ALCAT Laboratory - Report 17 of 53We initially focused on the following 2 parameters:1. Particle size: Evaluate the correlation of ROBOCAT II measurement of thedistribution of particle sizes to FACSCalibur’s forward scatter measurements,which are also equated to particle sizes.2. Degranulation: Perform cell subset analysis using the FACSCalibur’s ability tomeasure cellular granularity, to evaluate degranulation of granulocytes.Methodological details for Protocol 1:1: Particle size.Cellular size distribution can be correlated to cell viability and function. Apoptoticcharacteristics comprise a series of biochemical events that lead to cell morphologychanges and death. Apoptotic morphological changes consist of cell shrinkage andblebbing (expulsion of smaller particles from the core cellular body). Necrosis is a sudden,unnatural process, and is an irreversible cell death in which the cell will swell beforedisintegrating.As part of this protocol, a detailed comparison between the ROBOCAT II particle sizedistribution and the FACSCalibur measurements was performed. Parallel test wells whereno changes were seen, versus wells where the ROBOCAT II was measuring changes inparticle size, were compared.Initial work was done with white blood cells that had not been exposed to antigen but thatwere treated with the bacterial peptide f-MLP. This treatment results in reproducibleactivation of neutrophils that is dose-dependent. The resultant cellular alterations thatincluded size change were measured by both ROBOCAT II and FACSCalibur.2: Degranulation.When an allergic response is triggered in a test well, and measured by ROBOCAT II, evenminute cellular size changes may represent major functional changes. For example, thegranulocytes may de-granulate during formation of Reactive Oxygen Species (ROS). Thismay only result in a minor change in cell size, but will show up clearly on the side scattermeasurements on the FACSCalibur machine, where side scatter is a result of cellulargranularity. A detailed comparison of ROBOCAT II and FACSCalibur data will helpevaluate this, and look for patterns, such as evaluate whether all test wells that scorepositive by ROBOCAT II analysis, will also always show de-granulation by FACS.A positive control for this process is treatment of PMN cells with f-MLP. We investigatedthis in our preliminary experiments in order to work out conditions for sample preparationand how best to document and compare data from the two machines.Standard “PeakFlow” 6 micrometer beads were used as controls to ensure consistentmachine performance between runs.1437 Esplanade Ave, Klamath Falls, OR 97601 Telephone (541) 884-0112E-mail: tech@nislabs.com Web Site: www.nislabs.com
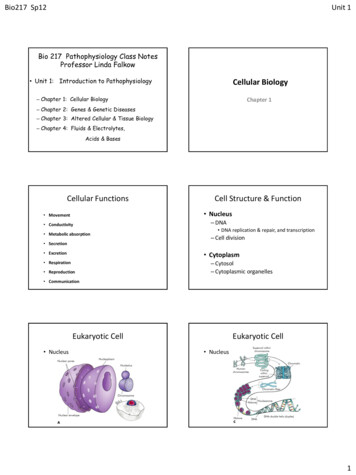
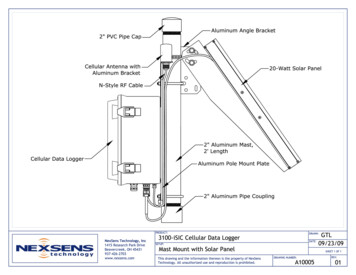
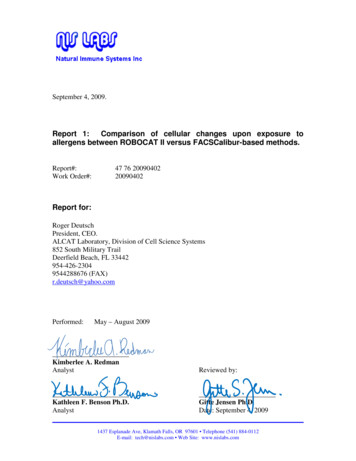
NIS Labs Inc.ALCAT Laboratory - Report 18 of 53Results1a. Comparison of cell profiles between ROBOCAT II and FACSCaliburROBOCAT IIIn the figure below, a comparison is made between ROBOCAT II data generated fromuntreated (no antigen) whole blood, PBMC and PMN cells from donor 1 (D1). Since PMNcells make up about 70% of white blood cells in whole blood, this is the major peak thatcan be seen in the whole blood sample (dark blue line in figure below). The overlay ofPBMC and PMN cells on top of the whole blood ROBOCAT II data shows that separationof white blood cell fractions on the histopaque gradient did not affect the overall PBMC orPMN cell profiles. The appearance of a small peak of PMN cells that is slightly smaller insize than the PBMC peak indicates that approximately 10% of the PMN cells showedshrinkage, likely due to handling and centrifugation involved in the isolation process.D1 Robocat IIWBPMNPBMC2502001501005001511011512012511437 Esplanade Ave, Klamath Falls, OR 97601 Telephone (541) 884-0112E-mail: tech@nislabs.com Web Site: www.nislabs.com
NIS Labs Inc.ALCAT Laboratory - Report 19 of 53FACSCalibur flow cytometryDefinition of TerminologyFSC forward scatter cell sizeSSC side scatter granularityThe figure below shows results of whole blood run on the FACSCalibur machine. It isclear that individual populations of cells cannot be identified in whole blood.A very different picture emerges when separate PBMC and PMN cell fractions areanalyzed (see following two figures).1437 Esplanade Ave, Klamath Falls, OR 97601 Telephone (541) 884-0112E-mail: tech@nislabs.com Web Site: www.nislabs.com
NIS Labs Inc.ALCAT Laboratory - Report 110 of 53In the figure below, the FSC/SSC plot of PBMCs is shown. The circled areas indicatediscrete populations of cells. The black circle indicates the smallest types of particles thatinclude debris, dead cells and cell fragments as well as red blood cells. The blue circleindicates the region on the graph where apoptotic cells are. The red circle indicates thelymphocyte population of cells that includes B and T lymphocytes, natural killer cells andstem cells. The green circle indicates the monocyte population. There is some overlapbetween the different populations. The circles illustrate the complexity that can berevealed when a second dimension (granularity) is combined with size analysis (FSC).The red arrow is an example of a typical shift in lymphocytes that occurs whenlymphocytes become apoptotic. Cells originating from the lymphocyte population (redcircle) become smaller and more granular due to membrane blebbing and other cellularchanges (which is seen by the flow cytometer as an increase in SSC) and now are found inthe area of the blue circle. The first sample in appendix A demonstrates this phenomenonfollowing exposure of PBMC from donor 1 to the barley antigen.Peripheral Blood Mononuclear Cells (PBMC)1437 Esplanade Ave, Klamath Falls, OR 97601 Telephone (541) 884-0112E-mail: tech@nislabs.com Web Site: www.nislabs.com
NIS Labs Inc.ALCAT Laboratory - Report 111 of 53In the figure below, the FSC/SSC plot of PMN cells is shown. PMN cells are aheterogeneous population of cells and this is reflected in the complex FSC/SSC patterngenerated from the wide range of “states” of PMN cells. PMN cells are very reactive cellsthat contain large numbers of granules and have a propensity to degranulate and also altertheir size based on adherence and activity (for example ROS generation).It can be seen that the cells in the red circle that contain granules (high SSC) are also thelargest cells. Cells in the black circle have degranulated (low SSC) and are also decreasedin size. However, on a single-parameter histogram on particle size, the two populations arehighly overlapping.Polymorphonuclear (PMN) cellsConclusions: PBMC and PMN cell profiles on ROBOCAT II are similar to results obtained withwhole blood. The separate analysis of PBMC and PMN cells on FACSCalibur allows individualpopulations of cells to be identified and changes in size analyzed.1437 Esplanade Ave, Klamath Falls, OR 97601 Telephone (541) 884-0112E-mail: tech@nislabs.com Web Site: www.nislabs.com
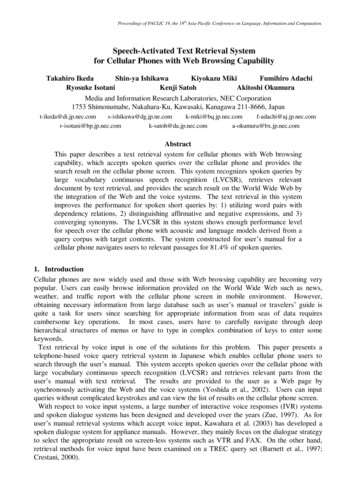
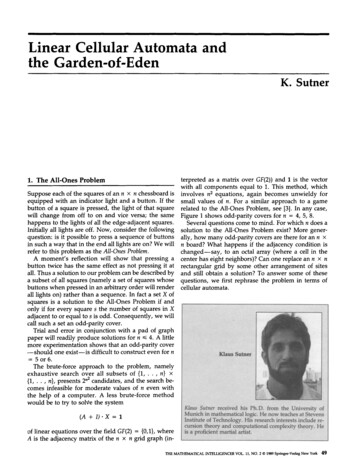
NIS Labs Inc.ALCAT Laboratory - Report 112 of 531b. Treatment of PBMC and PMN cells with f-MLP.ROBOCAT II results of PBMC and PMN cells treated with the bacterial peptide f-MetLeu-Phe (f-MLP) to trigger antibacterial defense behavior among monocytes (in thePBMC population) and PMN cells.For PBMC, we could expect to see some changes in the monocyte population (right handpeak). However, no major changes were seen.For PMN cells, we would expect f-MLP to induce changes. In the second figure below,treatment of PMN cells with f-MLP shows a clear increase in cell size of the right handpeak. An increase in number of particles in the left hand peak can also be seen. Thisindicates that both swelling and degranulation was happening.PBMC Robocat 71541711882052222392560PMN Cells Robocat 715417118820522223925601437 Esplanade Ave, Klamath Falls, OR 97601 Telephone (541) 884-0112E-mail: tech@nislabs.com Web Site: www.nislabs.com
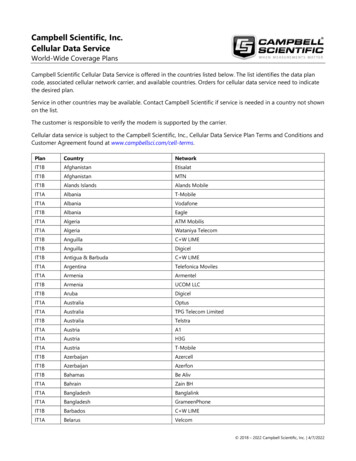
NIS Labs Inc.ALCAT Laboratory - Report 113 of 53FACSCalibur results of PMN cells treated with f-MLP. A shift is seen towards increasedFSC by cells from the high SSC population. This shift is illustrated by the red circlesbelow, where cells originating in the circle in the first figure follow the arrow into thecircle in the second figure after exposure to f-MLP. A shift is also seen in a differentsubpopulation of PMN cells indicated by a black circle in the figure below. These figuresare dot plots that use color to indicate the density of cells (red being the most dense).Following treatment of PMN cells with f-MLP there is an increase in PMN cells in thisarea of the figure.PMN cells alonePMN cells with f-MLP1437 Esplanade Ave, Klamath Falls, OR 97601 Telephone (541) 884-0112E-mail: tech@nislabs.com Web Site: www.nislabs.com
NIS Labs Inc.ALCAT Laboratory - Report 114 of 53Conclusions: Treatment of PBMC with f-MLP did not result in any major changes in cell size. Treatment of PMN cells with f-MLP resulted in an increase in cell size that isdetected by both ROBOCAT II and FACSCalibur. This increase in PMN cell size following exposure to f-MLP can clearly be seen ina subset of PMN cells when analyzed by flow cytometry. The high SSC populationobserved in the FSC/SSC figures above contain cells that contribute to the 2nd(larger) peak seen by ROBOCAT II.2. Exposure of PBMC and PMN cells from 3 donors to ALCATa antigens and comparisonbetween ROBOCAT II and FACSCalibur data.Results from the comparison of ROBOCAT II and FACSCalibur data from PBMC orPMN cells exposed to antigens is summarized in the table on the following page.The raw data for each donor and results of antigen exposure follow at the end of this reportin Appendix A. CytoViva microscopy photographs follow in Appendix B.Please refer to overview table on the following page.1437 Esplanade Ave, Klamath Falls, OR 97601 Telephone (541) 884-0112E-mail: tech@nislabs.com Web Site: www.nislabs.com
NIS Labs Inc.ROBOCAT IIPBMCTABLE 1Donor123ALCAT Laboratory - Report 115 of 53Peak2PH174172140 FACSCaliburPBMCMonocytePopulationFSC PP178.54178.66179.91 PMNHigh SSC Low SSCFSCFSCPPPP91.2373.3492.7173.33100.44 73.2185 181.77 81.82 Control B0Control C0BarleyPP575756PH162194210 Peak1PP503851Fructose56209 38PMNPeak Peak12PHPP729845101108100 41 96GliadinLambString bean565657223 208 202 5143476043 599898108 144 151 113 179.09 182.05 183.72 86.8 72.9489.37 73.13104.18 71.12Control B0Control C0Apple565655155141139 383838343846 103101105 195229162 161.81161.16163.15 104.769.9101.3269.77129.07 69.68Broccoli58138 3844 106 96 172.61 136.94 68.76Chicken581413825 107 75 169 129.25 69.46Lettuce561433828 10377 169 134.06 69.57Pear55115 3827 107 96 162.94126.73 69.81String bean57105 3830 107 84 176.52 139.44 68.93-Control B0Control C0Baker’syeastShrimp595759100103105 ******737580 693697696154.4153.97165.84 78.6280.7290.68 66.6766.666.3 5777 **75697163.04 90.75 66.29Strawberry5970 **76 689169.08 96.82 66.2- - Turkey62 112 **78 699165.05 94.75 66.18 Antigen73.48PP Peak Position; PH Peak HeightThe “ ” indicates this value was higher than the control and the “ ” indicates this valuewas lower than the control.Looking for correlations: The two far right columns indicate whether there was acorrelation between the two machines for PBMC (A) and PMN cell (B) data. A green “ ”indicates correlation and a black “-” indicates that different results were obtained by thetwo machines.* Note: For Donor 3, the presence of red blood cells in the PMN fraction resulted inobscuring the lower PMN peak (Peak 1). The presence of red blood cells is also reflectedin the large Peak Height of PMN Peak 2.1437 Esplanade Ave, Klamath Falls, OR 97601 Telephone (541) 884-0112E-mail: tech@nislabs.com Web Site: www.nislabs.comCorrAB - -
NIS Labs Inc.ALCAT Laboratory - Report 116 of 53ConclusionsROBOCAT II data: PBMC peak height varies more than peak position, following exposure to allergen. For donors 1 and 2, two PMN cell peaks can be seen by ROBOCAT II. Thesepeaks vary more in peak height than peak position following exposure to allergen.FACSCalibur data: Monocytes within the PBMC is a cell population that is easy to identify on aFSC/SSC plot from FACSCalibur. Gating on these cells and determining changesin the mean FSC (size) showed increases in cell size (FSC) following exposure toallergen. PMN cells can be separated into different populations based on side scatter (SSC),a measure of granularity. The mean FSC of the high SSC PMN cells showincreases for donors 2 and 3 following exposure to allergens and show bothincreases (barley, string bean) and decreases (fructose, gliadin, lamb) for donor 1. Very little change in FSC is seen for low SSC PMN cells following exposure toallergens. This probably reflects the diversity of this large population of PMNcells. Some cells in this population may be increasing in FSC while others aredecreasing, resulting in a mean FSC that is unchanged.Comparison between ROBOCAT II and FACSCalibur data: Since PMN cells make up the majority of white blood cells present in whole blood,PMN analysis on ROBOCAT II more closely approximates what is seen withwhole blood antigen testing than PBMC analysis. Donor specific differences were seen. This is well illustrated by donor 3 wherePBMC show 2 peaks by FACSCalibur analysis and only one by ROBOCAT II.Also, PMN cells from donor 3 produced a single large peak on the ROBOCAT IIwhile PMN cells from donors 1 and 2 produced 2 peaks. FACSCalibur analysis gives a more complex picture of the effect of allergenexposure of PBMC and PMN cells and allows changes in size to be assessed onspecific cell subpopulations. Overall, there was good correlation between changes in size detected byROBOCAT II following antigen exposure and changes detected by FACSCalibur.When differences did occur, they point to the complexity of cellular changesoccurring within different sub-populations of cells that cannot always be teased outwhen assessing the overall change in size of all cells analyzed as a single group.1437 Esplanade Ave, Klamath Falls, OR 97601 Telephone (541) 884-0112E-mail: tech@nislabs.com Web Site: www.nislabs.com
NIS Labs Inc.ALCAT Laboratory - Report 117 of 53Overall accomplishmentsThe main objective of this initial phase of the study was to be able to control samplehandling to allow the best correlation between ROBOCAT II and flow cytometry. Thishad to be controlled before we can continue more complex testing of cell phenotype,viability/death, ROS formation, and other functions. Initial work focused on determiningif the same changes in particle size when cells react with f-MLP showed similaritiesbetween ROBOCAT II and FACSCalibur.The strength of ROBOCAT II and FACSCalibur analysis is the ability to look at largenumbers of cells and to quantify results. This ability is taken further with theFACSCalibur because the addition of the parameter of side scatter (granularity) along withsize allows the differentiation of distinct populations of cells that can be separatelyanalyzed for changes in size following exposure to antigens.Analysis of antigen exposed samples with CytoViva microscopy yielded additionalinformation that was not possible to get from either the ROBOCAT II or FACSCaliburmachines. The strength of the CytoViva data is a detailed picture of cellular changes on aper cell basis. Changes in cell size, shape and cellular contents (ex. very active granulesvs. loss of granules) can visibly be seen. See also Appendix B at the end of this report.Future workNow that a direct comparison between particle measurements by ROBOCAT II and FACShas been completed, we are ready to engage in further study, including more complexmeasurements and comparisons, including ROS formation and cell viability/death, withparticular attention on oxidative burst and apoptosis.In parallel, we will initiate discussions and protocol development for how to establishmethods for long-term blood cultures and testing of nutrients and supplements.The testing and optimization of long-term cultures will involve testing of cell proliferation,expression of activation antigens, as well as detailed measure of different types of celldeath, in the absence versus presence of various nutrients and immune supportive naturalproducts.1437 Esplanade Ave, Klamath Falls, OR 97601 Telephone (541) 884-0112E-mail: tech@nislabs.com Web Site: www.nislabs.com
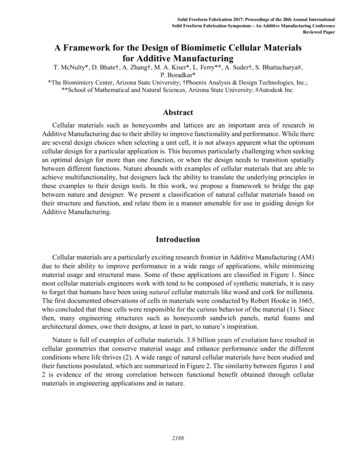
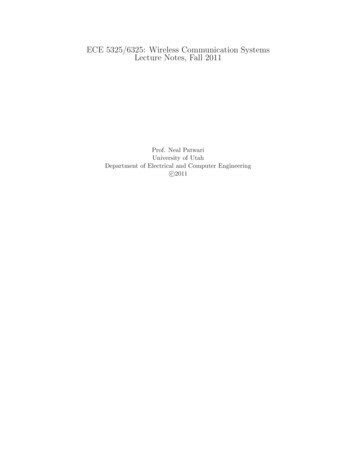
NIS Labs Inc.ALCAT Laboratory - Report 118 of 53Appendix ADonor 1 PBMCBarleyFACSCalibur dataD1 PBMC Robocat IIB0: CON2C0: CON3A2: Barley2502001501005001511011511437 Esplanade Ave, Klamath Falls, OR 97601 Telephone (541) 884-0112E-mail: tech@nislabs.com Web Site: www.nislabs.com201251
NIS Labs Inc.ALCAT Laboratory - Report 119 of 53Donor 1 PMNBarleyFACSCaliburD1 PMN Roboca
In order to analyze whole blood samples on the FACSCalibur flow cytometer, samples first needed to be transferred to a FACS tube following lysis and data collected. The amount of pressure applied to the sample may be higher in the FACSCalibur machine. This increased pressure could induce cellular changes in shape, size or reactivity and