Transcription
ECE 5325/6325: Wireless Communication SystemsLecture Notes, Fall 2011Prof. Neal PatwariUniversity of UtahDepartment of Electrical and Computer Engineeringc 2011
ECE 5325/6325 Fall 20112Contents1 Cellular Systems Intro1.1 Generation Zero . . . . . . . . . . . . . . . . . . . . . . . . . . . . . . . . . . . . . .1.2 Cellular . . . . . . . . . . . . . . . . . . . . . . . . . . . . . . . . . . . . . . . . . . .1.3 Key Terms . . . . . . . . . . . . . . . . . . . . . . . . . . . . . . . . . . . . . . . . .2 Frequency Reuse2.1 Transmit Power Limits . . . . . . . . . . .2.2 Cellular Geometry . . . . . . . . . . . . .2.2.1 Channel Assignment within Group2.3 Large-scale Path Loss . . . . . . . . . . .2.4 Co-Channel Interference . . . . . . . . . .2.4.1 Downtilt . . . . . . . . . . . . . . .2.5 Handoff . . . . . . . . . . . . . . . . . . .2.6 Review from Lecture 2 . . . . . . . . . . .2.7 Adjacent Channel Interference . . . . . .6677.999101112131415153 Trunking3.1 Blocked calls cleared . . . . . . . . . . . . . . . . . . . . . . . . . . . . . . . . . . . .3.2 Blocked calls delayed . . . . . . . . . . . . . . . . . . . . . . . . . . . . . . . . . . . .3.3 Discussion . . . . . . . . . . . . . . . . . . . . . . . . . . . . . . . . . . . . . . . . . .161717184 Increasing Capacity and4.1 Sectoring . . . . . . .4.1.1 Determining i04.1.2 Example . . . .4.2 Microcells . . . . . . .4.3 Repeaters . . . . . . .4.4 Discussion . . . . . . .181820202021215 Free Space Propagation5.1 Received Power Reference . . . . . . . . . . . . . . . . . . . . . . . . . . . . . . . . .5.2 Antennas . . . . . . . . . . . . . . . . . . . . . . . . . . . . . . . . . . . . . . . . . .5.3 Power Flux Density . . . . . . . . . . . . . . . . . . . . . . . . . . . . . . . . . . . .22222323Coverage. . . . . . . . . . . . . . . . . . . . . . . . . . . . . . . . . . . . .6 Large Scale Path Loss Models246.1 Log Distance Path Loss . . . . . . . . . . . . . . . . . . . . . . . . . . . . . . . . . . 246.2 Multiple Breakpoint Model . . . . . . . . . . . . . . . . . . . . . . . . . . . . . . . . 267 Reflection and Transmission268 Two-Ray (Ground Reflection) Model288.1 Direct Path . . . . . . . . . . . . . . . . . . . . . . . . . . . . . . . . . . . . . . . . . 298.2 Reflected Path . . . . . . . . . . . . . . . . . . . . . . . . . . . . . . . . . . . . . . . 298.3 Total Two-Ray E-Field . . . . . . . . . . . . . . . . . . . . . . . . . . . . . . . . . . . 29
ECE 5325/6325 Fall 201139 Indoor and Site-specific Large Scale Path Loss Models309.1 Attenuation Factor Models . . . . . . . . . . . . . . . . . . . . . . . . . . . . . . . . 309.2 Ray-tracing models . . . . . . . . . . . . . . . . . . . . . . . . . . . . . . . . . . . . . 3110 Link Budgeting3210.1 Link Budget Procedure . . . . . . . . . . . . . . . . . . . . . . . . . . . . . . . . . . 3210.2 Thermal noise . . . . . . . . . . . . . . . . . . . . . . . . . . . . . . . . . . . . . . . . 3310.3 Examples . . . . . . . . . . . . . . . . . . . . . . . . . . . . . . . . . . . . . . . . . . 3411 Diffraction3512 Rough Surface Scattering3613 Multipath Fading13.1 Multipath . . . . . . . . . .13.2 Temporal . . . . . . . . . .13.3 Channel Impulse Response .13.4 Received Power . . . . . . .13.5 Time Dispersion Parameters13.6 Review from Lecture 9 . . .37383939404141.14 Fade Distribution4114.1 Rayleigh Fading . . . . . . . . . . . . . . . . . . . . . . . . . . . . . . . . . . . . . . . 4214.2 Ricean fading . . . . . . . . . . . . . . . . . . . . . . . . . . . . . . . . . . . . . . . . 4315 Doppler Fading4315.1 One Component . . . . . . . . . . . . . . . . . . . . . . . . . . . . . . . . . . . . . . 4515.2 Many Components . . . . . . . . . . . . . . . . . . . . . . . . . . . . . . . . . . . . . 4615.3 System Design Implications . . . . . . . . . . . . . . . . . . . . . . . . . . . . . . . . 4616 Digital Communications: Overview16.1 Orthogonal Waveforms . . . . . . . . . .16.2 Linear Combinations . . . . . . . . . . .16.3 Using M Different Linear Combinations16.4 Reception . . . . . . . . . . . . . . . . .16.5 How to Choose a Modulation . . . . . .16.6 Intersymbol Interference and Bandwidth17 Modulation17.1 PAM . . . . . . . . . . . . . .17.2 M-ary QAM and PSK . . . .17.3 FSK . . . . . . . . . . . . . .17.4 MSK . . . . . . . . . . . . . .17.5 Receiver Complexity Options18 Fidelity.47474949495051.52525353545454
ECE 5325/6325 Fall 2011419 Link Budgets with Digital Modulation5519.1 Shannon-Hartley Channel Capacity . . . . . . . . . . . . . . . . . . . . . . . . . . . . 5619.2 Examples . . . . . . . . . . . . . . . . . . . . . . . . . . . . . . . . . . . . . . . . . . 5719.3 Q-Function and Inverse . . . . . . . . . . . . . . . . . . . . . . . . . . . . . . . . . . 5820 Implementation Costs20.1 Power Amplifiers and Constant Envelope20.1.1 Offset QPSK . . . . . . . . . . . .20.1.2 Other Modulations . . . . . . . . .20.2 Synchronization . . . . . . . . . . . . . . .20.2.1 Energy Detection of FSK . . . . .20.2.2 Differential PSK . . . . . . . . . .6060616263636421 Multi-carrier Modulation21.1 OFDM . . . . . . . . . . . . . . . . . . . .21.1.1 Orthogonal Waveforms . . . . . . .21.1.2 Fourier Transform Implementation21.1.3 Cyclic Prefix . . . . . . . . . . . .21.1.4 Problems with OFDM . . . . . . .21.1.5 Examples . . . . . . . . . . . . . .6566666768686822 Forward Error Correction Coding6922.1 Block vs. Convolutional Coding . . . . . . . . . . . . . . . . . . . . . . . . . . . . . . 6922.2 Block Code Implementation . . . . . . . . . . . . . . . . . . . . . . . . . . . . . . . . 7022.3 Performance and Costs . . . . . . . . . . . . . . . . . . . . . . . . . . . . . . . . . . . 7123 Error Detection via CRC7223.1 Generation of the CRC . . . . . . . . . . . . . . . . . . . . . . . . . . . . . . . . . . . 7223.2 Performance and Costs . . . . . . . . . . . . . . . . . . . . . . . . . . . . . . . . . . . 7324 Spread Spectrum24.1 FH-SS . . . . . . . . . . . . . . . . . . . . . . . . . . . . . . . . . . . . . . . . . . . .24.2 DS-SS . . . . . . . . . . . . . . . . . . . . . . . . . . . . . . . . . . . . . . . . . . . .24.3 PN code generation . . . . . . . . . . . . . . . . . . . . . . . . . . . . . . . . . . . . .7373747625 Medium Access Control7926 Packet Radio8026.1 Aloha . . . . . . . . . . . . . . . . . . . . . . . . . . . . . . . . . . . . . . . . . . . . 8026.2 Slotted Aloha . . . . . . . . . . . . . . . . . . . . . . . . . . . . . . . . . . . . . . . . 8027 CSMA-CA27.1 Carrier Sensing . . . . . .27.2 Hidden Terminal Problem27.3 802.11 DCF . . . . . . . .27.4 In-Class DCF Demo . . .27.5 RTS/CTS . . . . . . . . .818181818384
ECE 5325/6325 Fall 201128 Diversity28.1 Methods for Channel Diversity . .28.1.1 Space Diversity . . . . . . .28.1.2 Polarization Diversity . . .28.1.3 Frequency Diversity . . . .28.1.4 Multipath diversity . . . . .28.1.5 Time Diversity . . . . . . .28.2 Diversity Combining . . . . . . . .28.2.1 Selection Combining . . . .28.2.2 Scanning Combining . . . .28.2.3 Equal Gain Combining . . .28.2.4 Maximal Ratio Combining .5.84858585858686878789898929 Shannon-Hartley Bandwidth Efficiency9030 MIMO30.1 Revisit Maximal Ratio Combining30.2 Alamouti code . . . . . . . . . . .30.3 MIMO Channel Representation . .30.4 Capacity of MIMO Systems . . . .9292939495.
ECE 5325/6325 Fall 20116Lecture 1Today: (1) Syllabus, (2) Cellular Systems Intro1Cellular Systems Intro1.1Generation ZeroThe study of the history of cellular systems can help us understand the need for the system designconcepts we have today.One of the major developments in WWII was the miniaturization of FM radio components toa backpack or handheld device (the walkie-talkie), a half-duplex (either transmit or receive, notboth) push-to-talk communication device. After returning from war, veterans had the expectationthat wireless communications should be available in their civilian jobs [26]. But the phone system,the Public Switched Telephone Network (PSTN) was: wired, and manually switched at telephoneexchanges. In 1952, the Mobile Telephone System (MTS) was designed to serve 25 cities in the US[11] (including one in Salt Lake City [10]). In each city, an additional telephone exchange office wascreated for purpose of connection with the mobile telephones [26]. The MTS and later the improvedmobile telephone system (IMTS), introduced in 1964, were not particularly spectrally efficient. They were allocated a total bandwidth of about 2 MHz. Frequency modulation (FM) wasused. For multiple user access, the system operated frequency division multiple access(FDMA), in which each channel was allocated a non-overlapping frequency band within the2 MHz. The PTSN is full duplex (transmit and receive simultaneously) in IMTS, so it required twochannels for each call, one uplink (to the base station) and one downlink (to the mobilereceiver). Note MTS had been half duplex, i.e., only one party could talk at once. The FCC required them to operate over an entire city (25 mile radius). Since the coveragewas city wide, and coverage did not exist outside of the cities, there was no need for handoff. Initially channels were 120 kHz [7], due to poor out-of-band filtering. The channel bandwidthwas cut to 60 kHz in 1950 and again to 30 kHz in 1965. Thus there were 2 MHz / 2 / 120kHz or 8 full duplex channels at the start, and up to 32 in 1965, for the entire city.Control was manual, and the control channel was open for anyone to hear. In fact, users wererequired to be listening to the control channel. When the switching operator wanted to connect toany mobile user, they would announce the call on the control channel. If the user responded, theywould tell the user which voice channel to turn to. Any other curious user could listen as well. Amobile user could also use the control channel to request a call to be connected. The system wascongested, so there was always activity.The demand was very high, even at the high cost of about 400 per month (in 2009 dollars).There were a few hundred subscribers in a city [11] but up to 20,000 on the waiting list [26]. Theonly way to increase the capacity was to allocate more bandwidth, but satisfying the need wouldhave required more bandwidth than was available.
ECE 5325/6325 Fall 20117The downsides to MTS took a significant amount of technological development to address, andthe business case was not clear (AT&T developed the technologies over 35 years, but then largelyignored it during the 1980s when it was deployed [11]).1.2CellularThe cellular concept is to partition a geographical area into “cells”, each covering a small fractionof a city. Each cell is allocated a “channel group”, i.e., a subset of the total list of channels. Asecond cell, distant from a first cell using a particular channel group, can reuse the same channelgroup. This is called “frequency reuse”. This is depicted in Figure 3.1 in Rappaport. This assumesthat at a long distance, the signals transmitted in the first cell are too low by the time they reachthe second cell to significantly interfere with the use of those channels in the second cell.There are dramatic technical implications of the cellular concept. First, rather than one basestation, you need dozens or hundreds, deployed across a city. You need automatic and robustmobility management (handoff) to allow users to cross cell lines and continue a phone call. Both ofthese are actually enabled by semiconductor technology advancement, which made the base stationsand the automated wired PSTN cheaper [26].Frequency reuse and handoff are topics for upcoming lectures.1.3Key TermsCommunication between two parties (a “link”), in general, can be one of the following: Simplex : Data/Voice is transferred in only one direction (e.g., paging). Not even an acknowledgement of receipt is returned. Half Duplex : Data/Voice is transferred in one direction at a time. One can’t talk and listenat the same time. One channel is required. Full Duplex : Data/Voice can be transferred in both directions between two parties at thesame time. This requires two channels.In a cellular system, there is full duplex communication, between a base station and a mobile.The two directions are called either uplink (from mobile to base station) or downlink (from BSto mobile). The downlink channel is synonymous with “forward channel”; the uplink channel issynonymous with the “reverse channel”.Simultaneous communication on the many channels needed for many users (radios) to communicate with a base station can be accomplished by one (or a combination) of the following multipleaccess methods. Frequency division multiple access (FDMA): Each channel occupies a different band of thefrequency spectrum. Each signal can be upconverted to a frequency band by multiplying itby a sinusoid at the center frequency of that band, and then filtering out any out-of-bandcontent (see ECE 3500). Time division multiple access (TDMA): Every period of time can be divided into short segments, and each channel can be carried only during its segment. This requires each device tobe synchronized to have the same time clock.
ECE 5325/6325 Fall 20118 Code division multiple access (CDMA): Many channels occupies the same frequency band, atthe same time. However, each channel occupies a different “code channel”. Like sinusoids atdifferent frequencies are orthogonal (non-interfering), sets of code signals can also be madeso that all code signals are orthogonal to each other. One user’s channel is multiplied by onecode in the set, and at the receiver, can be separated from the other signals by filtering (likefrequency bands can be filtered to remove out-of-band content).See Figures 9.2 and 9.3, pages 450-453, in the Rappaport book.Physical “parts” of a cellular system:1. Public switched telephone network (PSTN): Wired telephone network, connecting homes,businesses, switching centers.2. Mobile switching center (MSC), a.k.a. mobile telephone switching office (MTSO): Controlsconnection of wireless phone calls through the base stations to the PSTN. Connected eitherby wire or by wireless (microwave relay) to the base stations.3. Base station (BS): Maintains direct wireless connection to cell phones in its cell. Typicallymaintains many connections simultaneously. Has multiple antennas, some for downlink andsome for uplink.See Figure 1.5, page 14, in the Rappaport book.In cellular systems, there are actually two types of channels: (1) Control, and (2) Communication. The control channel is needed to tell the mobile device what to do, or for the mobile to tellthe BS or MSC what to do. The communication channel is the “voice channel” or data channel,the actual information that the user / system needs to convey in order to operate. Since we alsohave a forward and reverse channel (for full duplex comms), we have1. FCC: Forward control channel2. FVC: Forward voice channel(s)3. RCC: Reverse control channel4. RVC: Reverse voice channel(s)Quite a bit of work goes into planning for frequency reuse. We have two goals. First, a radioshould be in range of at least one BS; so BSes must have a certain density so to cover all of an area.Next, a radio must avoid co-channel interference from other BSes using the same channel, whichmeans that base stations using the same channel should be widely separated. These are conflictinggoals! The first section of this course will teach you how to engineer a cellular system that worksto a desired specification.Lecture 2Today: (1) Frequency Reuse, (2) Handoff
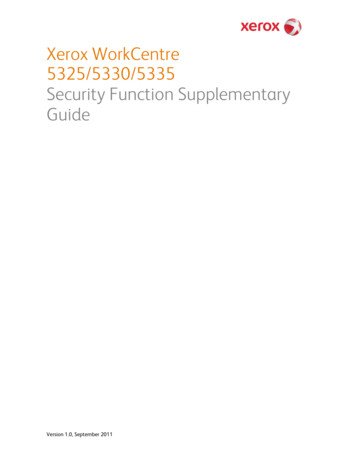
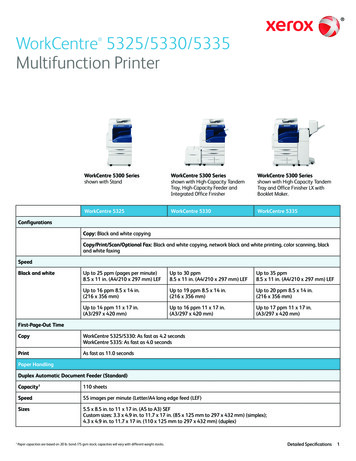
ECE 5325/6325 Fall 201129Frequency Reuse2.1Transmit Power LimitsA cell is the area in which a mobile is served by a single BS. What is the power transmitted by theradios in a cell system? Limits differ by country.1. Base station maximum 100 W maximum Effective Radiated Power (ERP), or up to 500 Win rural areas [27]2. Cell phone maximum: typically 0.5 W; but limited by power absorbed by human tissue intest measurements (of specific absorption rate).Cell phone exposure limits are typically set to meet strictest of US / European / other standards.2.2Cellular GeometryWhen the signal from the base station becomes too weak, the mobile will not be able to be servedby the BS. This defines the outer limit of a cell’s coverage area. What shape is a cell? See Figure1. These are in order from most to least accurate:1. A shape dependent on the environment.2. Circular (theoretical): If path loss was a strictly decreasing function of distance, say, 1/dn ,where d is the distance from BS to mobile and n is the “path loss exponent”, then the cellwill be a perfect circle. This is never really true, but is often used to get a general idea.3. An approximation to the theoretical shape: required for a tessellation (non-overlapping repetitive placement of a shape that achieves full coverage. Think floor tiles.) Possible “tile” shapesinclude triangles, squares, hexagons. Hexagons are closest to reality.(a)(b)Figure 1: Theoretical coverage area, and measured coverage area. In (b), from measurements, withred, blue, green, and yellow indicating signal strength, in decreasing order. From Newport et. al.[19].As we mentioned in lecture 1, a cellular system assigns subsets, “channel groups”, of the totalset of channels to each cell. Call the total number of channels S, and the number of channel groupsN . Then there are on average k S/N channels per cell, and N cells per cluster. (In reality, kmay vary between groups.) Then with N channel groups, how do we assign them? We want cellsthat reuse group A, for example, to be as far apart as possible.The total number of channels in a deployment are S times the number of clusters in ourdeployment area. If we’re limited by spectrum (number of channels) and want to increase the
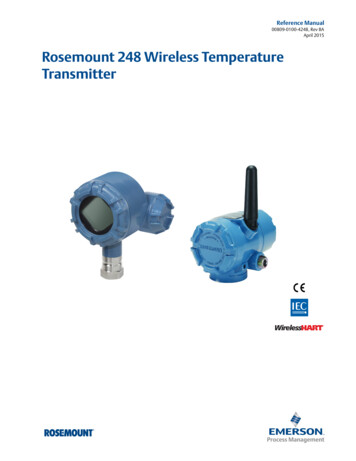
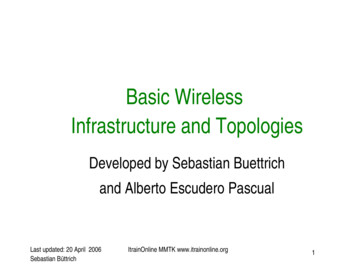
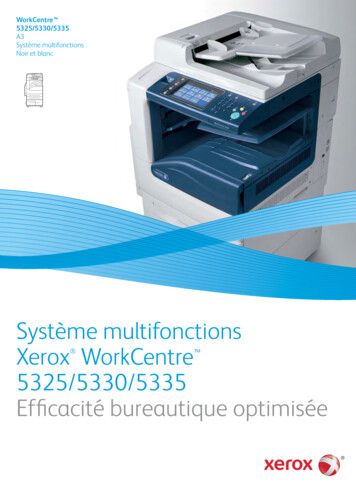
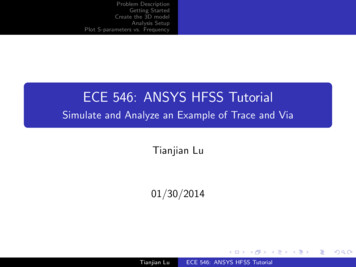
ECE 5325/6325 Fall 201110capacity over a fixed area, we want to maximize the number of clusters, or minimize the areacovered by any particular cluster. This is why we might use smaller and smaller cell diametersas we want to increase our system capacity. What is the radius R of a cell? (From C. Furse)Macrocell: R 2000 feet, up to 25 miles; Microcell: 200 R 1000 feet; Picocell: R 100 feet.2.2.1Channel Assignment within GroupSee Section 3.3. Which channels should be assigned to a cell? First, it is best to separate channelsin the group in frequency as much as possible to reduce adjacent channel interference (studiedlater). But which channels are assigned? Two ways:1. Fixed assignment: Each base station has a fixed set of channels to use. Simple, but a busycell will run out of channels before a neighboring cell. System performance will be limited bythe most crowded cell.2. Dynamic allocation: Each base station can change the channels it uses. Channels in neighboring cells must still be different. This requires more careful control, but increases thecapacity.For example, a typical city needs more channels in its business districts during the day, and in itsresidential areas at night and on weekends.For general shapes, this can be seen as a graph coloring problem, and is typically covered in agraph theory course. For hexagons, we have simple channel group assignment. Consider N 3, 4,7, or 12 as seen in Figure 2. A tessellation of these channel groupings would be a “cut and paste”tiling of the figure. The tiling of the N 4 example is shown in Figure 3.Figure 2: Hexagonal tessellation and channel groupings for N 3, 4, 7, and 12.Example: Call capacity of N 4 systemAssume that 50 MHz is available for forward channels, and you will deploy GSM. Each channel is200 kHz, but using TDMA, 8 simultaneous calls can be made on each channel. How large is k?How many forward calls can be made simultaneously for the cellular system depicted in Figure 3?Solution: There are 50 MHz / 0.2 MHz or 250 total channels. With N 4, then k 250/4 62.5,and with (about) 62.5 channels, 8(62.5) 500 calls can be made simultaneously in each cell. Thereare 28 cells on the cell map in Figure 3, so the total forward calls is 28(500) 14 103 calls canbe made simultaneously.Why wouldn’t you choose N as low as possible? There are interference limits, which will bediscussed in more detail in Section 2.4.
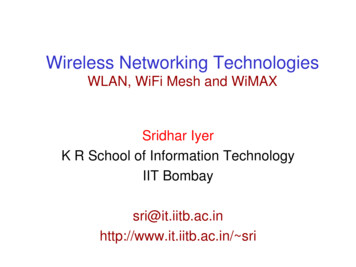
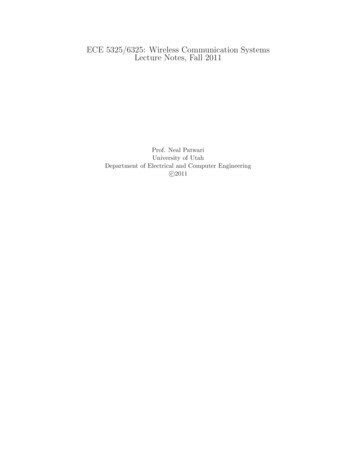
ECE 5325/6325 Fall 201111Figure 3: Frequency reuse for N 4.How do you generally “move” from one cell to the co-channel cell (a second cell assigned the samechannel group)? All cellular tiling patterns can be represented using two non-negative integers, iand j. The integer i is the number of cells to move from one cell in one direction. Then, turn 60degrees counter-clockwise and move j cells in the new direction. For Figure 3, this is i 2, j 0.In this notation, the number of cells can be shown to be:N i2 ij j 2What is the distance between two co-channel cell BSes? If the distance between the BS and avertex in its cell is called R, its “radius”, then you can show (good test question?) this co-channelreuse distance D is: D R 3N The ratio of D/R 3N is called Q, the co-channel reuse ratio.2.3Large-scale Path LossFigure 4: Figure 4.1 from Rappaport, measured received power along a linear path, along with itswindowed average.We will discuss fading in detail in subsequent lectures. For now, consider that received powervaries quickly (see the measurement in Figure 4). Figure 4 also shows that a time-average ofthe received power is less variable but is not purely decreasing as distance between TX and RX
ECE 5325/6325 Fall 201112(path length) increases. However, broadly speaking, if we could average out many measurementsof received signal power over many links with path length d, we would see a received power Pr (inmW) that decayed proportional to 1/dn , where n is called the path loss exponent. Proportionalitygives us Pr c/dn for some constant c. If we choose c P0 dn0 , thenPr (P0 dn0 )1 P0dn d0d n P0 dd0 nfor reference power P0 and reference distance d0 . In this form, P0 is the average power at a referencedistance d0 . Typically d0 is taken to be something small, like 1 meter or 10 meters. Converting topower in dBm,d10 log 10 Pr 10 log 10 P0 10n log10 {z } {z }d0{z} Pr (dBm)P0 (dBm)dB PathlossQuestion: How much does your average received power change when you double your path length?Sidenote: How can you read your phone’s received power in dBm? There are “field test modes”that differ by phone. For Nokia (I’m told) and iPhones, dial the number *3001#12345#* whichputs you into field test mode. On my iPhone 3GS, this puts the dBm received power in the upperleft corner of the screen.2.4Co-Channel InterferenceWhat is the ratio of signal power to interference power? This is the critical question regarding thelimits on how low we may set N . This ratio is abbreviated S/I. Signal power is the desired signal,from the base station which is serving the mobile. The interference is the sum of the signals sentby co-channel base stations, which is not intended to be heard by mobiles in this cell. The S/Iratio is defined as:SS P i0Ii 1 Iiwhere Ii is the power received by the mobile from a co-channel BS, of which there are i0 , and Sis the power received by the mobile from the serving BS. NOTE: All powers in the S/I equationabove are LINEAR power units (Watts or milliWatts), not dBm.Figure 5: Desired, and interfering signal for a mobile (M) from a serving and co-channel basestation.As a first order, before we get more complicated, we model the received power as inverselyproportional to distance to the n power, for some constant path loss exponent n:S cd n
ECE 5325/6325 Fall 201113for some real valued constant c.We typically look at the worst case, when the S/I is the lowest. This happens when the mobileis at the vertex of the hexagonal cell, i.e., at the radius R from the serving BS. So we knowS cR n . What are the distances to the neighboring cells from the mobile at the vertex? Thisrequires some trigonometry work. The easiest approximation is (1) that only the first “tier” ofco-channel BSes matter; (2) all mobile-to-co-channel-BS distances are approximately equal to D,the distance between the two co-channel BSes. In this case,cR nS(D/R)n(3N )n/2S P i0 Ii0 (cD n )i0i0i 1 Ii(1)where i0 is the number of co-channel cells in the first tier. For all N , we have i0 6 (try it out!); thiswill change when using sector antennas, so it is useful to leave i0 as a variable in the denominator.It is useful to report the S/I in dB, because S/I requirements are typically given in dB.Example: AMPS designAssume that 18 dB of S/I is required for acceptable system operation. What minimum N isrequired? Test for n 3 and n 4.n/2 63.1, soSolution: 18 dB is 1018/10 101.8 63.1. Using (1), we need (3N6)1N [6(63.1)]2/n3For n 3, N 17.4; for n 4, N 6.5. Clearly, a high path loss exponent is important forfrequency reuse.2.4.1DowntiltThe Rappaport does not cover antenna downtilt, but it is an important practical concept. Comparethe elevation angles from the BS to mobile (Q1 in Figure 5) and co-channel BS to the mobile (Q2in Figure 5). Note Q2 is lower (closer to the horizon) than from the serving BS. The great thing is,we can provide less gain at angle Q2 than at Q1, by pointing the antenna main lobe downwards.This is called downtilt. For example, if the gain at Q1 is 5 dB more than the gain at Q2, then thewe have added 5 dB to the S/I ratio. Having a narrow beam in the vertical plane is also useful toreduce the delay spread and thus inter-symbol interference (ISI) [4], which we will introduce in the2nd part of this course. This narrow vertical beam is pointed downwards, typically in the range of5-10 degrees. The effect is to decrease received power more quickly as distance increases; effectivelyincreasing n. This is shown in Figure 6. How do you calculate the elevation angle from a BS to amobile? This angle is the inverse tangent of the ratio between BS height ht and horizontal distancefrom the mobile to BS, d. But, at very low ratios, we can approximate tan 1 (x) x. So the angleis ht /d.Ever wonder why base station antennas are tall and narrow? The length of an antenna in anydimension is inversely proportional to the beamwidth in that dimension. The vertical beamwidthneeds to be low (5-10 degrees), so the antenna height is tall. The horizontal pattern beamwidthsare typically wide (120 degrees or more) so the antenna does not need to be very wide. For moreinformation consult [12].Discussion: What are some of the problems with coverage and frequency reuse vs. what theRappaport book has presented?
ECE 5325/6325 Fall 201114Figure 6: A diagram of a BS antenna employing downtilt to effectively increase the path loss atlarge distances. From [15].2.5HandoffSee Section 3.4. As a mobile travels beyond the coverage region of its serving BS, it must betransferred to better BS. If the average received power drops too low prior to handoff, the call is“dropped”. Rappaport denotes this minimum average received power, below which a call cannotbe received, as Pr,minimum useable . We want to initiate a handoff much prior to this point, so we seta higher threshold Pr,handof f at which the MSC initiates the handoff procedure.Instantaneous power may go down or up very quickly due to multipath fading. The timeaveraged received power will be less variable, but will still vary due to changes in the path length(and thus the large-scale path loss) and due to shadowing. Regardless, at high mobile speeds, thishandoff needs to happen quickly. In GSM, handoff is typically within 1-2 seconds. In AMPS, thiswas 10 seconds (higher potential for dropped calls!)Define handoff margin as Pr,handof f Pr,minimum useable .How much margin is needed to handle a mobile at driving speeds?Example: Handoff MarginLet the speed of a mobile be v 35 meters/sec. For n 4, a cell radius of 500 meters (the distanceat which the power is at the threshold), and a 2 second handoff, what is needed?Solution: Assume the mobile is driving directly away from the BS, so distance d changes by 70meters in two seconds. Consider the received power at the two times:Pr,minimum useable Π0 10n log10 dPr,handof f Π0 10n log10 (d 70)Taking the difference of the two equations (the 2nd minus the 1st), 10n log 10 d 10n log10 (d 50) 10n log10dd
ECE5325/6325Fall2011 6 Lecture 1 Today: (1) Syllabus, (2) Cellular Systems Intro 1 Cellular Systems Intro 1.1 Generation Zero The study of the history of cellular systems can help us understand the need for the system design