Transcription
How to count picoalgae and bacteriawith the FACScalibur flow cytometerv. 2. November 1999Josep M. GasolDepartament de Biologia Marina i OceanografiaInstitut de Ciències del Mar, CSIC. Barcelona.pepgasol@icm.csic.es What is this ?This manual contains instructions for the routine use of the FACScalibur for countingbacterial and picoalgal concentrations in natural samples. Part of the instructions (liketurning on and off or cleaning the machine) will be useful to users of the machine forother applications. However, any user that intends to develop new methods orapproximations or that will work with unusual samples will have to manage her/himselfon his/her own. I recommend that in such a case, the cytometer manual, and a goodcytometry book (like Shapiro's “Practical Flow Cytometry”) are read and understoodbefore starting to play around. I also recommend that enough time is allotted todevelopment of procedures before actual samples are run.Needless to say, I offer this information with the assumption that you will report back tome any errors or missunderstandings and you will also report any improvements youmake.It took me some months to setup the procedures that are explained below, and somedetails are still not completely understood. I will appreciate if new information orprocedures are reported to me so that I can add them to the document. ContentsA. PrincipleB. The FACSCaliburC. Sampling and fixationD. Before switching onE. Switching onF. Checking that it all works.G. Running samplesa. picophytoplanktonb. bacteriac. Gating the sampleH. Preparing the stainsI. The bead solutionsJ. Diluting the sampleK. Calibrating the flow rateL. TroubleshootingM. CleaningN. Switching off and leaving23456899101111121314151515- Counting picoplankton with the FC 1 -
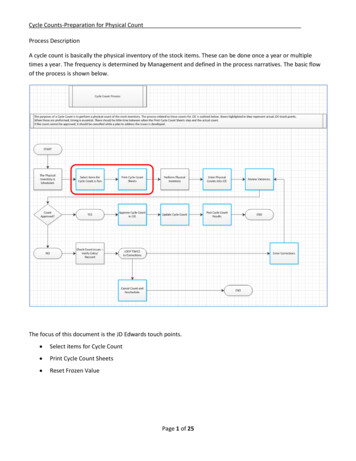
O. Data processinga. bacteriab. picoalgaec. minicellsd. a word about CTCP. Bacterial “size”Q. Where to buy.R. How to cite methods in a paperS. References161620272930313133A. Principle.A fluidics system uses pression to force the sample to go through a fixed point in a wayin which one particle, in a single drop, at a time circulates in front of a laser beam. Oursystem has a blue (488 nm) laser. Light dispersed by the particle, and fluorescenceemitted by the particle after the laser excitation, are collected in photomultipliers and sentto the computer where data are processed. The procedure is fast, and thousands ofparticles can circulate per minute. Information about light dispersion as well asfluorescence emitted is collected, combined, and saved to disk.Figure 1, created by G. Dubelaar, and obtained from http://home.wxs.nl/ dubelaar/icesrep.html, shows an overview of the process:- Counting picoplankton with the FC 2 -
B. The FACSCaliburAll this is implemented in the following machine, common in many oceanography labs:A.- Liquids (sheath and waste) tanksB.- Sample (in a tube)C.- Main controlsD.- Filtration stuff for sortingE.- Controls of sortingF.- LaserG.- Analysis chamberH.- Photomultipliers and optical filtersI.- ElectronicsJ.- Laser refrigerationk.- Switch (on/off)In a close-up, we can appreciate the details (Fig. 3), in particular, the entrance of thesample (D), the chamber where paricles interact with the laser (B), the photomultiplers(C), and the forward scatter detector, which is the only one that is not a photomultiplier(A).- Counting picoplankton with the FC 3 -
The machine is controlled by a computer (Fig. 4), which can be turned on by pressingthe key in B. The magnetooptical drive A has to be turned on before the computer. Thesoftware is protected by a keylock (C) that, once in a while gets disconnected.C. Sampling and fixation.Fixation of samples is a necessary procedure both because we don't want to loose cellswith time and also because fixation aparently facilitates probe entrance into the cell(Bullock 1984). We are currently fixing samples with P G (1% paraformaldehyde 0.05% glutaraldehyde final) followed by deep-freezing in liquid nitrogen. Vaulot et- Counting picoplankton with the FC 4 -
al.1989 suggested fixation with 1% glutaraldehyde and Premazzi et al.1992 developed aprotocol with 0.1% to 0.5% paraformaldehyde (methanol-free formaldehyde). A goodcomparison performed by Troussellier et al. (1995) showed that PFA or formalin arebetter than glutaraldehyde both for cell permeabilization (helping the dye getting in) andfor fluorescence maintenance. PFA also did not modify the size characteristics of thecells. Other fixatives used are formaldehyde, paraformaldehyde alone andglutaraldehyde. Furthermore, glutaraldehyde smells really bad. The protocol we use isthe same recommended for fluorescent in situ hybridization, and can be cited as Marie etal. (1997).Some details have to be taken into account for the P G fixation, :Preparation of P G (1 liter):- Weight 100 g. of PFA (Sigma P6148).- Place in 880 ml dH2 O in a beaker, covered with Parafilm (to reduce water lossthrough evaporation), and with a magnetic fly. The water has to be very hot.Near boiling.- Leave for 24 h in a fume hood on a heater (90 ) with magnetic stirring- After dissolution (it make take days), add 100 ml PBS (phosphate-bufferedsaline solution). The PBS is prepared with a Sigma P4417 pill (1 tablet in 200ml)- Add 20 ml Glutaraldehyde 25%- Filter through polycarbonate 0.2 µm in the fume hood and with a “dead”filtration system- Distribute in 5, 20 ml and 50 ml tubes as desired.- Freeze them in the -70 C freezer.- Store the tubes at -20 .- Once unfrozen, a tube should be used within a week or discarded.Fixation:- Add freshly unfrozen P G to sample (10% of sample volume).- Leave on bench in the dark for 10 min to allow complete cell fixation.- Deep freeze in liquid N2- After some hours, the sample can be placed at -20 C or, much better, at -70 CD. Before switching onBefore switching the machine on, the following rules should be complied with:- Write your name in the log file (usually placed in Fig. 4, G) and fill in the details.- Get a removable magnetooptical disk (nothing but settings can be stored in thecomputer’s hard disk).- Counting picoplankton with the FC 5 -
- Get yourself a bead solution (see below), sonicate the beads (5 min), and count themunder the epifluorescence microscope (see below).- Take the samples and the stain out of the freezer and let them unfreeze.- Get a small (50 ml) amount of MilliQ water- Make sure there are enough tubes for the number of samples you've got.- If there aren’t enough tubes or dye, talk to the facility supervisor.- The needed automatic pipettes should be in the drawer (F) just below the computer.E. Switching onOur machine has to be switched on 15 min before the computer is turned on. It has towarm up or else the computer will not recognize the machine. In some models you canhear a “click” when the machine is ready and the computer can be turned on.Once the machine is on, the first step is to check for how much sheath fluid is there. Doso by opening the left container in the machine. You will see two plastic containers withliquid:- Make sure there is a water-filled tube in position in the machine (A in Fig. 6).- The one at the right side (A, Fig. 5) is the Waste tank. It should be emptied.Unscrew the connections (B) at the top (CAREFULLY, it's not necessary to breakthe tubing, C). Throw the liquid through the sink.- The left one, covered by a black metal jacket, is the Sheath liquid tank (D). Toremove it, you have to: First, get the pressure out by moving the black valve (E)towards you. Second, remove the black jacket (F) by pushing it backwards. Third,- Counting picoplankton with the FC 6 -
unscrew the connections at the top (CAREFULLY, it's not necessary to break thetubes).- Go upstairs and fill the tank with MilliQ water. (this requires opening the MilliQmachine 10 min in advance, writing down your name and amount of water used,removing the filter at the MilliQ water outing -it might contaminate water instead offiltering it-, and getting the water).- Put both tanks in their place. Close the connections (CAREFULLY, it's notnecessary to break the tubs). Put the black jacket back in place. Put pressure on(valve towards the wall).- Let water circulate by opening the white valve (G) at the front. This action shouldremove all air bubbles from the tubing. Close that valve afterwards. No air bubbles(or very small ones) should be visible. If a big bubble is in the filter (H) or aroundit, remove the connection of the filter from the central panel (I), and push with yournails the side of the tip until water comes out.- Close the Liquid receptacle, and push the “Prime” pilot light (Fig. 6, F, red color)on the machine. Once it turns orange again, throw away the tube with the liquid,and put MilliQ water. Push “Run” (D) and “Hi” speed (C). This action will furtherclean the tubing. To place a tub in, you have to move sideways the B switch, andbe careful at placing the tube so as not to break the metal rod.By now 15 min have passed so you should be able to open the computer. Open FIRSTthe magnetooptical. Then the computer. Select your username and type your password.If the computer has been connected before the machine warmed up, the last icon to appearat the bottom of the screen while the computer initializes will appear with a black cross. If- Counting picoplankton with the FC 7 -
that happens, you have to shut down the computer, wait 10 min and turn it on again. Thishappens often !Once in a while, even after rebooting the computer, the cytometer is not seen by thecomputer. In that case, you have to turn off both computer and cytometer, and on. It hashappen often that it's not necessary to wait the 15 min, but you may need to.Use the time before starting the computer to sonicate your beads for 5 min.F. Checking that it all works.At this point the program CellQuest should be opened. (Go to the Apple menu, thereunder Aplicacions Citometria, you will find an access to CellQuest). An untitledwindow will appear. Close it. Open the “General” folder which is placed inside the“Users” folder of the Hard disk. There should be a folder called “Fulls”. There, twofiles can be found: one called “Bacteria” and another one called “Picoalgae”. Open oneor the other depending on what intend to count.Next, under the menu Acquire, open “Connect to cytometer”. If this takes a long time( 30”) before appearing, turn down the computer and start again.After the Acquisition Control window appears, select, under the menu Cytometer thewindows “Threshold”, “Detectors/Amp” and “Compensation”. Place the windowswherever you like on the desktop. You should also call for the window “Status” and thewindow “Counters” (under menu Acquire).Now, under the menu Cytometer call “Instrument settings”. Open, under the“General” folder which is placed inside the “Users” folder of the Hard disk the foldercalled “Settings”. Two files can be found there: one called “Bacteria settings” andanother one called “Fitoplàncton settings”. Select whichever you need for your analysisbut don't forget that the Fitoplancton one is optimized to count prochlorophytes,cyanobacteria and picoeukaryotes in oceanic samples. Once this is done, the buttoncalled “Set” has to be pushed. And then “Done”.Two processes should be checked befor starting to work. One is slightly more technical(“alignement”) and should only be done routinely by the facility superviser. The otherprocess (“cleanness”) must be done always. Alignement. Check that the B&D beads have the right CV in all the detectors. This isdone, once a month, by the facility supervisor.All coefficients of variation of fluorescent 2 µm beads should be 2%With linear adcquisition at gains 400. Cleanness. Fill half a tube with MilliQ water. Place it in the cytometer. To do so, youhave to:a) make sure the cytometer is in “Standby” (Fig. 6, E)b) carefully move to right or left the black round thing onto which tubes areplaced (Fig. 6, B).c) bring down the tube. Do so smoothly, with care not to break the metaltubingd) place your tube.e) push up your tube.f) close the black thing.g) Push “Run” (Fig. 6, D).- Counting picoplankton with the FC 8 -
The “Run” button should turn green. If it stays in orange, first push up the tube.Secondly change the tube (see troubleshooting). Thirdly, call the facility superviser.In the “Acquisition Control” window, make sure that “Setup” is selected (it has a crossin the square). Push Acquire. Now the machine starts seeing things.It is possible that many particles appear initially. Wait for some time ( 10 min). The rateof particles appearing should be below 20 per second-1. If it stays high, the “cleaningprotocol” (see below) should be followed. You can see the rate of particle passage in theCounters window.G. Running samplesYour bead solutions should be sonicated for 5 min. before the start of the session.a. Pico and nanophytoplankton.Standard settings that work for me are: FSC: E01, SSC: 380, FL1: 400, FL2:505, FL3: 590 (Threshold at FL3: 60). All acquisition in Log.Standard run between 0.6 and 1.0 ml of sample, at HI speed ( 46 µl min-1) andwith 10 µl of a 105 beads ml-1 solution. I usually terminate the run after 10 - 12minutes or when 10.000 particles have been recorded.By default a dot plot of SSC vs. FL3 and another one of FL2 vs. FL3 will bedisplayed together.DON'T FORGET to write down in your notebook the sample volume and thevolume of beads added.Procedure:a) Put the sample in the tube.b) add the beads, on the wall and making sure the drop doesn't remain in the tipof the pipette.c) vortex the tube.d) put the machine in “Standby”.e) change the tube.f) put the machine in “Run” (if the light stays in orange, see below).g) In the Acquisition Control window, push “Pause”, then “Abort”, then makesure “Setup” is on, and then push “Acquire”.h) Let the machine run for a few seconds. Watch that the populations appear.When happy with what you see, prepare the machine for saving the data.You should see the beads appear in channels numbers SSC: 3E2 and FL3:1E2.i) Go to the menu Acquire, and select “Parameter description”. Give a name tothe sample, and select the folder where it will be stored. Remember that itMUST be in a magnetooptical disk. By default 10.000 particles will beacquired.j) In the Acquisition Control window, push “Pause”, then “Abort”. Click on“Setup” to remove the cross, and now push “Acquire”. The data will start tobe acquired.Notes:- Counting picoplankton with the FC 9 -
- If the sample runs out before the end of the acquisition, air will enter the sampleand it will be tough to analyze, so keep an eye on the sample.- Once you are fed up with waiting, you can always store what you got bypushing “Pause” and then “Save” in the Acquisition Control window.- Don't ever even think of changing any of the public settings. If you consideryourself a power user, save your modifications with a different name and inyour folder. And READ THE MANUAL !- If you only see noise (but you are sure you had your sample), a gate can beplaced (see below for instructions).b. Bacteria.Standard settings that work for me are: FSC: E02, SSC: 400; FL1: 511, FL2:400, FL3: 590 (threshold a FL1: 72). All acquisition in Log.Standard run 0.4 ml of sample, at LO speed ( 19 µl min-1) and with 10 µl of a 106beads ml-1 solution. I usually terminate the run after 10.000 particles have beenrecorded which should happen in around 1-2 minutes.By default a dot plot of SSC vs. FL1 and another one of FL1 vs. FL3 will bedisplayed together.DON'T FORGET to write down in your notebook the sample volume and thevolume of beads added.Procedure:a) Put the sample in the tube.b) add 4 µl of stain solution (see below). Vortex. Wait 10 minutes with the tubein the dark. This is a high concentration (5 µM final of stain). It will stainequally well with 2 µl (the recommended 2.5 µM), but this is difficult topipette. And increasing the sample volume to 1 ml implies that you willspend all your sample in a single run. However, I have checked that there isno change in the response of the sample with varying concentrations from 1µM until 25 µM. We can always dilute more the stain, but we won't do it inroutine counting mode.c) add the beads, on the wall and making sure the drop doesn't remain in the tipof the pipette.d) vortex the tube.e) put the machine in “Standby”.f) change the tube.g) put the machine in “Run” (if the light stays in orange, see below).h) In the Acquisition Control window, push “Pause”, then “Abort”, then makesure “Setup” is on, and then push “Acquire”.i) Let the machine run for a few seconds. Watch that the populations appear.When happy with what you see, prepare the machine for saving the data.You should see beads fall in channels 103 for SSC and FL1, and bacteriafall in the channels around 101 for SSC and 102 for FL1.i) Go to the menu Acquire, and select “Parameter description”. Give a name tothe sample, and select the folder where it will be stored. Remember that itMUST be in a magnetooptical disk. By default 10.000 particles will beacquired.j) In the Acquisition Control window, push “Pause”, then “Abort”. Click on“Setup” to remove the selection, and now push “Acquire”. The data will startto be acquired.Notes:- Counting picoplankton with the FC 10 -
- Don't ever even think of changing any of the public settings. If you consideryourself a power user, save your modifications with a different name and inyour folder. And READ THE MANUAL !- If you only see noise (but you are sure you had your sample), a gate can beplaced (see below for instructions).- Keep an eye at the speed of sample passage. If it is above 800 particles s-1, thenyou will be underestimating true concentration. You will have to dilute yoursample. See below for instructions.Speeds of sample passage (Calibrated March'98)LO: 18.4 events s-1ME: 24.6 events s-1HI: 45.9 events s -1C. Gating the sample.Sometimes there is a lot of noise coming at low fluorescent levels. If you store allthe data, maybe only 500 out of the 10000 events acquired are of interest. Toavoid that happening, we can always gate the sample.Noise usually occurs at high SSC and low FL3 when running for picoalgae (but itmight also occur at low SSC and low FL3), and at low SSC and low FL1 whenrunning for bacteria.To gate the sample, you have to:a) Stop acquiring data. Push “Abort” in the Acquisition Control window.b) Call the Tool palette and select the “Polygonal-region tool” (sixth in the rightside).c) create a CLOSED window, that includes beads and cells and lets out noise.d) Go to the menu Acquire and select “Acquisition and storage”.e) Select “R1 G1” in all the menus where “All” is selected (that is, in “Accept”,in “Event count” and in “Data file will contain”).f) Now you can proceed as usual.Note that if you want to see the rate of cell passage, in the Counters window youhave to extend it down (by clicking in the upper-right little square). Now the “true”number of events stored and the true rate is the one that you see in the lower leftpart of the square.H. Preparing the stainsA description of how to prepare a new batch of Syto13 follows. Preparing other stains(PicoGreen, SybrGreen I and II.) follows pretty much the same protocol. Buy the stuff from Molecular Probes (fax: 31 71 5233419). Catalog number S-7575,size 250 µl. If you buy them 5 at a time it is way cheaper. Keep searching their web(www.probes.com) for updates. ICM costumer number is F7364. Give the signed“vale” to Justo at the same time. The stuff will come next day. Label the box (owner and date). Place it in the freezer. When ready, get yourself DMSO (bought from SIGMA), 20 Eppendorf vials, a plasticbag, a 25 ml plastic tube, and pipettes and tips. Wear gloves all the time.- Counting picoplankton with the FC 11 -
Let the MP vial with the stuff unfreeze. Pipete the 250 µl and place them in the plastictube. The stuff is heavy and some of it will remain on the tip and on the walls of thevial. With a new tip, dispense 200 µl of DMSO in the MP vial, vortex, pipette it out tothe plastic tube. Repeat three times. Fill up to 2.5 ml of DMSO (that is add: 2500 - 250 –(6*(200)) 1050 µl). Clean the first tip with the DMSO-Syto13 solution and add it back to the plastic vial. Distribute the solution in the Eppendorf tubes ( 200 µl per eppendorf). It is now at500 µM concentration. Label them with S13. Put them in a plastic bag that you labelwith your name and date. Put them in the freezer.I. The bead solutionsPrepare the bead solutions always in glass Pyrex bottles. Keep them alwaysrefrigerated. Count them every day. Stain with Syto13 (or with DAPI) once in a whileand after a long time without being used.Preparation of the “Backup solution”:Place 1 drop of beads in 18 ml MilliQ water 2 ml of Glutaraldehide 10%Preparation of a 106 solution:20 ml MilliQ 3 ml of backup solution (previously sonicated for 5 min)Preparation of a 105 solution:20 ml MilliQ 0.7 ml of Backup solution (previously sonicated for 5 min)Label the bottles with your name, the date and the approx. concentration.Write down in the book date and characteristics of the prepared bead batches.Counting the bead solutionsGet 1 ml of bead solution and place in a tub together with 2 ml of MilliQ or PBS.Prepare a 0.2 µm black Nuclepore -GTBP- (or Poretics) and a backing 0.8 µmAA Millipore filter. Place the backing filter in the tower, place a drop of water.Connect vacuum until water is gone. Disconnect vacuum. Place the 0.2 µm filter.Place the tower. Vortex the tube. Place the sample in the tower. Connect thevacuum until all water is gone. Remove tower, remove filter and let dry.Disconnect the vacuum.Place a drop of low fluorescence oil on the slide. Place the filter, place anotherdrop of oil and the coverslip. Flat down the coverslip with the help of the forceps.Count the beads under epifluorescence (blue or UV light, it doesn't matter).COUNT ONLY SINGLE BEADS. At least 30 fields, and at least 200 beads. Tryto count a whole transect, because beads tend to concentrate together at the sidesof the filter.Conversion factor for the “upright” Nikon microscope with the “new” towers:- Counting picoplankton with the FC 12 -
Concentration Average per whole field divided by volumefiltered and times 54119.Be warned that if you count only lines or small squares you've got to convert thatvalue to the whole field (big square)Write down in the book the concentration you have measured and the date.NOTE: We are now using 1 µm (in fact I think they are 0.95 µm) yellow-green beadsfrom Polysciences. I am extremely unhappy with these beads. Sometimes theyaggregate a lot, some other times they don't aggregate at all. Sometimes they get easilycontaminated, some other times you can leave a bottle on the counter for weeks withoutany contamination occurring. Some beads are clearly smaller than the assumed averagesize, dilute concentrations lose beads (e.g. Olson et al. 1993), and all sorts ofnightmares. We are in the process of substituing these beads for other brands andqualities.J. Diluting the samplesAs told before, when the rate of particle passage is above 800 s-1, chances are that youare underestimating true concentration because some cells may pass together(“coincidence”), and also because particles may pass in the “dead process time” zone:the time that the machine (& computer) electronics uses to process the signals obtainedbefore. This “dead time” is difficult to calculate, and everybody says that we shouldn'thave problems for rates below 2000 s-1. However, and empirically, we have foundevidence that suggests that we should avoid rates of particle passage above 800 s-1. Ihaven't noticed any systematic patterns when using speeds below 800 s-1. We may aswell stay on the safe side and dilute our sample always when we suspect cells are veryconcentrated (cultures, eutrophic sites) or when we see that the rate is too high.By using the protocol that follows, we have been able to count samples from Saltlagoons with concentrations above 107 cells ml-1, and salinities above 250‰. Salinityinterfers with DNA staining. However, a 20-fold dilution of these samples generatedboth concentrations and salinities within limits of procedure. Note that the samplesshould have been fixed if we intend to dilute the,For dilution, use always the same liquid that you are using as Sheath fluid (usuallyMilliQ water). If you don't, SSC signals are off and fluorescent signals may also be off.Test ALWAYS that this liquid is bacteria-free.DON'T dilute more than 20 times, without checking what happens if you do.Process:a) Put the sample (0.4 ml)b) Put the stain, vortex and wait for 15 min.c) dilute (with e.g. 0.4 ml of MilliQ).d) Immediately add the beads, vortex the sample, and run it.- Counting picoplankton with the FC 13 -
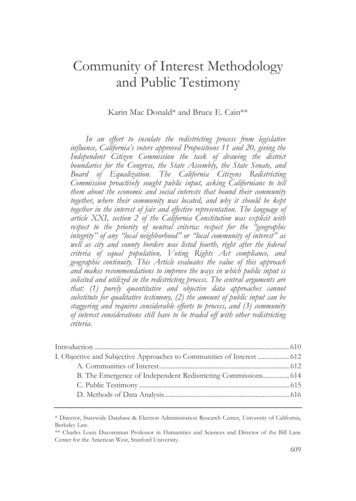
K. Calibrating the flow rateAn alternative way of performing direct concentration measurements relies on a goodcalibration of the sample flow rate. To determine it the following procedure can be done:Fill at least 5 tubes with 1-2 ml of water.Weight the tubes to the third decimal mg.Run the samples for different times (1 to 10 min)Reweight the samplesPlot weight difference (in mg) againsts time (in min)Regress it and determine the slope. This is the flow rate.This is an example for the three sample flow rates (“Lo”, “Me”, “Hi”)2y 13.2 22.6x r 0.982y 8.3 32.0x r 0.992y 7.1 66.0x r 0.99LowMediumHigh700mg of water60050040030020010000246810Time (min)Note that there is no guarantee that the flow rate is constant. In particular, it isthought that when the sheath fluid reservoir is completely full, or almost empty, theflow rate probably varies. However, using the flow rate is a simple alternative tomeasuring concentrations using beads and can be used as a complementary method tobe more certain about the calculated concentrations. Some researchers calibrate daillythe flow rate with this purpose.- Counting picoplankton with the FC 14 -
L. TroubleshootingTypical problems are:- The cytometer does not respond- The concentrations have nonsenseRebooth cytometer & computerPipettes are disequilibrated- The cytometer never gets cleanUse the bleach solution- The “Run” button stays in orangecheck the tubecheck for air bubblesThe tube has a crack. Change it.Remove air (see above).- A window saying “The cytometer is not ready” appearsA problem with the laser (talk to thesuperviser).Sheath fluid run out.M. CleaningWhen you are finished, you have to clean the machine. If you did not use any stains,you can simple run MilliQ water for 10-15 min at “HI” speed. This should be enoughfor removing the rests of samples and beads accumulated in the tubing.If you used stains, cleaning has to be done carefully. We currently set four levels ofcleaningLevel A: 6-10 min of MilliQ waterLevel B: 6-10 min ofLevel C: 6-10 min of FACSRinse (detergents)Level D: 6-10 min of diluted commercial bleachWe would use A if not very dirty, A B A if more dirty, A B C A, or if very dirty,A B C A D A.Check always the rate of particle passage which should stay at below 20 s-1 (always insetup mode).N. Switching off and leavingThe following order is mandatory.1.- Go under the Acquisition menu, and select “Disconnect to cytometer”. Thisseparates the cytometer from the computer.2.- Put a new tube with MilliQ water in the cytometer, and turn it off.- Counting picoplankton with the FC 15 -
3.- Quit from the different programs in the cytometer. Do not save settings or CellQuestfiles unless you know esxactly why you do it. If you save the files, change theirname and save them in your folder.4.- Store the pipettes in the drawer. Save any unused stain in the freezer and the beadsolutions in the fridge.5.- Turn off the vortex6.- Clean the work surface7.- WRITE DOWN in the Log-book the number of samples processed and time ofdisconnection.O. Data processingFollows a step by step description of how to process the data using the program PaintA-Gate.a.- Bacteria- Open Paint-A-Gate vs. 3 (Apple menu).- Go to the menu File, under Open PAG set and select in the Users folder, the file“Análisis Bacteria”. Nothing will happen. Go to the menu Process and select LoadFCS file Select one data file of this kind. A window like the one below will appear.- Select the red color (menu Paint), and paint the beads as in the right panel of thegraph.- Counting picoplankton with the FC 16 -
- Select the Green color (menu Paint), and paint all the bacteria as in the left panel of thegraph.- Select the blue color (menu Paint), and paint the high DNA bacteria as in the rightpanel of the graph.- Counting picoplankton with the FC 17 -
- Finally, with this process you included some noise particles that happened to be in themiddle of the bacteria. To remove them, select the white color (menu Paint), and paintthe noise as in the right panel of the graph.- If the sample had lots of Prochlorococcus or Synechococcus, they will be stained aschemotrophic bacteria. Then, two options can be done.- You either consider them bacteria (they are bacteria, I know), count them in anunstained sample and substract the counts- Or else you delete them using the white color, as in the example below. Note wherein the left graph these populations appear.- Counting picoplankton with the FC 18 -
- Now the data has been collected. Send the data to your file. To do so, you have first togo to menu Report, and “Open new spreadsheet”. Give a name to the file.- Now you can Report, “Send data to spreadsheet”.- Your data is now in the spreadsheet. Now you can open Excel, select the data ofinterest and paste it, for example, in a spreadsheet like this one:- Counting picoplankton with the FC 19 -
b.- Picoalgae- Open Paint-A-Gate vs. 3 (Apple menu).- Go to the menu File, under Open PAG set and select in the Users folder, the file“Análisis Fito”. Nothing will happen. Go to the menu Process and select Load FCSfile. Select one data file of this kind. A window like the one belo
with the FACScalibur flow cytometer v. 2. November 1999 Josep M. Gasol Departament de Biologia Marina i Oceanografia Institut de Ciències del Mar, CSIC. Barcelona. pepgasol@icm.csic.es What is this ? This manual contains instructions for the routine use of the FACScalibur for counting bacterial and picoalgal concentrations in natural samples.