Transcription
North Dakota Nursing FacultySurvey ResultsTerri Lang, BAPatricia Moulton, Ph.D.July 2008Funding for this project is provided bythe North Dakota Board of Nursing
Table of ContentsExecutive Summary .3North Dakota Nursing Needs Study Introduction .5Faculty Survey Results .6Demographics .6Student Loan Debt .10Continuing Education .11Faculty Development Boot Camp .12Employment .12Salary .18Outside Employment .19Job Satisfaction .20Retirement .22Nurse Faculty Intern Study .23Additional Comments .24Survey Conclusions .25Specific Policy Recommendations .26Faculty Survey Method .26Faculty Survey References .272
Executive SummaryBackgroundThe Nursing Needs Study was recommended, in 2001, by the North Dakota State Legislature(NDCC Nurse Practices Act 43-12.1-08.2) to address potential shortages in nursing supply.Specifically, the North Dakota Board of Nursing was directed to address issues of supply anddemand for nurses, including issues of recruitment, retention, and utilization of nurses. Torespond to this request, the North Dakota Board of Nursing contracted with the Center for RuralHealth at the University of North Dakota School of Medicine and Health Sciences.This study, initiated in 2002, was designed to obtain an accurate and complete picture of nursesin rural and urban areas of North Dakota, compare North Dakota’s trends to national trends, andinform institutional and public policy. The study, currently in its sixth year, is approved tocontinue until 2012 by the Board of Nursing. This study will continue to provide valuableinformation about the nursing workforce through a 10-year period of time.Faculty Survey ResultsThis report includes results from a faculty survey in which a total of 122 of 199 facultyresponded. The on-line survey which resulted in a response rate of 61.3% was designed to elicitinformation regarding faculty demographics, continuing education, employment and salary, jobsatisfaction, and retirement plans. DemographicsIn comparison with national and regional data, North Dakota has a smaller percentage ofInstructor, Associate Professor and Professor ranked nursing faculty and approximately thesame percentage of Assistant Professors. Male nursing faculty is on the rise compared with2003. North Dakota nursing faculty are younger than five years ago. Nursing faculty from aminority group has increased from less than 1% in 2003 to 3.5% but is less than the nationalaverage and slightly less than the regional average. Approximately the same percentage ofnursing faculty in North Dakota have earned a doctoral degree as compared to both nationaland regional data, however the percentage has declined from 2003. Continuing EducationOver half of nursing faculty intend to pursue another degree which has increased from 2003.Barriers to pursuing an additional degree include age, lack of time, cost and familycommitments. A vast majority of the faculty indicated they would be interested in attendinga faculty development boot camp if one was offered and suggested topics such as curriculumdevelopment, teaching strategies, evidence-based practice, test preparation, clinicalsimulation and utilization of current technology, critical thinking, students and facultyworkload, and dealing with difficult students.3
EmploymentMost faculty have full-time positions. The majority of faculty in LPN programs are ClinicalFaculty and Instructors. In RN programs most faculty are Assistant Professors and inAdvanced Practice/Graduate programs most faculty are Associate Professors and Professors.Faculty most frequently indicated nursing education, adult health, acute care and communityhealth as one of their clinical specialties. SalaryThe average monthly salary of faculty on a 9-month contract is higher than faculty averagemonthly salaries on 10-month and 12-month contracts. Within one-year and AssociateDegree Nursing Programs, faculty salaries are at or above national and regional averages.However, within baccalaureate and graduate nursing programs, faculty salaries are less thanthe national and regional average and those with doctoral degrees indicates even greaterdisparity. Over half of faculty have been contacted by a recruiter for positions out of statewith significantly higher salaries and full benefits, some including housing allowances. Job SatisfactionAlthough most faculty are moderately to extremely satisfied with their faculty positions,faculty as a group indicate they are not as satisfied as they were in 2003. RetirementApproximately, one-third of the faculty are planning to retire by 2017 and approximatelythree-fourths by 2026.4
North Dakota Nursing Needs Study IntroductionHealth personnel shortages can negatively impact health care quality, through reduced healthcare access, increased stress on providers, and the use of under-qualified personnel. Also,shortages can contribute to higher costs by raising compensation levels to attract and retainpersonnel and by increasing the use of overtime pay and expensive temporary personnel.Workforce shortages, while a problem for the entire health care system, are likely to be mostsevere for rural/frontier regions and medically needy population groups such as the elderly.North Dakota has 41 designated medically underserved areas, and 81 percent of North Dakota’s53 counties are designated as partial or whole county health professional shortage areas. NorthDakota also has the highest proportion of residents aged 85 and older, the age group with thegreatest need for healthcare services. In North Dakota, this cohort is predicted to double in sizeby 2020.Nurses are an integral part of the heath care system providing nursing services to patientsrequiring assistance in recovering or maintaining their physical and/or mental health (NorthDakota Healthcare Association, 2002). In the United States, nurses comprise the largest group ofhealth care providers. The ability to provide accessible, high quality care depends on theavailability of a nursing workforce with the requisite skills and knowledge. Over the past fewyears, research studies have identified clear relationships between nurse staffing and patientoutcomes. For example, lower nurse staffing in hospitals has been linked to longer hospital staysfor patients, as well as a number of complications such as pneumonia (e.g., Aiken, Clarke,Sloane, Sochalski, & Silber, 2002). Directly challenging the health care system’s ability toprovide quality patient care is a growing national and international disparity in nursingworkforce supply and demand. North Dakota is not immune to this problem.The Nursing Needs Study was recommended, in 2001, by the North Dakota State Legislature(NDCC Nurse Practices Act 43-12.1-08.2) to address potential shortages in nursing supply.Specifically, the North Dakota Board of Nursing was directed to address issues of supply anddemand for nurses, including issues of recruitment, retention, and utilization of nurses. Torespond to this request, the North Dakota Board of Nursing contracted with the Center for RuralHealth at the University of North Dakota School of Medicine and Health Sciences.This study, initiated in 2002, was designed to obtain an accurate and complete picture of nursesin rural and urban areas of North Dakota, compare North Dakota’s trends to national trends, andinform institutional and public policy. The study, currently in its sixth year, is approved tocontinue until 2012 by the Board of Nursing. This study will continue to provide valuableinformation about the nursing workforce through a 10-year period of time.This report details the results of a survey of all nursing education faculty in the state.5
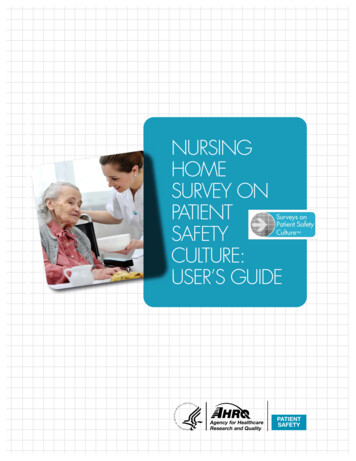
Faculty Survey ResultsNorth Dakota faculty completed a 60-question on-line survey which included questions on 122faculty demographics, continuing education, employment, job satisfaction, retirement, and whatchanges may improve the nursing education workforce as a whole. Demographics¾ The greatest number of faculty indicated they are Assistant Professors which is similar tonational numbers. However, North Dakota has less Associate Professors and Professors(see Figure 1). The National League for Nursing (2006) report of the faculty censussurvey found that across the United States 31.3% of faculty are Instructors, 33.6% areAssistant Professors, 34.9% are Associate Professors and Professors. In Midwest states,31.8% are Instructors, 33% are Assistant Professors, 35% are Associate Professors andProfessors combined.Figure 1: Faculty by Academic Rank34%35%30%27%22%25%17%20%15%10%5%0%Clinical FacultyInstructorAssistant ProfessorAssociateProfessor/Professor¾ Barriers that exist that prevent faculty from obtaining full professor status include but arenot limited to obtaining a doctorate degree, money, time and energy, amount of researchrequired, personal choice, length of time in position, family obligations, and having fewfaculty at professor level who can mentor newer faculty.6
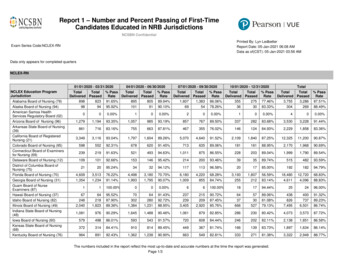
¾ 100% of Instructors, Associate Professors and Professors are female. 97% of ClinicalFaculty are female and 93% of Assistant Professors. Overall, 3% of nursing faculty aremale (see Figure 2). In 2003, less than 1% of the faculty were male. The National Leaguefor Nursing (2006) report of the faculty census survey found that across the United States4.9% of faculty are male and in Midwest states 3.9% are male.Figure 2: Gender by Academic RankTotal Faculty97%3%Associate Professor/Professor100%0%Assistant Professor93%8%Instructor100%0%Clinical FacultyMale97%3%0%Female20%40%60%80%100%¾ With the exception of Clinical Faculty, average age increases by rank; Instructor (45 years),Assistant Professor (47 years), and Associate Professor/Professor (57 years). The averageage for all faculty is 49 years compared to 51 years in 2003. 63% are between 45-60 yearsold compared to 70% in 2003 (see Figure 3). The National League for Nursing (2006) reportof the faculty census survey found that across the United States 62.7% of faculty are 45-60years old and in the Midwest states 63.4% are 45-60 years old.Figure 3: Average Age by ssorAll Faculty
¾ Average age for full-time faculty members is 50 and part-time 47 years (see Figure 4).Figure 4: Average Age Full-time or Part-time PositionAveage Age in eAcademic Position¾ The average age of faculty increases by highest degree earned; bachelors (43 years),masters (49 years), and doctorate (57 years) (see Figure 5).Figure 5: Average Age by Highest Degree Earned5749Average Age in Years604350403020100DoctorateMastersHighest Degree Earned8Bachelors
¾ 93% of Clinical Faculty, 95% of Instructors, 98% Assistant Professors, and 100%Associate Professors and Professors are White, not of Hispanic origin. Less than 4% ofall nursing faculty in North Dakota are of a minority group (see Figure 6). In 2003, lessthan 1% of all faculty were of a minority group. The National League for Nursing (2006)report of the faculty census survey found that across the United States, 86% of nursingfaculty are White and in Midwest states 95% are White.Figure 6: Ethnicity by Academic Rank3%Total Faculty97%0%Associate Professor/Professor100%3%Assistant Professor98%White5%Instructor95%7%Clinical Faculty0%Other Minority93%20%40%60%80%100%¾ Overall, 17.4% of faculty have a doctorate degree, 61.7% a masters degree and 20.9% abachelors degree. There were no instructors or clinical faculty that had earned a doctoraldegree (see Figure 7). In 2003, 25% of all faculty had earned a doctoral degree, 67% amasters degree and 3% a baccalaureate degree. The National League for Nursing (2006)report of the faculty census survey found that across the United States, 16.31% of facultyhave a doctorate degree, 66.2% a master’s degree and 16.03% a baccalaureate degree. InMidwest states, 17% have a doctorate degree, 62.9% a master’s degree and 19.87% abaccalaureate degree.Figure 7: Highest Degree Earned by Academic RankTotal FacultyAssociate Professor/ProfessorAssistant inical 7%20.0%Doctorate63.3%40.0%960.0%80.0% 100.0%
¾ Of faculty that have a doctorate degree, 37% indicated their degree was in nursing, 26%in education, 19% in teaching and learning, 7% in public health, and 12% in othercategories including community health, and physiology.¾ Of faculty that have a masters degree, 97% indicated their degree was in nursing of which47% did not indicate a specialty, 16% indicated nursing education, 8% nurse practitioner,6% maternal child health, and other.¾ Of faculty that indicated they had a bachelors degree, 95% indicated their degree was innursing. The remaining 5% stated their degree was in science, university studies andvocational education. Student Loan Debt¾ 80% of Associate Professors and Professors indicated their student loan debt was lessthan 10,000 followed by 65% of the Clinical Faculty, 56% of the Assistant Professorsand 20% of Instructors (see Figure 8). 75% of Instructors had student loans ranging from 10,000 to 49,999.Figure 8: Student Loan Debt Incurred for Graduate 16%20%10%10%4%5%4%8%0%0%0%0 ‐ 9,999Clinical Faculty10,000 ‐ 29,999Instructor30,000 ‐ 49,999Assistant Professor10 50,000Associate Professor/Professor
¾ 23% indicated they had student loan repayment assistance of which 33% indicated theBoard of Nursing provided loan repayment assistance followed by 22%employer/hospital, 15% higher education, and 29% were unsure or indicated othersources (e.g. federal grant, Social Services, and State’s Department of Health).¾ 45% indicated their spouse had incurred student loan debt of which 75% indicated thedebt was less than 10,000. Continuing Education¾ Overall, 54% of nursing faculty intend to pursue another degree in the future (see Figure9). In 2003, 37% of faculty planned to pursue another degree.Figure 9: Intention of Pursuing Additional Academic Professor/ProfessorTotal Faculty¾ Current age, lack of time, money, and family commitments were the most often statedbarriers to pursuing a doctoral degree. Other barriers included lack of reward, ability toutilize degree, health status and personal choice not to pursue degree.11
¾ Faculty Development Boot Camp72% of the faculty indicated they would be interested in attending a faculty developmentboot camp if one was offered. 98% indicated they would be willing to pay a small fee(less than 50) for registration and for continuing education credits if a facultydevelopment boot camp was offered. Topics faculty would be interested in should therebe a faculty development boot camp include curriculum development teaching strategies evidence-based practice test preparation clinical simulation and utilizing technology including distance education critical thinking student and faculty workload dealing with difficult students Why tenure is important Research opportunities Fringe benefits Educational differences between AD and BSN programs Education and collaborative resources Recruitment and retention of students and clinical sites Classroom management Capturing the audience Specialty topics Public Health Nursing Capacity Geriatrics Mental Health Employment¾ 72% of faculty have full-time positions. The National League for Nursing (2006) reportof the faculty census survey found that across the United States ,55% of faculty have fulltime positions (see Figure 10).Figure 10: Full-time/Part-time Faculty Position by Rank28%Total Faculty72%16%Associate Professor/Professor84%8%Assistant Professor93%15%InstructorClinical l‐time
¾ 64% of Associate Professors and Professors are tenured, 37% of Instructors are on atenure track, 92% of Clinical Faculty are either on a non-tenure track or where there is notenure system (see Figure 11).Figure 11: Tenure Status by Academic %4%0%37%33%24%8%4%0%TenuredOn tenure trackClinical FacultyInstructorOn a non‐tenuretrackAssistant ProfessorThere is no tenuresystemAssociate Professor/Professor¾ Barriers preventing faculty from obtaining tenure include but are not limited to theamount of research and publications required, degree requirements, time constraints,amount of time in position, administrative support, age, cost to institutions, institutionsnot offering tenure, and not working full-time.¾ 46% of faculty in LPN programs are Clinical Faculty, 40% of faculty in RN programs areAssistant Professors and 55% of faculty in Advanced Practice Programs are AssociateProfessors and Professors (see Figure 12). Several faculty members taught in more thanone type of educational program.Figure 12: Academic Rank by Program Type55%60%50%46%40%40%29%20%17%20%27%25%30%16%9% 9%7%10%0%LPN ProgramClinical FacultyInstructorRN ProgramAssistant Professor13Advanced PracticeProgramAssociate Professor/ Professor
¾ As expected, Associate Professors and Professors taught the greatest average years innursing education (23 years) (see Figure 13). Overall, all faculty averaged 11 yearsteaching nursing education compared to 16 years in 2003.Figure 13: Average Years in Nursing Education162003 All Faculty11All Faculty23Associate Professor/Professor10Assistant Professor5Instructor6Clinical Faculty0510152025Average Number of Years Teaching¾ Overall, all faculty averaged 6 years in their current position compared to 9 years in 2003(see Figure 14).Figure 14: Average Number of Years in Current Position92003 All Faculty6All Faculty11Associate Professor/Professor6Assistant Professor2Instructor4Clinical Faculty024681012Average Number of Years in Current Position14
¾ Full-time faculty average 53 hours each week for their faculty position. Part-time facultyaverage 36 hours per week (see Figure 15).Figure 15: Workload Hours by Rank36All FacultyAssociate Professor/Professor41Assistant Professor5347505335Instructor34Clinical Faculty020Part‐TimeFull‐time58494060Hours¾ Overall, faculty spend the most time teaching in a clinical setting (10.3 hours for full-timeand 11.4 hours for part-time) and the least amount on faculty development and studentrecruitment (see Table 1). When asked to specify amount of hours on certain tasks, fulltime faculty average 67.3 hours and part-time 54.4 hours.Table 1: Average Workload Hours Per Week by Academic Rank and TaskClinical ‐timetimeAssistant ProfessorFull‐Part‐timetimeTeach Nursing Theory inClassroom4.44.35.33.35.16.04.9Teach Laboratory Skills10.86.24.62.34.72.03.0Teach in a ClinicalSetting10.412.111.68.710.714.05.7Prepare for Teaching8.04.110.88.010.04.3Evaluate LearningAdvise and/or CounselStudentsRecruit 2.62.83.11.8Research ty .710.84.06.02.564.050.071.967.354.867.354.4Provide Service to theCollegeProvide ProgramCoordinationCommitteeResponsibilitiesTotal HoursWorked/WeekNANA1.0NA36.3154.165.9NA48.75.3All FacultyAverageFull‐Part‐timetimeNA
¾ On average faculty drive 17 miles each way to teach in their nursing education program(see Figure 16).Figure 16: Average Miles to Teach in Nursing Education Program17Total Faculty22Associate Professor/Professor12Assistant Professor24Instructor16Clinical Faculty0510152025Average Miles to Education Program¾ 72% of the faculty indicated they drive to clinical sites. On average, they drive 16 mileseach way (see Figure 17).Figure 17: Average Miles to Clinical Sites16Total Faculty14Associate Professor/Professor12Assistant Professor20Instructor18Clinical Faculty051015Average Miles to Clinical Sites1620
¾ Faculty were asked to indicate their clinical specialties. (Faculty were allowed to indicatemore than one.) The most often indicated specialties were nursing education (17%), adulthealth (11%) and acute care (10%). Few indicated women’s health (2%) and nursingadministration (3%). In 2003, faculty most often indicated their specialty as nursingeducation (20%), critical care (14%) and adult health (12%). Again in 2003, no facultyindicated their specialty as OB-GYN or Neonatal.Table 2: Faculty Clinical ofessor20032008All Faculty20032008Acute n2%0%0%8%6%7%4%11%0%7%3%Adult %4%Critical 3%0%0%22%0%7%5%Public %10%5%8%7%0%6%0%10%5%6%Rural r3%5%7%5%5%0%6%0%0%3%5%17
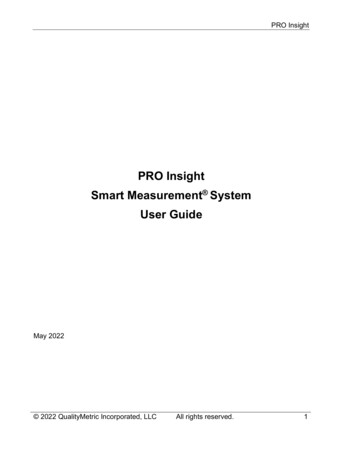
Salary¾ The average salary of faculty on a 9-month, 10-month and 12-month salary termrespectively is 53,392 ( 5,932/month), 52,247 ( 5,225/month) and 54,270( 4,523/month).Figure 18: Salary 54,270 55,000 54,000 53,392 53,0009 month10 month 52,24712 month 52,000 51,0009 month10 month12 month¾ Based on a separate survey of the nursing education programs, the average salaries forfaculty, Instructors ( 41,752), Assistant Professors ( 47,678) and Associate Professors( 57,840) are equivalent or higher than regional or national averages for one-year andADN Nursing Programs (see Table 3). The National League for Nursing (2006) report ofthe faculty census survey found the national average salary of Instructors, AssistantProfessors and Associate Professors based on an Academic Year to be 43,000, 45,000and 51,731 respectively.Table 3: Average Salary by Rank for One-Year and ADN ProgramsAcademic Year Average Salary by Rank for One‐Year and ADN ProgramsInstructor**Assistant ProfessorAssociate ProfessorProfessorNorth DakotaMidwestern RegionNational 41,752 47,678 57,840 41,760 43,850 48,171 53,856 43,000 45,000 51,731 57,000* There were no programs that indicated salaries for doctorally prepared faculty** For programs that indicated 12‐month contract salaries, they were converted to academic year equivalent salary18
¾ The average salaries for faculty of baccalaureate and graduate degree programs fornondoctoral faculty, Instructors, Assistant Professors, and Associate Professors, are 43,397, 48,410, and 53,415 respectively which is slightly less than the nationalaverages of 48,681, 51,255, and 56,567 respectively according to the AmericanAssociation of Colleges of Nursing 2006-2007 Salaries of Instructional andAdministrative Nursing Faculty. Professors with a doctoral degree have an averagesalary of 61,034 compared to a national average of 84,875 (see Table 3).Table 4: Average Salary by Rank and Degree for Baccalaureate and Graduate DegreeProgramsAcademic Year Average Salaries for Baccalaureate and Graduate RN Programs By Rank and DegreeInstructorAssistant ProfessorAssociate Professor*ProfessorNorth DakotaMidwestern RegionNational 43,397 56,501 48,410 65,389 53,415 61,034 54,128 46,369 60,000 49,161 66,927 54,799 79,895 67,395 52,000 48,681 61,321 51,255 70,000 56,567 84,875 alNondoctoralDoctoralNondoctoral* Programs that indicated greater than 10‐month contract salaries were converted to academic year equivalent salary andaveraged Outside Employment¾ Full-time faculty employed outside of their teaching position work an average of 8 hoursper week while teaching and 17 hours per week while not teaching. Part-time faculty thathave employment outside of their teaching position, work an average of 21 hours perweek while teaching and 24 hours per week while not teaching. (see Figure 19).Faculty PositionFigure 19: Hours per Week Working for Another Number of Hours working for another employer while not teachingNumber of Hours working for another employer while teaching1925
¾ Out of State RecruitmentIn the past year, 52% of the faculty indicated they have been contacted by a recruiter withinformation about a faculty position at another program out of state. Faculty indicatedthat offers ( 75,000 - 100,000) generally were significantly higher than the currentsalaries they were receiving. Other benefits, in addition to the higher salary, includedhousing allowances between 50,000 and 300,000 and full benefits including health,dental, vision and retirement. Other faculty indicated they did not get the specifics asthey were not interested at the time or they did not meet the required education level ofhaving a doctorate degree. Some examples of faculty offers include: “ 34.00 hour for clinical teaching” “ 100,000 for 9-month full-time position with guarantee of no summer workrequired. It also came with the guarantee of no work on weekends andholidays. The hours were guaranteed at an average of 8 a day and no eveningsor nights required. I also would not have to obtain a terminal degree tomaintain employment.” “salary 90,000/year plus 300,000 allowance for housing “about 25,000/year increase” Job Satisfaction¾ 76% of Clinical Faculty and 65% of Instructors are moderately or extremely satisfiedwith their faculty position (see figure 20). In 2003, 79% of Instructors were eithermoderately or extremely satisfied with their faculty position.Figure 20: Clinical Faculty Job SatisfactionInstructor Faculty Job Satisfaction5%0%17%15%23%30%7%50%53%Extremely SatisfiedModerately SatisfiedNeutralModerately dissatisfiedExtremely dissatisfied20
¾ 73% of Assistant Professors and 67% of Associate Professors and Professors aremoderately or extremely satisfied with their faculty position compared to 77% ofAssistant Professors and 83% for Associate Professors and 100% for Professors in 2003.(see figure 21).Figure 21: Assistant Professor JobSatisfactionAssociate Professors and ProfessorsJob Satisfaction0%8%8%13%22%25%20%13%Extremely Satisfied50%Moderately Satisfied42%NeutralModerately dissatisfiedExtremely dissatisfied¾ Overall, 71% of all faculty are moderately or extremely satisfied with their facultyposition (see Figure 22).Figure 22: All Faculty Job SatisfactionModeratelydissatisfied, 11%Extremelydissatisfied, 2%ExtremelySatisfied, 22%Neutral, 17%ModeratelySatisfied, 49%21
Retirement¾ Faculty plan to continue teaching for an average of 11 more years compared with 16years in 2003 (see Figure 23).YearsFigure 23: Average Years Planning to Continue cultyAll Faculty2003 AllFacultyInstructorAssistant ProfessorAssociate Professor/ ProfessorClinical FacultyAll Faculty2003 All Faculty¾ Figure 24 displays the cumulative percentage of faculty for when they plan to stopteaching nursing. 30% plan to stop teaching by 2013, 57% by 2018 and 99% by 2033. In2003, 30% planned to stop teaching by 2010, 57% by 2013 and 99% by ntageFigure 24: Cumulative Percentage of When Faculty Plan to Stop Teaching NursingYearNote. Years with missing data were filled in with the median of the surrounding years.22
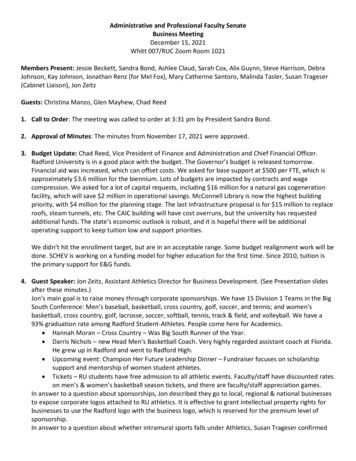
¾ Figure 25 displays the cumulative percentage of faculty planning to retire. 41% indicatedthey plan to retire by 2018 and 80% by 2030. In 2003, 41% indicated they plan to retireby 2013 and 80% by 2021. The difference between when faculty plan to stop teachingand when they plan to retire may be due to other career plans prior to retirement (ex.administration).PercentageFigure 25: Cumulative Percentage of When Faculty Plan to Retire100.050.0
The Nursing Needs Study was recommended, in 2001, by the North Dakota State Legislature (NDCC Nurse Practices Act 43-12.1-08.2) to address potential shortages in nursing supply. Specifically, the North Dakota Board of Nursing was directed to address issues of supply and