Transcription
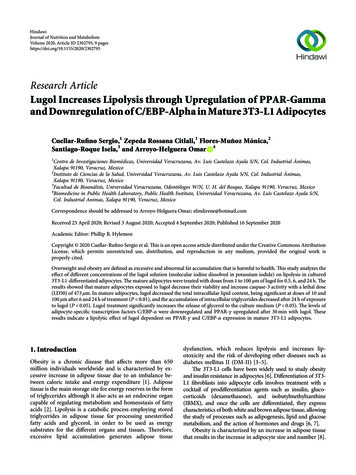
HindawiJournal of Nutrition and MetabolismVolume 2020, Article ID 2302795, 9 pageshttps://doi.org/10.1155/2020/2302795Research ArticleLugol Increases Lipolysis through Upregulation of PPAR-Gammaand Downregulation of C/EBP-Alpha in Mature 3T3-L1 AdipocytesCuellar-Rufino Sergio,1 Zepeda Rossana Citlali,1 Flores-Muñoz Mónica,2Santiago-Roque Isela,3 and Arroyo-Helguera Omar 41Centro de Investigaciones Biomédicas, Universidad Veracruzana, Av. Luis Castelazo Ayala S/N, Col. Industrial Ánimas,Xalapa 91190, Veracruz, Mexico2Instituto de Ciencias de la Salud, Universidad Veracruzana, Av. Luis Castelazo Ayala S/N, Col. Industrial Ánimas,Xalapa 91190, Veracruz, Mexico3Facultad de Bioanálisis, Universidad Veracruzana, Odontólogos W/N, U. H. del Bosque, Xalapa 91190, Veracruz, Mexico4Biomedicine in Public Health Laboratory, Public Health Institute, Universidad Veracruzana, Av. Luı́s Castelazo Ayala S/N,Col. Industrial Animas, Xalapa 91190, Veracruz, MexicoCorrespondence should be addressed to Arroyo-Helguera Omar; elindirene@hotmail.comReceived 23 April 2020; Revised 3 August 2020; Accepted 4 September 2020; Published 16 September 2020Academic Editor: Phillip B. HylemonCopyright 2020 Cuellar-Rufino Sergio et al. This is an open access article distributed under the Creative Commons AttributionLicense, which permits unrestricted use, distribution, and reproduction in any medium, provided the original work isproperly cited.Overweight and obesity are defined as excessive and abnormal fat accumulation that is harmful to health. This study analyzes theeffect of different concentrations of the lugol solution (molecular iodine dissolved in potassium iodide) on lipolysis in cultured3T3-L1-differentiated adipocytes. The mature adipocytes were treated with doses from 1 to 100 µm of lugol for 0.5, 6, and 24 h. Theresults showed that mature adipocytes exposed to lugol decrease their viability and increase caspase-3 activity with a lethal dose(LD50) of 473 µm. In mature adipocytes, lugol decreased the total intracellular lipid content, being significant at doses of 10 and100 µm after 6 and 24 h of treatment (P 0.01), and the accumulation of intracellular triglycerides decreased after 24 h of exposureto lugol (P 0.05). Lugol treatment significantly increases the release of glycerol to the culture medium (P 0.05). The levels ofadipocyte-specific transcription factors C/EBP-α were downregulated and PPAR-c upregulated after 30 min with lugol. Theseresults indicate a lipolytic effect of lugol dependent on PPAR-c and C/EBP-α expression in mature 3T3-L1 adipocytes.1. IntroductionObesity is a chronic disease that affects more than 650million individuals worldwide and is characterized by excessive increase in adipose tissue due to an imbalance between caloric intake and energy expenditure [1]. Adiposetissue is the main storage site for energy reserves in the formof triglycerides although it also acts as an endocrine organcapable of regulating metabolism and homeostasis of fattyacids [2]. Lipolysis is a catabolic process employing storedtriglycerides in adipose tissue for processing unesterifiedfatty acids and glycerol, in order to be used as energysubstrates for the different organs and tissues. Therefore,excessive lipid accumulation generates adipose tissuedysfunction, which reduces lipolysis and increases lipotoxicity and the risk of developing other diseases such asdiabetes mellitus II (DM-II) [3–5].The 3T3-L1 cells have been widely used to study obesityand insulin resistance in adipocytes [6]. Differentiation of 3T3L1 fibroblasts into adipocyte cells involves treatment with acocktail of prodifferentiation agents such as insulin, glucocorticoids (dexamethasone), and isobutylmethylxanthine(IBMX), and once the cells are differentiated, they expresscharacteristics of both white and brown adipose tissue, allowingthe study of processes such as adipogenesis, lipid and glucosemetabolism, and the action of hormones and drugs [6, 7].Obesity is characterized by an increase in adipose tissuethat results in the increase in adipocyte size and number [8].
2The amount of adipose tissue is regulated by the inhibition ofadipogenesis from preadipocytes to mature adipocytes [9]and lipolysis of adipose tissue [10]. Two key families ofadipogenic transcription factors control the differentiationof fibroblast-like preadipocytes into mature adipocytes:CCAAT/enhancer-binding protein (C/EBP-α) and peroxisome proliferator-activated receptor-c (PPAR-c) [11, 12].These transcription factors are ligand activated during differentiation and promote the expression of specific genesinvolved in the adipocyte phenotype and in glucose and lipidmetabolism [11, 13–15].Several reports have demonstrated the use of marinealgae as potential therapeutic agents against obesity [16, 17],and among its components is iodine, a trace element thataccording to the species of algae can occupy between 0.06 mgand 624 mg/100 g dry weight [18]. Iodine per se has beenreported to have antioxidant, oxidizing, apoptotic, andantiproliferative properties either in in vivo or in vitromodels by a mechanism that involves the formation ofiodolipids from polyunsaturated fatty acids such as arachidonic acid (AA) [19–22]. In 3T3-L1 preadipocytes andmature adipocytes, it is unknown whether they express theiodine transporters sodium/iodide symporter (NIS) although their expression in adipose tissue has been reported[23]. In the mammary and thyroid glands, iodine supplementation regulates the expression of PPAR-c throughiodinated lipids [19, 24, 25], inducing apoptosis [20, 21]. Iniodine-deficient human trophoblasts, mRNA and proteinlevels of C/EBP-β and SERBF1 decrease [26], indicating thatiodine could regulate lipid metabolism in adipose tissue.Therefore, the present study analyzes the effect of lugol onlipolysis, viability, and apoptosis in mature mouse 3T3-L1adipocytes and the participation of the transcription factorsPPAR-c and C/EBP-α.2. Methods2.1. Cell Culture and Differentiation. 3T3-L1 fibroblasts wereinitially maintained in Dulbecco’s modified Eagle’s medium(DMEM) supplemented with 8% fetal bovine serum (FBS),2 mM/l glutamine, 100 U/l penicillin, and 100 µg/ml streptomycin in a humidified atmosphere of 95% air and 5% CO2at 37 C. To induce adipocyte differentiation, 3T3-L1 cellswere allowed to grow to confluence and cultured with thedifferentiation medium containing 0.25 µM/ml dexamethasone, 10 µg/ml insulin, and 0.5 mM 1-methyl-3-isobutylxanthine. After 48 h exposure to the differentiation medium,cells were maintained for an additional 5-6 days in DMEMsupplemented with 8% FBS and 5 µg/ml insulin, and by day8, about 90% of the 3T3-L1 cells differentiated in matureadipocytes showing typical visual. Mature adipocytes werethen treated with 1, 5, 10, and 100 µm of lugol (5 g moleculariodine dissolved in 10 g KI) for 0.5, 6, and 24 h in the serumfree media.2.2. Determination of Total Lipid Accumulation by Oil Red OStaining. After treatment with lugol, cells were washedtwice with phosphate-buffered saline (PBS) and fixedJournal of Nutrition and Metabolismwith 4% (v/v) paraformaldehyde for 1 h at room temperature. Thereafter, adipocyte cells were washed withisopropanol 60% (v/v) and allowed to dry. Subsequently,cells were stained with the Oil Red O solution (in 60%isopropanol) for 1 h and washed four times with water.Images of Oil Red O-stained cells were acquired andviewed using an inverted microscope (Motic Pro). Fatdroplets stained red were extracted from cells usingisopropanol, and the absorbance was measured atλ 540 nm on a plate reader (Epoch microplate, Biotek,Winooski, VT, USA).2.3. RNA Extraction and RT-PCR. NIS and PEN mRNAswere determined using RT-PCR. Total RNA was extractedusing TRIreagent (SIGMA, St. Louis, MO, USA), and thecDNAs were synthesized from 5 µg of RNA using M-MLVreverse transcriptase (Promega). The sequences of the senseand antisense primers used for amplification were as follows:glyceraldehyde-3-phosphate dehydrogenase, forward GATGGG and amplicon size 240 pb;NIS, forward 5′ TCAGTACATGCCACTGCTCG and reverse 5′ CAGTTACAGCTGCCATA and amplicon size134 pb; PEN, forward 5′ GAACTCCGGAGCCCAAACAGand reverse 5′ GGCTCCGACCTGCCG and amplicon size245pb. The amplification product was visualized in 2%agarose (Sigma) in 0.5 TBE (0.045 M Tris-borate and0.001 M EDTA) stained with ethidium bromide. Theamplicon concentration was estimated and 500 ng wasdigested with 5–15 U of each restriction endonuclease SmaIfor the NIS amplicon (two fragments 57 and 77 pb) and SacIIfor the PEN amplicon (two fragments 135 and 110 pb) at avolume of 50 µl in the appropriate buffer, for 16 h. Visualization of the restriction fragments was done in 2–2.5%standard agarose gels.2.4. Cell Proliferation Assay and Caspase-3 Activity.3T3-L1 preadipocytes (1 104 cells/well) were incubatedovernight in the DMEM medium with 10% FBS in 96-wellplates. The 3T3-L1 cells were treated with lugol (0, 1, 10,50, 100, 200, 400, 800, and 1000 μm) for 0.5, 6, and 24 h.The growth was detected using the Thiazolyl Blue Tetrazolium Bromide (MTT) assay. MTT reagent was added tothe 96-well plate and incubated for 3 h at 37 C. Then, thesupernatant was gently eliminated, and 100 μl of DMSOwas added. The MTT-formazan product was measured byusing a plate reader (Epoch microplate, Biotek, Winooski,VT, USA) at λ 570 nm. Calculation of median inhibitoryconcentrations (IC50) was statistically analyzed byGraphPad Prism Version 6 software (GraphPad Software,2016). Nonlinear regressions of log (inhibitor) vs responsewith four parameters were selected for IC50 estimation.The bottom and top parameters were constrained to 0%and 100%. Caspase-3 activity was assessed using Caspase3 Colorimetric Assay Kit (BioVision Inc., ’sinstructions.
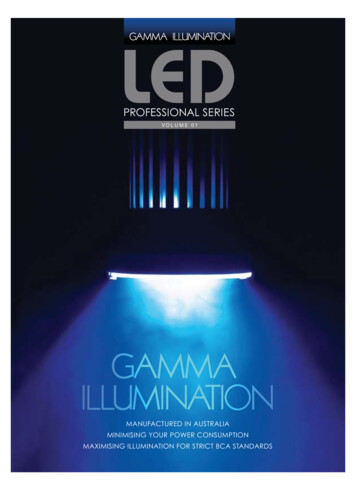
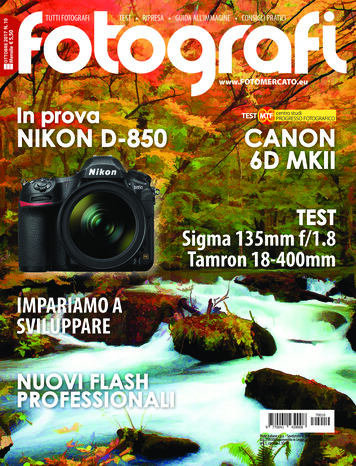
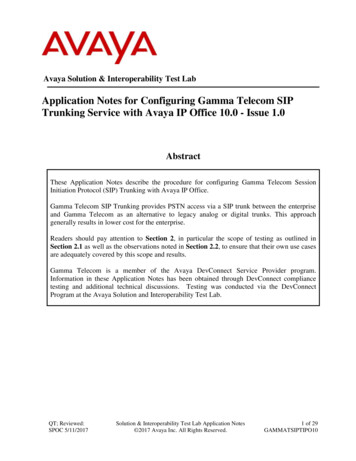
Journal of Nutrition and Metabolism2.5. Triglyceride and Glycerol Assay. After differentiation andtreatment with lugol in 24-well plates, 3T3-L1 adipocyteswere washed with PBS, scraped into 200 μl PBS, and thesuspension was centrifuged to 3500 rpm for 10 min. Intracellular triglycerides were quantified using a triglyceride kitaccording to the manufacturer’s instructions (Kit triglycerides Quantification, Biovision K622). The results wereexpressed as % of triglycerides compared to the control. Theamount of glycerol was measured by using a commercialLipolysis Assay kit (Abcam ab185424). Cellular proteincontent was analyzed using a Bradford protein assay kit(Bio-Rad). Data were expressed as mean SD.2.6. Western Blot Analysis. The cells are washed with ice-coldPBS 2 to 3 times, and RIPA lysis buffer (1% NP-40, 150 mMNaCl, 0.1% SDS, 50 mM Tris-HCl, pH 7.6, 10 mM EDTA,0.5% deoxycholate, 1 mM PMSF, 1 mM sodium orthovanadate, 10 mM NaF, 10 mM β-glycerophosphate, 10 μg/mLprotease inhibitor, and phosphatase inhibitor cocktails) wasadded to extract cell proteins for 5 min at 4 C. Equalamounts of protein of each sample were separated by sodiumdodecyl sulfate (SDS)-10% polyacrylamide gel electrophoresis (PAGE) and trans-blotted onto 0.2 µm nitrocellulosemembranes (Bio-Rad). Immunoblotting was performedwith antibodies for C/EBP-α (SC-61, Santa Cruz Biotechnologies), PPAR-c (D69), and β-actin (13E5) antibodiesfrom Cell Signaling Biotechnologies at 1–1000 dilutions in10% bovine serum albumin (BSA) in TBST overnight at 4 C.After three washes with TBST, secondary antibodies peroxidase horseradish were diluted (1 : 8000) in TBST containing 10% BSA and incubated for 1h at room temperature.The same blot was reprobed with β-actin antibody (SantaCruz Biotechnologies) after stripping as an internal control.Signals were visualized with enhanced Amersham ECLPrime Western Blotting (Thermo Fisher Scientific Inc.,México) according to the manufacturer’s instructions. Images were acquired with ChemiDoc XRS Imaging SystemBio-Rad. Densitometry was made with ImageJ 1.5i software,and data are expressed as relative protein units.2.7. Statistical Analysis. The data presented in all the figuresare mean standard deviation (SD) of independent experiments (n 3 to 5). In most cases, data from different experiments were normalized to the control value before beingcombined for statistical analyses. The data presented a normaldistribution, and in all cases, parametric analyses were done.Differences among several groups were determined usingone-way ANOVA followed by the Student–Newman–Keulstest using GraphPad Prism software (GraphPad Software Inc.,San Diego, CA). t-test was used for comparison between twogroups. P 0.05 was considered significant.3. Results3.1. Cell Proliferation and Median Lethal Dose.Figure 1(a) shows the levels of mRNA of iodide transportersNIS and PEN in fibroblasts and mature 3T3-L1 adipocytes.The representative electrophoresis shows that mature3adipocytes express both NIS and PEN mRNA iodinetransporters; the amplicons’ identity was determined byenzyme restriction digestion, and we got the expectedproducts. To assess the effect of lugol on proliferation andapoptosis, 3T3-L1 preadipocytes and mature adipocyteswere treated with 1 to 100 µm lugol for 0.5, 6, and 24 h.Lugol decreases cell viability in a concentration- and timedependent manner compared to control cells (Figure 1(b)).The lugol doses were increased from 1 to 1000 µm tocalculate the median lethal dose (LD50), and the resultsshow an LD50 of 420 µm (Figure 1(c)) at 24 h of treatment.Also, lugol increases caspase-3 activity at 10 and 100 µmdoses after 6 h of treatment (P 0.05). In contrast, it isobserved that lugol does not affect viability nor caspase-3activity in control fibroblasts with doses of 1–100 µm(Figure 1(d)).3.2. Effect of Lugol on Lipid Droplet Formation and Triglycerideand Glycerol Content in Mature 3T3-L1 Adipocytes.Differentiation of preadipocytes to mature adipocytes isassociated with an increase in the number of adipocytesstained with Oil Red O by accumulation of total lipids. Lugoltreatment inhibits lipid accumulation in adipocytes at100 µm for the first 30 min (P 0.05). After 6 and 24 h,adipocytes treated with lugol significantly reduced lipidaccumulation at concentrations of 1–100 µm (P 0.05)(Figure 2(a)). In Figure 2(b), it is shown that all concentrations of iodine (1–100 µm) reduce intracellular accumulation of triglycerides compared with untreatedadipocytes. Lugol at 10 and 100 µm reduces triglycerideaccumulation at 30 min of exposure by 30% at 10 µm and50% at 50 and 100 µm (P 0.01). However, at 24 h oftreatment, the intracellular triglyceride content is reducedwith doses from 5 µm of lugol (P 0.001 vs control adipocytes). In Figure 2(c), an increase in the amount ofglycerol released to the culture medium is observed in theadipocytes exposed to lugol although it was statisticallysignificant with concentrations of 100 µm at 30 min(P 0.05) and at 6 h with 10 and 100 µm (P 0.05), while at24 h of exposure with doses from 1 µm, it was statisticallysignificant (P 0.001 vs control).3.3. PPAR-y and C/EBP-α Expression in Mature 3T3-L1Adipocytes Exposed to Lugol. Previous reports indicate thatPPAR-c is required for activation of the lipolysis regulatorynetwork [27], and in transactivation assays, iodinated lipidshave high affinity to the PPAR-c transcription factor andcan induce PPAR-c gene expression [22]. When examiningPPAR-c expression in mature 3T3-L1 adipocytes treatedwith 1–100 µm lugol, the results indicate a significant increase in PPAR-c expression at doses of 10 µm (P 0.01)and 100 µm (P 0.001) at 30 min of treatment compared tocontrol adipocytes (Figure 3(a)). However, lugol treatmentafter 6 h does not affect PPAR-c expression in adipocytes(Figure 3(b)). On the other hand, C/EBP-α was downregulated from 5 µm of lugol at 30 min and 6 h(Figure 3(b)).
4Journal of Nutrition and Metabolismbp1234561507Cell viability (% control)30020010050125100 75 50 2500.5624Time (hours)ControlH2O2 100 mMLugol 1μm(a)(b)200LogIC50 0.49mMIC50 2.004mM100R2 0.9329500.20.40.6Log (lugol mM)0.81.0–50Caspase-3 activity (% control)Normalize of percentage (%)1500Lugol 10 μmLugol 100μm150 1005000.66Time (hours)ControlLugol 1μm(c) 24Lugol 10 μmLugol 100μm(d)Figure 1: Expression of mRNA iodide transporters and inhibitory effects of lugol on mature 3T3-L1 adipocytes’ growth. (a) Expression ofNIS and PEN mRNAs on undifferentiated and differentiated 3T3-L1 (mature adipocytes). Representative electrophoresis (one of the threeexperiments with similar results is shown). DNA ladder (1), NIS amplicon (2), NIS plus SmaI (3), PEN (4), PEN plus SacII (5), and GAPDHas internal control (6-7). (b) Mature 3T3-L1 adipocytes were treated with lugol (0, 1, 10, and 100 µM of lugol, n 9). Cell proliferation wasmonitored using the MTTassay (see method) at 0.5, 6, 24 h following lugol treatment. OD λ 570 value in mature 3T3-L1 adipocytes treatedwithout lugol was defined as 100%. P 0.05; P 0.01; P 0.01 compared with the control group (vehicle). (c) Dose-dependent effectsof lugol (0–1000 μg/mL) for 24 h to determine the acute cytotoxicity dose (IC50). (d) After 0.6, 6, and 24 h, cellular caspase-3 activity wasmeasured. Fold increase in activity was calculated based on activity measured in control (vehicle) cells. Each assay represents an independentexperiment performed in triplicate. Data are presented as mean SD. n 5. P 0.05, P 0.01, and P 0.01 vs vehicle cells.4. DiscussionThis study evaluated the ability of iodine to directly inducelipolysis in mature 3T31-L1 adipocytes. It has been previously reported that iodine uptake requires NIS and PENtransporters [28]. In this regard, previous studies havereported that adipose tissue expresses the iodine transporter NIS [23], which is in agreement with our resultswhere we show that only mature adipocytes express thetwo mRNA of NIS and PEN transporters. This study showsthat expression of NIS and PEN is regulated by transcription factors involved in adipocyte differentiation,such as the SREBP transcription factor [29, 30].Transcriptional upregulation of the NIS gene by SREBPcould be mediated by a functional binding site located inthe NIS 5′-flanking region, which is not necessary for TSHdependent NIS gene regulation. This indicates that regulation of the NIS gene by SREBP is important in extrathyroidal tissues that accumulate iodine and are not regulated by TSH [6].Our results showed that exposing mature adipocytesto different concentrations of iodine induces lipolyticactivity and accumulation of total lipids and triglycerides,and cell proliferation is reduced. These effects are accompanied by an increase in caspase-3 activity andglycerol release into the culture medium. These results
Journal of Nutrition and Metabolism5ControlLugol (1μm)Lugol (1μm)Lugol (1 μm)Lugol (1 μm)0.5h6h24h1.5OD (550 nm) 1.00.50.0 1.0 101000.50.0Control1510100Control15Lugol (μm)Lugol (μm)1.5OD (550nm)OD (550 nm)1.51.0 15101000.50.0ControlLugol (μm)(a)Figure 2: Continued.
6Journal of Nutrition and Metabolism400.8 0.6 0.4 0.20.00.56Time (hours)24Lugol 10 μmLugol 100 μmControlLugol 1μmLugol 5μm(b)Glycerol (μg/mL)Triglycerides (μg/μg protein)1.0 30 20 1000.56Time (hours)24Lugol 10μmLugol 100 μmControlLugol 1μmLugol 5μm(c)Figure 2: Effect of lugol on lipolysis in mature 3T3-L1 adipocytes. Mature 3T3-L1 adipocytes were treated in the serum-free medium with1–100 µM of lugol for 0.5, 6, and 24 h. (a) Micrographs of cells stained with Oil Red O and quantification; (b) triglyceride content and (c)lipolytic activity were measured from the amount of glycerol in the culture medium. Data are mean SD values from three experiments withtriplicate determination. P 0.05, P 0.01, and P 0.001 vs control (vehicle) cells (n 9). Scale bar is 100 µm.agree with those reported in mice fed with an iodinesupplemented diet, where the decrease in cholesterol andtriglycerides in the serum of mice fed with iodine-richdiet compared to unsupplemented mice was observed[31, 32].It has been established that iodine can act as a freeradical causing alterations in the cell membrane, and thisexplains the decrease in cell proliferation in our results. Inaccord, studies on cancer cell lines have revealed thatiodine exerts antiproliferative and apoptotic effectsthrough the BAX-caspase apoptotic pathway in breastcancer cell lines (MCF-7, MDA-MB-231, MDA-MB-453,ZR-75-1, and T-47D) with doses of 3 µm of moleculariodine [21, 33], as well as apoptosis in DMBA-inducedmammary gland tumors in the Wistar rat model [34, 35].In our study, we also observe increases in caspase-3 activity at doses of 10 and 100 µm, indicative of apoptosis. Incontrast, low iodine doses have antioxidant effects andprovide protection against oxidation although at highlevels, it can induce oxidative damage and behave like afree radical [36–38]. This could be involved with damageto membranes, iodinated lipid formation, and cellularapoptosis.The mechanism of action reported for iodine in othertissues involves the formation of iodolipids. These are ligands for the different PPAR isoforms, which by binding tospecific DNA sequences induce the expression of genesrelated to metabolic processes, including the expression ofPPAR-c [3, 22]. In mature 3T3-L1 adipocytes exposed torosiglitazone (PPAR-c agonist), glycerol release is increased,through increased fatty acid oxidation and oxidativephosphorylation [39]. In addition, the activation of PPAR-cby thiazolidinediones can decrease triglyceride content byincreasing enzymes such as acetyl-CoA oxidase, enoyl CoAhydratase, acyl CoA dehydrogenase, and carnitine palmitoyltransferase [40–42]. Intracellular lipases (LPS) have beenreported to have lipolytic function and are regulated byPPAR-c through their promoter region, which containselements responsive to PPAR-c [43]. In our study, PPAR-cincreases its expression after 30 min treatment with lugol,and it is probable that the formation of iodinated lipids in thefirst hours of treatment into mature adipocytes might regulate the expression of the PPAR-c gene, as it has beenreported in mammary cancer cells [21]. On the other hand,C/EBP-α regulates the expression of PPAR-c in adipocytes.Interestingly, our results contrast because lugol decreases C/EBP-α expression and increases PPAR-c expression. Afunctional antagonism is possible between C/EBP-α andPPAR-c, which favors PPAR-c and causes downregulationof C/EBP-α [44]. Regarding the decrease in PPAR-c and C/EBP-α after 6 h of treatment with lugol, it has been shownthat the antiobesity effect for seaweeds involves a reductionin the expression of CEBP-α and PPAR-c [45]. Moreover,CEBP-α and PPAR-c proteins have a short life ( 2.5 h) inadipocytes, and also ligand binding increases ubiquitinmodification and proteasomal degradation [46, 47].In conclusion, mature 3T3-L1 adipocytes express NISand PEN mRNAs, which are involved in iodine uptake.Moreover, mature adipocytes exposed to lugol decreased thecontent of total lipids and triglycerides, and an increase inglycerol release was induced, also an induction of lipolysisand caspase-3 activation through regulation of PPAR-α andC/EBP-α was found. Thus, iodine nutrition alterations maybe involved in the pathogenesis of obesity, suggesting thatiodine is important on the maintenance of proliferation/lipolysis balance in adipose tissue. However, more researchis required in order to know the exact mechanism of actionof iodine in adipocytes.
Journal of Nutrition and Metabolism757kDaC/EBP-α57 kDaPPAR-λβ-Actin45 kDaβ-Actin45kDa45kDa2.5Relative protein levelsRelative protein levels1.51.0 0.50.0Control15 10 1.51.00.50.0100 2.0Control1Lugol (μm)510100Lugol (μm)(a)57kDaC/EBP-α45kDa57/53 kDaPPAR-λ45 kDaβ-Actinβ-Actin45kDa1.51.0 Relative protein levelsRelative protein levels1.5 0.50.0Control15101.00.50.0100Control1Lugol (μm)510100Lugol (μm)(b)Figure 3: The effect of lugol on C/EBP-α and PPAR-c protein expression in mature 3T3-L1 adipocytes. The cells were treated with 0, 1, 10,and 100 µm of lugol for 30 min and 6 h and lysed in RIPA buffer for 1 h. The supernatant was subjected to SDS-PAGE. The blots were blockedand then were incubated with the primary and HRP-conjugated secondary antibodies. Detection was performed according to the enhancedchemiluminescence protocol. (a) 30 min after lugol treatment; (b) 6 h after lugol treatment. All quantitative data are mean SD (n 3/group). P 0.05 and P 0.01 vs. control (vehicle) adipocytes.Data AvailabilityThe datasets used and analyzed for this study are availablefrom the corresponding author upon reasonable request.Additional PointsHighlights. (i) Mature adipocytes exposed to lugol reducetotal lipids and triglycerides. (ii) Lugol induces lipolysis andincreases glycerol release. (iii) Lugol regulated PPARc andC/EBP-α protein expression. (iv) Lugol inhibits adipocyteproliferation through caspase-3 activation.Conflicts of InterestThe authors declare that they have no conflicts of interest.Authors’ ContributionsCR drafted the study design, carried out the data collection,data management, and data analysis, and wrote and revised
8the drafted manuscript. ZC and FM were involved in thedata analysis and revised the manuscript. SI was involved indata analysis and drafted the manuscript. All authors readand approved the final manuscript.AcknowledgmentsSergio Cuellar-Rufino was supported by graduate fellowships (297563) from CONACYT. The authors also wish tothank Irene Xochihua Rosas for her contribution inproofreading. This study had financial support from PublicHealth Institute POA 2019, Biomedical Research Center forfulfillment of the requirements for Cuellar-Rufino PhD POA2019, SIREI 36941-201360, CONACYT grant no. CB-201201-176513, and CONACYT Ciencia de Frontera.References[1] P. Singla, A. Bardoloi, and A. A. Parkash, “Metabolic effects ofobesity: A review,” World Journal of Diabetes, vol. 1, no. 3,pp. 76–88, 2010.[2] M. Coelho, T. Oliveira, and R. Fernandes, “Biochemistry ofadipose tissue: An endocrine organ,” Archives of MedicalScience, vol. 9, no. 2, pp. 191–200, 2013.[3] M. Ahmadian, J. M. Suh, N. Hah et al., “PPARc signaling andmetabolism: The good, the bad and the future,” NatureMedicine, vol. 19, no. 5, pp. 557–566, 2013.[4] D. Langin, A. Dicker, G. Tavernier et al., “Adipocyte lipasesand defect of lipolysis in human obesity,” Diabetes, vol. 54,no. 11, pp. 3190–3197, 2005.[5] S. Millership, N. Ninkina, I. A. Guschina et al., “Increasedlipolysis and altered lipid homeostasis protect -synuclein-nullmutant mice from diet-induced obesity,” Proceedings of theNational Academy of Sciences, vol. 109, no. 51, pp. 20943–20948, 2012.[6] S. Morrison and S. L. McGee, “3T3-L1 adipocytes displayphenotypic characteristics of multiple adipocyte lineages,”Adipocyte, vol. 4, no. 4, pp. 295–302, 2015.[7] K. A. Lo, A. Labadorf, N. J. Kennedy et al., “Analysis of in vitroinsulin-resistance models and their physiological relevance toin vivo diet-induced adipose insulin resistance,” Cell Reports,vol. 5, no. 1, pp. 259–270, 2013.[8] C. Han, P. Mauriège, P. Imbeault et al., “Hyperleptinemia ismore closely associated with adipose cell hypertrophy thanwith adipose tissue hyperplasia,” International Journal ofObesity, vol. 24, no. 6, pp. 782–788, 2000.[9] D. A. Roncari, “Hormonal influences on the replication andmaturation of adipocyte precursors,” International Journal ofObesity, vol. 5, no. 6, pp. 547–552, 1981.[10] T. Tsujita, C. Morimoto, and H. Okuda, “Mechanism of increase in basal lipolysis of enlarged adipocytes in obese animals,” Obesity Research, vol. 3, no. S5, pp. 633S–636S, 1995.[11] E. D. Rosen and B. M. Spiegelman, “Molecular regulation ofadipogenesis,” Annual Review of Cell and DevelopmentalBiology, vol. 16, no. 1, pp. 145–171, 2000.[12] E. D. Rosen, C. J. Walkey, P. Puigserver, andB. M. Spiegelman, “Transcriptional regulation of adipogenesis,” Genes & Development, vol. 14, no. 11,pp. 1293–1307, 2000.[13] C. Boone, J. Mourot, F. Grégoire, and C. Remacle, “Theadipose conversion process: Regulation by extracellular andintracellular factors,” Reproduction Nutrition Development,vol. 40, no. 4, pp. 325–358, 2000.Journal of Nutrition and Metabolism[14] M. M. Ramirez Alvarado and C. Sanchez Roitz, “Tumornecrosis factor-alpha, insulin resistance, the lipoproteinmetabolism and obesity in humans,” Nutricion Hospitalaria,vol. 27, no. 6, pp. 1751–1757, 2012.[15] E. D. Rosen, “The transcriptional basis of adipocyte development,” Prostaglandins, Leukotrienes and Essential FattyAcids, vol. 73, no. 1, pp. 31–34, 2005.[16] C. Wan-Loy and P. Siew-Moi, “Marine algae as a potentialsource for anti-obesity agents,” Marine Drugs, vol. 14, no. 12,2016.[17] C. Juárez-Portilla, T. Olivares-Bañuelos, T. Molina-Jiménezet al., “Seaweeds-derived compounds modulating effects onsignal transduction pathways: A systematic review,” Phytomedicine, vol. 63, Article ID 153016, 2019.[18] P. Cherry, C. O’Hara, P. J. Magee, E. M. McSorley, andP. J. Allsopp, “Risks and benefits of consuming edible seaweeds,” Nutrition Reviews, vol. 77, no. 5, pp. 307–329, 2019.[19] C. Aceves, P. Garcı́a-Solı́s, O. Arroyo-Helguera, L. VegaRiveroll, G. Delgado, and B. Anguiano, “Antineoplastic effectof iodine in mammary cancer: participation of 6-iodolactone(6-IL) and peroxisome proliferator-activated receptors(PPAR),” Molecular Cancer, vol. 8, no. 1, p. 33, 2009.[20] O. Arroyo-Helguera, B. Anguiano, G. Delgado, and C. Aceves,“Uptake and antiproliferative effect of molecular iodine in theMCF-7 breast cancer cell line,” Endocrine-Related Cancer,vol. 13, pp. 1147–1158, 2006.[21] O. Arroyo-Helguera, E. Rojas, G. Delgado, and C. Aceves,“Signaling pathways involved in the antiproliferative effect ofmolecular iodine in normal and tumoral breast cells: Evidencethat 6-iodolactone mediates apoptotic effects,” EndocrineRelated Cancer, vol. 15, no. 4, pp. 1003–1011, 2008.[22] R. E. Nuñez-Anita, O. Arroyo-Helguera, M. Cajero-Juárez,L. López-Bojorquez, and C. Aceves
verse 5′CAGTTACAGCTGCCATA and amplicon size 134pb; PEN, forward 5′GAACTCCGGAGCCCAAACAG andreverse5′GGCTCCGACCTGCCGandampliconsize 245pb. e amplification product was visualized in 2% agarose (Sigma) in 0.5 TBE (0.045 M Tris-borate and 0.001 M EDTA) stained with ethidium bromide. e amplicon concentration was estimated and 500ng was