Transcription
UCLA Graduate Programs2001-2002 Annual ReportOffice of Graduate StudiesClaudia Mitchell-KernanVice Chancellor Graduate Studiesand Dean, Graduate DivisionAlbert C. SettonAssistant Vice ChancellorAnnual ReportAngela JamesAssistant DeanDirector Institutional Research & Information ServicesEllen StolzenbergInstitutional ResearchDhanalakshmi ThirumalaiInstitutional ResearchJanice LoveInstitutional ResearchKenneth HillInformation Resources ManagerMary WatkinsPublications ManagerMaily ChuPublications Assistant
INTRODUCTIONWelcome to the 24th edition of the Annual Report of GraduateEducation at UCLA! This Annual Report describes the activitiesof the UCLA Graduate Division, provides information about thegraduate programs, graduate students, postdoctoral and visitingscholars, and highlights some of the issues of concern during the2001-2002 academic year.The organization of graduate education at UCLA is somewhatunique compared to other institutions. The Graduate Divisionoverseas all graduate programs except those leading to the “firstprofessional degree”, specifically, the DDS degree and Post DDScertificate in the School of Dentistry, the LLM and JD degrees in theSchool of Law, and the MD degree in the School of Medicine. TheGraduate Division relates to all areas of the campus including thegraduate programs under the College of Letters and Sciences, theMS and PhD programs in the Schools of Dentistry and Medicine,and the academic and professional programs in the followingprofessional schools: Anderson Graduate School of Management,Arts & Architecture, Graduate School of Education and InformationStudies, Henry Samueli School of Engineering and Applied Science,Nursing, Public Health, Public Policy and Social Research, andTheater, Film and Television. However, the joint appointmentof the Dean as the Vice Chancellor for Graduate Studies includesresponsibility for issues affecting graduate education for all sectorsof the UCLA campus. Therefore, the presentation of the datain this Annual Report includes, where appropriate, data on allgraduate programs, whether part of the Graduate Division or not.Throughout the report, we have indicated whether the data refersto all graduate programs or specifically to those monitored by theGraduate Division.UCLA GRADUATE PROGRAMS ANNUAL REPORT 2001-2002The 2001-02 Annual Report is intended to summarize events of thepast year, to present trends and to define issues and problems facinggraduate education at UCLA. It is not intended to be an exhaustivepresentation of all available data, but is instead focused on selectedmajor indicators. We hope that the 2001-02 Annual Report willbe used, by those who manage graduate education, as well as inindividual graduate programs, to stimulate further analysis of thedata and discussions of issues throughout the community of thoseinterested in graduate education.Any comments are welcomed, and may be addressed to: Angela James,PhD, Assistant Dean Academic Initiatives, Director of InstitutionalResearch and Information Services, 1237 Murphy Hall, Box 951419,Los Angeles, CA 90095 or via email: ajames@gdnet.ucla.edu.Introduction
SECTION I.Admissions
SECTION 1: ADMISSIONSTABLE 1-1. Graduate Division Applications, Admissions, New and Total RegistrantsFall Terms 1992 through 2001FALL TERMAPPLICATIONSNumberAnnual %ChangeADMITSNumberNEW REGISTRANTSAnnual %ChangeNumberAnnual %ChangeTOTAL REGISTRANTSNumberAnnual 38-3.06%2,4363.26%7,7932.19%% Change 1992-018.96%-5.21%4.73%-3.66%Avg Annual %Change 1992-011.32%-0.28%-0.31%-0.83%NOTE: Excludes Special Fee ProgramsSources: UCLA Graduate Admissions System and UCLA Student Records SystemUCLA GRADUATE PROGRAMS ANNUAL REPORT 2001-2002Section 1 - 1
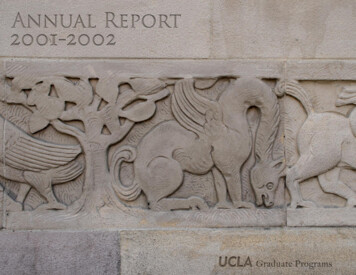
SECTION 1: ADMISSIONSFIGURE 1-2. Graduate Division Applicants, Admits, New and Total Registrants:Fall Terms 1992 Through 8,000Total Registrants6,000Admits4,0002,0000New 424,5914,6264,4385,1975,038New 52,3592,436Total 47,6267,793UCLA GRADUATE PROGRAMS ANNUAL REPORT 2001-2002Section 1 - 2
SECTION 1: ADMISSIONSTABLE 1-3. Applications, Admissions, and Enrollments by Student Characteristics: Fall 2001UNDERREP MINORITYNumber% of TotalDOMESTICINTERNATIONALFEMALEMALENumber% of TotalNumber% of TotalNumber% of TotalNumber% of TotalTotalTotal Graduate Division (exluding special fee 50329.8%2,52450.1%2,51449.9%5038New 0.8%7793Total RegsTotal Graduate Division (including special fee ,51728.1%2,63648.9%2,75351.1%5389New ,36352.4%2599Total RegsLetters & ScienceNew RegsTotal 8%8637.2%231New Regs99.1%7979.8%2020.2%6464.6%3535.4%99Total ied Linguistics & TESL .1%105Admits312.5%1562.5%937.5%2083.3%416.7%24New Regs220.0%550.0%550.0%990.0%110.0%10Total %650.0%1083.3%216.7%12New Regs114.3%457.1%342.9%685.7%114.3%7Total Regs35.8%3567.3%1732.7%3771.2%1528.8%52Applied LinguisticsApplied Linguistics & its216.7%975.0%325.0%1083.3%216.7%12New Regs133.3%133.3%266.7%3100.0%00.0%3Total Regs17.7%1076.9%323.1%13100.0%00.0%13UCLA GRADUATE PROGRAMS ANNUAL REPORT 2001-2002Section 1 - 3
SECTION 1: ADMISSIONSTABLE 1-3. Applications, Admissions, and Enrollments by Student Characteristics: Fall 2001UNDERREP MINORITYDOMESTICINTERNATIONALFEMALEMALENumber% of TotalNumber% of TotalNumber% of TotalNumber% of TotalNumber% of .5%91Admits27.7%2284.6%415.4%2180.8%519.2%26New Regs111.1%777.8%222.2%888.9%111.1%9Total 00.0%650.0%650.0%12New Regs00.0%4100.0%00.0%250.0%250.0%4Total 0.0%650.0%650.0%12New Regs00.0%4100.0%00.0%250.0%250.0%4Total --0---0Art HistoryClassics DepartmentClassicsGreekNew Regs0---0---0---0---0---0Total ew Regs0---0---0---0---0---0Total %628.6%21New Regs218.2%11100.0%00.0%763.6%436.4%11Total %866.7%866.7%433.3%12New Regs00.0%466.7%233.3%466.7%233.3%6Total Regs23.5%4273.7%1526.3%3764.9%2035.1%57Comparative LiteratureEast Asian Languages & CultureUCLA GRADUATE PROGRAMS ANNUAL REPORT 2001-2002Section 1 - 4
SECTION 1: ADMISSIONSTABLE 1-3. Applications, Admissions, and Enrollments by Student Characteristics: Fall 2001UNDERREP MINORITYDOMESTICNumber% of TotalNumberINTERNATIONALFEMALEMALE% of TotalNumber% of TotalNumber% of TotalNumber% of 541.7%36New Regs00.0%12100.0%00.0%1083.3%216.7%12Total -0---0---0---0---0Admits0---0---0---0---0---0New Regs0---0---0---0---0---0Total Regs112.5%8100.0%00.0%787.5%112.5%8Folklore & MythologyFrench & Francophone Studies(Includes Admits19.1%1090.9%19.1%11100.0%00.0%11New Regs00.0%4100.0%00.0%4100.0%00.0%4Total 222.2%444.4%555.6%9New Regs116.7%466.7%233.3%350.0%350.0%6Total 14.3%228.6%571.4%7New Regs125.0%375.0%125.0%125.0%375.0%4Total %2100.0%00.0%2New Regs00.0%150.0%150.0%2100.0%00.0%2Total 0%3100.0%3New Regs00.0%150.0%150.0%00.0%2100.0%2Total Regs222.2%777.8%222.2%111.1%888.9%9Germanic Languages DepartmentGermanic LanguagesScandinavianIndo-European StudiesUCLA GRADUATE PROGRAMS ANNUAL REPORT 2001-2002Section 1 - 5
SECTION 1: ADMISSIONSTABLE 1-3. Applications, Admissions, and Enrollments by Student Characteristics: Fall 2001UNDERREP MINORITYDOMESTICINTERNATIONALFEMALENumber% of TotalNumber% of TotalNumber% of 83.3%116.7%New Regs00.0%1100.0%0Total Regs215.4%753.8%Applicants10.9%43Admits14.8%14New Regs114.3%Total Regs4MALE% of TotalNumber% of %2253.7%41Admits112.5%8100.0%00.0%450.0%450.0%8New Regs00.0%7100.0%00.0%457.1%342.9%7Total 0%00.0%650.0%650.0%12New Regs00.0%4100.0%00.0%125.0%375.0%4Total Regs13.6%2485.7%414.3%932.1%1967.9%28Near Eastern Languages & 4New Regs00.0%685.7%114.3%342.9%457.1%7Total %150.0%150.0%2New Regs00.0%2100.0%00.0%150.0%150.0%2Total 1100.0%00.0%1New Regs0---0---0---0---0---0Total Regs00.0%1575.0%525.0%1680.0%420.0%20Romance Linguistics & LiteratureSlavic Languages & LiteratureUCLA GRADUATE PROGRAMS ANNUAL REPORT 2001-2002Section 1 - 6
SECTION 1: ADMISSIONSTABLE 1-3. Applications, Admissions, and Enrollments by Student Characteristics: Fall 2001UNDERREP MINORITYDOMESTICINTERNATIONALFEMALEMALENumber% of TotalNumber% of TotalNumber% of TotalNumber% of TotalNumber% of TotalTotalSpanish & Portuguese 1.7%41Admits646.2%861.5%538.5%1076.9%323.1%13New Regs228.6%342.9%457.1%571.4%228.6%7Total 6%571.4%571.4%228.6%7New Regs120.0%120.0%480.0%360.0%240.0%5Total w Regs0---0---0---0---0---0Total Regs00.0%1100.0%00.0%00.0%1100.0%125Hispanic Languages & 16.7%6New Regs150.0%2100.0%00.0%2100.0%00.0%2Total 6%1625.4%3961.9%2438.1%63New Regs1641.0%3179.5%820.5%2666.7%1333.3%39Total 0.6%529.4%1164.7%635.3%17New Regs327.3%872.7%327.3%763.6%436.4%11Total 85.7%114.3%7New Regs00.0%583.3%116.7%583.3%116.7%6Total Regs00.0%583.3%116.7%583.3%116.7%6International InstituteAfrican StudiesEast Asian StudiesUCLA GRADUATE PROGRAMS ANNUAL REPORT 2001-2002Section 1 - 7
SECTION 1: ADMISSIONSTABLE 1-3. Applications, Admissions, and Enrollments by Student Characteristics: Fall 2001UNDERREP MINORITYDOMESTICINTERNATIONALFEMALEMALENumber% of TotalNumber% of TotalNumber% of TotalNumber% of TotalNumber% of -0---0---0---0---0New Regs0---0---0---0---0---0Total .4%1025.6%2256.4%1743.6%39New Regs1359.1%1881.8%418.2%1463.6%836.4%22Total Islamic StudiesLatin American StudiesLife Admits96.4%12488.6%1611.4%8460.0%5640.0%140New 8.6%1951.4%37New Regs15.0%1785.0%315.0%1260.0%840.0%20Total 3%133.3%266.7%3New Regs00.0%150.0%150.0%150.0%150.0%2Total ---0---0---0---0Admits0---0---0---0---0---0New Regs0---0---0---0---0---0Total %00.0%428.6%1071.4%14New Regs00.0%4100.0%00.0%125.0%375.0%4Total Regs38.8%3397.1%12.9%1544.1%1955.9%34Total RegsBiologyMolecular, Cellular, & Integrative PhysiologyMolecular BiologyMolecular, Cell, & Developmental BiologyUCLA GRADUATE PROGRAMS ANNUAL REPORT 2001-2002Section 1 - 8
SECTION 1: ADMISSIONSTABLE 1-3. Applications, Admissions, and Enrollments by Student Characteristics: Fall 2001UNDERREP MINORITYDOMESTICINTERNATIONALFEMALEMALENumber% of TotalNumber% of TotalNumber% of TotalNumber% of TotalNumber% of .2%38Admits315.0%1995.0%15.0%1260.0%840.0%20New Regs323.1%1292.3%17.7%646.2%753.8%13Total l 1725.8%66New Regs12.9%2982.9%617.1%2777.1%822.9%35Total 388.3%34675.2%11424.8%13830.0%32270.0%460New Regs1610.5%11475.0%3825.0%3825.0%11475.0%152Total %1131.4%2468.6%1748.6%1851.4%35New Regs19.1%545.5%654.5%654.5%545.5%11Total .4%15192.1%137.9%4728.7%11771.3%164New Regs1221.4%4885.7%814.3%1119.6%4580.4%56Total -0New Regs0---0---0---0---0---0Total Regs250.0%4100.0%00.0%250.0%250.0%4Physical SciencesAtmospheric SciencesChemistry & Biochemistry DepartmentBiochemistryBiochemistry & Molecular 4%96Admits412.9%2890.3%39.7%1032.3%2167.7%31New Regs216.7%1083.3%216.7%216.7%1083.3%12Total Regs99.3%7880.4%1919.6%2929.9%6870.1%97UCLA GRADUATE PROGRAMS ANNUAL REPORT 2001-2002Section 1 - 9
SECTION 1: ADMISSIONSTABLE 1-3. Applications, Admissions, and Enrollments by Student Characteristics: Fall 2001UNDERREP MINORITYDOMESTICINTERNATIONALFEMALEMALENumber% of TotalNumber% of TotalNumber% of TotalNumber% of TotalNumber% of %133New Regs1022.7%3886.4%613.6%920.5%3579.5%44Total 1694.1%15.9%952.9%847.1%17New Regs00.0%685.7%114.3%457.1%342.9%7Total 0%150.0%150.0%2New Regs0---0---0---0---0---0Total .0%654.5%545.5%11New Regs00.0%4100.0%00.0%250.0%250.0%4Total 5.0%250.0%250.0%4New Regs00.0%266.7%133.3%266.7%133.3%3Total h and Space SciencesGeochemistryGeologyGeophysics & Space 9076.3%118New Regs24.7%3376.7%1023.3%920.9%3479.1%43Total Regs63.9%11272.7%4227.3%3522.7%11977.3%154Physics & Astronomy 5New Regs14.8%1571.4%628.6%29.5%1990.5%21Total Regs53.9%9070.9%3729.1%2418.9%10381.1%127UCLA GRADUATE PROGRAMS ANNUAL REPORT 2001-2002Section 1 - 10
SECTION 1: ADMISSIONSTABLE 1-3. Applications, Admissions, and Enrollments by Student Characteristics: Fall 2001UNDERREP MINORITYDOMESTICINTERNATIONALFEMALEMALENumber% of TotalNumber% of TotalNumber% of TotalNumber% of TotalNumber% of .0%50Admits00.0%866.7%433.3%433.3%866.7%12New Regs00.0%1100.0%00.0%00.0%1100.0%1Total 7.1%2432.9%1216.4%6183.6%73New Regs15.0%1470.0%630.0%210.0%1890.0%20Total .2%2048.8%2151.2%2048.8%41New Regs00.0%750.0%750.0%642.9%857.1%14Total ysicsStatisticsSocial 251.2%512New --0Total RegsAfrican Area StudiesNew Regs0---0---0---0---0---0Total Regs330.0%440.0%660.0%550.0%550.0%10Afro-American 15Admits457.1%7100.0%00.0%571.4%228.6%7New Regs360.0%5100.0%00.0%360.0%240.0%5Total Regs1178.6%14100.0%00.0%857.1%642.9%14American Indian %26Admits969.2%1184.6%215.4%861.5%538.5%13New Regs675.0%8100.0%00.0%562.5%337.5%8Total Regs1777.3%22100.0%00.0%1359.1%940.9%22UCLA GRADUATE PROGRAMS ANNUAL REPORT 2001-2002Section 1 - 11
SECTION 1: ADMISSIONSTABLE 1-3. Applications, Admissions, and Enrollments by Student Characteristics: Fall 2001UNDERREP MINORITYDOMESTICINTERNATIONALFEMALEMALENumber% of TotalNumber% of TotalNumber% of TotalNumber% of TotalNumber% of 2%736.8%19New Regs00.0%685.7%114.3%457.1%342.9%7Total 22.2%666.7%333.3%9New Regs00.0%360.0%240.0%360.0%240.0%5Total 0%320.0%1280.0%320.0%15New Regs327.3%1090.9%19.1%872.7%327.3%11Total ian American 1062.5%176New Regs00.0%618.2%2781.8%721.2%2678.8%33Total .8%1445.2%1858.1%1341.9%31New Regs00.0%545.5%654.5%436.4%763.6%11Total 5%9076.9%2723.1%5748.7%6051.3%117New Regs49.8%3380.5%819.5%2356.1%1843.9%41Total aphyHistoryPolitical w Regs213.3%1173.3%426.7%426.7%1173.3%15Total Regs97.8%9179.1%2420.9%3732.2%7867.8%115UCLA GRADUATE PROGRAMS ANNUAL REPORT 2001-2002Section 1 - 12
SECTION 1: ADMISSIONSTABLE 1-3. Applications, Admissions, and Enrollments by Student Characteristics: Fall 2001UNDERREP MINORITYDOMESTICINTERNATIONALFEMALEMALENumber% of TotalNumber% of TotalNumber% of TotalNumber% of TotalNumber% of 1%2142.9%49New Regs419.0%1571.4%628.6%1571.4%628.6%21Total Regs2120.0%8883.8%1716.2%6864.8%3735.2%105Women's dmits222.2%9100.0%00.0%9100.0%00.0%9New Regs00.0%4100.0%00.0%4100.0%00.0%4Total Regs112.5%8100.0%00.0%8100.0%00.0%8UCLA Access 114New Regs58.9%4885.7%814.3%2748.2%2951.8%56Total 5.0%250.0%250.0%4New 0.0%00.0%1Admits00.0%00.0%1100.0%1100.0%00.0%1New Regs00.0%00.0%1100.0%1100.0%00.0%1Total .0%133.3%266.7%3New Regs133.3%3100.0%00.0%133.3%266.7%3Total Regs616.2%3594.6%25.4%1951.4%1848.6%37Basic Biomedical ScienceTotal RegsMicrobiology & ImmunologyMicrobiology & Molecular GeneticsGeneral Campus Professional .1%1,27345.2%1,54354.8%2816New Total 3873UCLA GRADUATE PROGRAMS ANNUAL REPORT 2001-2002Section 1 - 13
SECTION 1: ADMISSIONSTABLE 1-3. Applications, Admissions, and Enrollments by Student Characteristics: Fall 2001UNDERREP MINORITYNumberDOMESTICINTERNATIONALFEMALEMALE% of TotalNumber% of TotalNumber% of TotalNumber% of TotalNumber% of TotalTotalArts and Architecture 51.4%313New Regs1913.2%11479.2%3020.8%6746.5%7753.5%144Total ts189.0%12964.8%7035.2%8341.7%11658.3%199New Regs79.9%5273.2%1926.8%2433.8%4766.2%71Total ew Regs14.5%1986.4%313.6%1568.2%731.8%22Total Regs48.0%4284.0%816.0%2958.0%2142.0%50Design Media Arts 5.8%123Admits222.2%666.7%333.3%666.7%333.3%9New Regs233.3%350.0%350.0%466.7%233.3%6Total 0---0---0---0---0Admits0---0---0---0---0---0New Regs0---0---0---0---0---0Total Regs00.0%133.3%266.7%133.3%266.7%3DesignDesign Media 3Admits222.2%666.7%333.3%666.7%333.3%9New Regs233.3%350.0%350.0%466.7%233.3%6Total 212.5%1168.8%531.3%16New Regs114.3%685.7%114.3%571.4%228.6%7Total logyUCLA GRADUATE PROGRAMS ANNUAL REPORT 2001-2002Section 1 - 14
SECTION 1: ADMISSIONSTABLE 1-3. Applications, Admissions, and Enrollments by Student Characteristics: Fall 2001UNDERREP MINORITYDOMESTICINTERNATIONALFEMALEMALENumber% of TotalNumber% of TotalNumber% of TotalNumber% of TotalNumber% of .9%52New Regs413.8%2689.7%310.3%1241.4%1758.6%29Total Regs1111.6%7983.2%1616.8%3941.1%5658.9%95Worlds Arts and 4%78Admits430.8%1292.3%17.7%1184.6%215.4%13New Regs444.4%888.9%111.1%777.8%222.2%9Total 0.0%360.0%240.0%5New Regs00.0%3100.0%00.0%133.3%266.7%3Total 12.5%8100.0%00.0%8New Regs466.7%583.3%116.7%6100.0%00.0%6Total 75.7%10224.3%419New Regs8732.3%25695.2%134.8%19672.9%7327.1%269Total Culture & PerformanceEducation & Information Studies SchoolNew RegsTotal RegsEducationLibrary and Information .6%161Admits88.2%8081.6%1818.4%7980.6%1919.4%98New Regs612.0%4488.0%612.0%4692.0%48.0%50Total Regs2414.0%15791.8%148.2%14383.6%2816.4%171UCLA GRADUATE PROGRAMS ANNUAL REPORT 2001-2002Section 1 - 15
SECTION 1: ADMISSIONSTABLE 1-3. Applications, Admissions, and Enrollments by Student Characteristics: Fall 2001UNDERREP MINORITYDOMESTICINTERNATIONALNumber% of TotalNumber% of TotalApplicants00.0%3Admits0---0Number% of Total50.0%3---0FEMALEMALENumber% of TotalNumber% of Total50.0%6---0Total100.0%00.0%6---0---0Special Education / CSULANew Regs0---0---0---0---0---0Total .4%42540.8%61659.2%22021.1%82178.9%1041New Regs215.8%17548.3%18751.7%7721.3%28578.7%362Total 2.7%6155.0%5045.0%4742.3%6457.7%111New Regs12.4%2458.5%1741.5%2356.1%1843.9%41Total 53.7%1946.3%1126.8%3073.2%41New Regs00.0%1155.0%945.0%525.0%1575.0%20Total 4333.3%8666.7%3426.4%9573.6%129New Regs617.6%1647.1%1852.9%1235.3%2264.7%34Total Regs88.3%5153.1%4546.9%2829.2%6870.8%96Engineering & Applied Science SchoolBiomedical EngineeringChemical EngineeringCivil EngineeringComputer 16New Regs67.7%3848.7%4051.3%1012.8%6887.2%78Total ical %29581.9%360New Regs53.8%5542.3%7557.7%2116.2%10983.8%130Total Regs143.4%18745.6%22354.4%5312.9%35787.1%410UCLA GRADUATE PROGRAMS ANNUAL REPORT 2001-2002Section 1 - 16
SECTION 1: ADMISSIONSTABLE 1-3. Applications, Admissions, and Enrollments by Student Characteristics: Fall 2001UNDERREP MINORITYNumberDOMESTICINTERNATIONAL% of TotalNumber% of TotalNumber% of TotalFEMALEMALENumber% of TotalNumber% of TotalTotalIntegrated Manufacturing 2Admits0---0---0---0---0---0New Regs0---0---0---0---0---0Total 71.1%45New Regs00.0%17.7%1292.3%430.8%969.2%13Total 48.9%7151.1%1812.9%12187.1%139New Regs36.5%3065.2%1634.8%24.3%4495.7%46Total .9%1337.1%12.9%3497.1%35New Regs00.0%880.0%220.0%00.0%10100.0%10Total .1%5856.9%1615.7%8684.3%102New Regs38.3%2261.1%1438.9%25.6%3494.4%36Total 00.0%150.0%150.0%2New Regs0---0---0---0---0---0Total Regs00.0%150.0%150.0%00.0%2100.0%2Materials Science and EngineeringMechanical and Aerospace EngineeringAerospace EngineeringMechanical EngineeringManufacturing EngineeringManagement School (Includes Full Time MBA and .9%24870.1%354New Regs257.4%24672.6%9327.4%10230.1%23769.9%339Total Regs486.7%51772.5%19627.5%20729.0%50671.0%713UCLA GRADUATE PROGRAMS ANNUAL REPORT 2001-2002Section 1 - 17
SECTION 1: ADMISSIONSTABLE 1-3. Applications, Admissions, and Enrollments by Student Characteristics: Fall 2001UNDERREP MINORITYNumberDOMESTICINTERNATIONALFEMALEMALE% of TotalNumber% of TotalNumber% of TotalNumber% of TotalNumber% of TotalTotalPublic Policy and Social Research 9280.0%2320.0%7867.8%3732.2%115New Regs822.2%2980.6%719.4%2466.7%12
Arts & Architecture, Graduate School of Education and Information Studies, Henry Samueli School of Engineering and Applied Science, Nursing, Public Health, Public Policy and Social Research, and Theater, Film and Television. However, the joint appointment of the Dean as the Vice Chancellor for Graduate Studies includes responsibility for issues .