Transcription
NEW HAMPSHIREFebruary 2013
NEW HAMPSHIRENCCI’s Medical Data Report and its content are intended to be used as a reference tool and for informational purposes only. No further use,dissemination, sale, assignment, reproduction, preparation of derivative works, or other disposition of this report or any part thereof may bemade without the prior written consent of NCCI.NCCI’s Medical Data Report is provided “as is” and includes data and information available at the time of publication only. NCCI makes norepresentations or warranties relating to this report, including any express, statutory, or implied warranties including the implied warranty ofmerchantability and fitness for a particular purpose. Additionally, NCCI does not assume any responsibility for your use of, and for any and allresults derived or obtained through, the report. No employee or agent of NCCI or its affiliates is authorized to make any warranties of any kindregarding this report. Any and all results, conclusions, analyses, or decisions developed or derived from, on account of, or through your use ofthe report are yours; NCCI does not endorse, approve, or otherwise acquiesce in your actions, results, analyses, or decisions, nor shall NCCI orother contributors to the Medical Data Report have any liability thereto.i
NEW HAMPSHIREIntroductionMedical costs have consistently been on the rise over the last 30 years. Today, in many states,close to 60% of workers compensation benefits are attributed to medical costs. The rising cost ofmedical care is the major issue facing workers compensation stakeholders now and in theforeseeable future. The availability of medical data on workers compensation claims is essentialfor analyses of issues such as the pricing of proposed state legislation, impacts to medical feeschedules, and research.This publication is a data source for regulators and others who may be interested in theincreasing medical costs in workers compensation claims. The information in this report providesimportant benchmarks against which cost containment strategies may be measured and givesvaluable insight into the medical cost drivers that threaten the financial soundness of theworkers compensation system.Knowing how payments for different services contribute to workers compensation medicalbenefit costs provides insight into the growth of medical benefits. This report illustrates thebreakdown of services by category, namely: PhysicianHospitalAmbulatory Surgical CentersDrugsDurable Medical Equipment (DME), Supplies, and ImplantsOtherNext, the report drills down into these categories to demonstrate which particular proceduresrepresent the greatest share of payments and which are performed the most.Additionally, this report provides detail on payments for prescription drugs including which drugsare being prescribed the most and which ones represent the greatest share of drug payments,as well as information on repackaged drugs.One important caveat: information in this report may not coincide with an analysis of a medicalfee schedule change performed in the future. An analysis of a medical fee schedule changerequires evaluation of the specific procedures covered by the fee schedule, which may bedifferent from how payments are categorized in this report.Additional information regarding the data underlying this report is described in more detail in theappendix.ii
NEW HAMPSHIRETable of ContentsMedical Share of Total Benefit Costs . 1Overall Medical Average Cost per Case . 2Percentage of Medical Paid by Claim Maturity . 3Distribution of Medical Payments . 4Distribution of Physician Payments by AMA Service Category . 6Top 10 Surgery Procedure Codes by Amount Paid for New Hampshire. 8Top 10 Surgery Procedure Codes by Transaction Counts for New Hampshire . 9Top 10 Radiology Procedure Codes by Amount Paid for New Hampshire . 10Top 10 Radiology Procedure Codes by Transaction Counts for New Hampshire . 11Top 10 Medicine Procedure Codes by Amount Paid for New Hampshire . 12Top 10 Medicine Procedure Codes by Transaction Counts for New Hampshire . 13Top 10 Evaluation and Management Procedure Codes by Amount Paid for New Hampshire . 14Top 10 Evaluation and Management Procedure Codes by Transaction Counts for New Hampshire . 16Distribution of Payments by Facility Type . 18Top 10 Procedure Codes by Amount Paid for Inpatient Hospital Services for New Hampshire . 20Top 10 Procedure Codes by Amount Paid for Outpatient Hospital Services for New Hampshire . 21Top 10 Procedure Codes by Amount Paid for Ambulatory Surgical Center Services for New Hampshire . 22Top 10 Drugs by Amount Paid for New Hampshire . 23Top 10 Drugs by Amount Paid for Countrywide . 23Top 10 Drugs by Prescription Counts for New Hampshire . 24Top 10 Drugs by Prescription Counts for Countrywide . 24Distribution of Drugs by Brand Name and Generic . 25Distribution of Drug Payments . 26Distribution of Payments by DME, Supplies, and Implants . 28Glossary . 30APPENDIX . 31iii
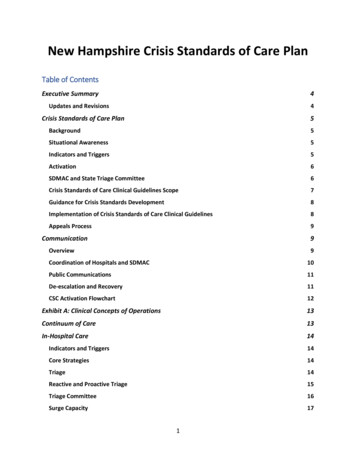
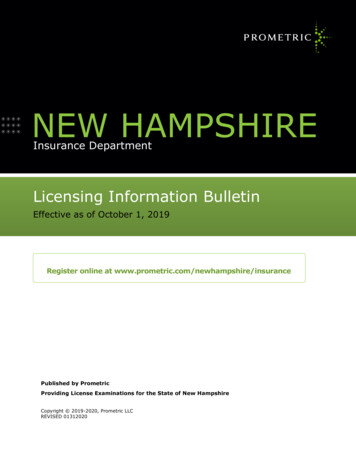
NEW HAMPSHIREWorkers compensation provides for two types of benefit payments: medical andindemnity. Medical benefits cover medical expenses resulting from a work-related injuryor disease. Medical benefits are a key cost driver for workers compensation. The share ofbenefits attributable to medical costs has grown. Chart 1 displays the medicalpercentage of total benefit costs for New Hampshire and the countrywide average for thepast 10 accident years.Chart 1Medical Share of Total Benefit 03200420052006200720082009201020%10%0%Accident YearNew HampshireCountrywideSource: NCCI Calendar-Accident Year Call for Compensation Experience. Countrywide includes data for the followingstates: AK, AL, AR, AZ, CO, CT, DC, FL, GA, HI, IA, ID, IL, KS, KY, LA, MD, ME, MO, MS, MT, NE, NH, NM, NV, OK, OR, RI,SC, SD, TN, UT, VA, and VT.1
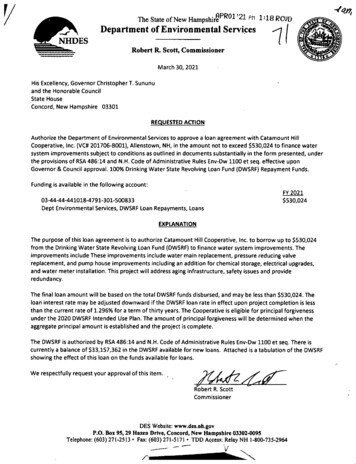
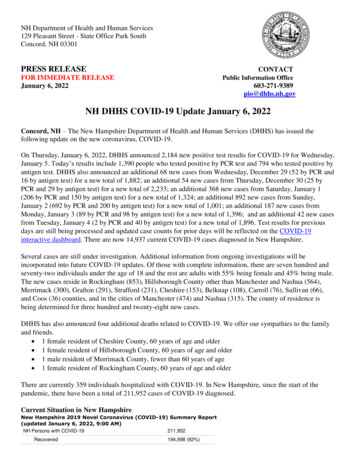
NEW HAMPSHIREChart 2 displays the historical overall medical average cost per case (per lost-time claim) forthe most recent 10 accident years. Results are displayed for both New Hampshire and thecountrywide average. Medical losses are at historical benefit levels and historical dollarvalues.Chart 2Overall Medical Average Cost per CaseCost Per Case ( 000)403020382710181619 200820092010020012002Accident YearNew HampshireCountrywideSource: NCCI Calendar-Accident Year Call for Compensation Experience. Losses and claim counts are developed to ultimate.Medical-only claim counts and losses are excluded. Countrywide includes data for the following states: AK, AL, AR, AZ, CO, CT,DC, FL, GA, HI, IA, ID, IL, KS, KY, LA, MD, ME, MO, MS, MT, NE, NH, NM, NV, OK, OR, RI, SC, SD, TN, UT, VA, and VT.2
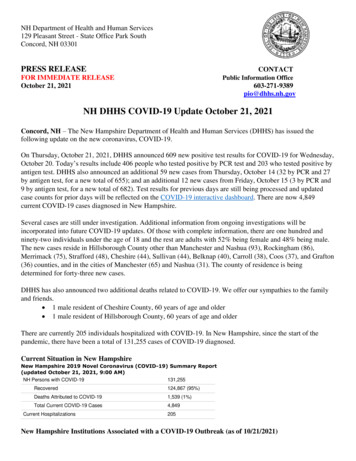
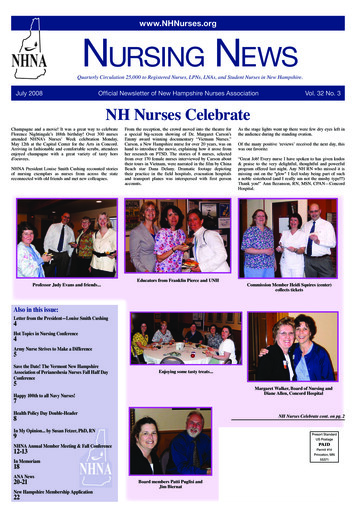
NEW HAMPSHIREOne factor that impacts medical costs is the time over which medical services are used.Payments on a workers compensation claim often continue for many years. The paymentpatterns for medical services are partly determined by the dispute resolution mechanism inthe state as well as statutory provisions for medical benefits. Chart 3 shows the percentageof medical benefits paid at different claim maturities for New Hampshire and the countrywideaverage.Chart 3Percentage of Medical Paid by Claim %30%27%30%20%10%0%126096228Months From Beginning of Accident YearNew HampshireCountrywideSource: NCCI Calendar-Accident Year Call for Compensation Experience. Countrywide includes data for thefollowing states: AK, AL, AR, AZ, CO, CT, DC, FL, GA, HI, IA, ID, IL, KS, KY, LA, MD, ME, MO, MS, MT, NE, NH,NM, OK, OR, RI, SC, SD, TN, UT, VA, and VT.3
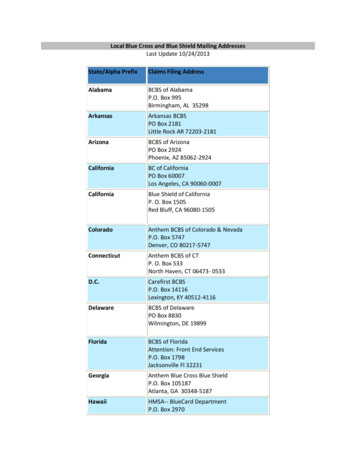
NEW HAMPSHIREKnowing how payments for different medical services contribute to workers compensationmedical benefit costs provides insight into the growth in medical benefits. Chart 4 displays thedistribution of medical payments by type of service.Payments are categorized as Drugs; Durable Medical Equipment (DME), Supplies, and Implants;and Other (includes home health, transportation, vision, and dental services), based on theprocedure code reported. Payments are mapped to these categories regardless of who providesthe service or where the service is performed. For the remaining categories—Physician, Hospital,and Ambulatory Surgical Centers—NCCI relies on a combination of procedure code, providertaxonomy code, and place of service to distinguish payment categories.Chart 4Distribution of Medical PaymentsNew HampshireDME,Supplies& Implants7%Other1%Drugs10%AmbulatorySurgical Centers5%Physician43%Hospital34%4
NEW HAMPSHIREDistribution of Medical PaymentsRegionDME,Supplies& ical Centers5%Hospital32%CountrywideDME,Supplies& gical Centers5%Hospital30%Source: NCCI Medical Data Call, Service Year 2011. Region includes CT, ME, RI, and VT. Countrywide includes data for thefollowing 35 states: AK, AL, AR, AZ, CO, CT, DC, FL, GA, HI, IA, ID, IL, KS, KY, LA, MD, ME, MO, MS, MT, NE, NH, NM, NV,OK, OR, RI, SC, SD, TN, UT, VA, VT, and WV.5
NEW HAMPSHIRECharts 5 through 13 go into greater detail on physician payments. Chart 5 shows the distributionof physician payments by service category. Service categories are defined by the AmericanMedical Association (AMA). The category labeled as “Medicine” includes physical therapy andoccupational therapy services. Services involving office visits and consultations are included inthe “Evaluation and Management” category. “Other” includes any codes not included in the AMAservice categories.Chart 5Distribution of Physician Payments by AMA Service CategoryNew HampshireOther3%Anesthesia4%Evaluation hology1%6
NEW HAMPSHIREDistribution of Physician Payments by AMA Service CategoryRegionOther6%Anesthesia4%Evaluation icine27%CountrywideOther5%Anesthesia5%Evaluation hology2%Source: NCCI Medical Data Call, Service Year 2011. Region includes CT, ME, RI, and VT. Countrywide includes data for the following35 states: AK, AL, AR, AZ, CO, CT, DC, FL, GA, HI, IA, ID, IL, KS, KY, LA, MD, ME, MO, MS, MT, NE, NH, NM, NV, OK, OR, RI, SC,SD, TN, UT, VA, VT, and WV.7
NEW HAMPSHIREChart 6 displays the top 10 surgery codes reported by physicians. The total payments byprocedure code are ranked from highest to lowest. The procedure code with the highestamount paid is ranked first. The procedure code with the second highest amount paid isranked second, and so on. This method of ranking shows which procedures have the highestpercent share of payments. A brief description of each procedure code is displayed in thetable below.Chart 6Top 10 Surgery Procedure Codes by Amount Paid for New HampshirePercent of Surgery Category 0647216303012001Procedure CodeSource: NCCI Medical Data Call, Service Year 303012001DescriptionArthroscopy shoulder surgical; decompression of subacromial space with partial acromioplasty withcoracoacromial ligament (i.e., arch) release when performedArthroscopy shoulder surgical; with rotator cuff repairArthroscopy knee surgical; with meniscectomy (medial or lateral including any meniscal shaving) includingdebridement/shaving of articular cartilageInjection(s) anesthetic agent and/or steroid transforaminal epidural with imaging guidance (fluoroscopy orcomputed tomography (CT)); lumbar or sacral single levelArthroscopy shoulder surgical; debridement extensiveInjection(s) of diagnostic or therapeutic substance(s) (including anesthetic antispasmodic opioid steroidother solution) not including neurolytic substances including needle or catheter placement includescontrast for localization when performed epidural or subarachnoidArthrocentesis aspiration and/or injection; major joint or bursa (e.g., shoulder hip knee joint subacromialbursa)Neuroplasty and/or transposition; median nerve at carpal tunnelLaminotomy (hemilaminectomy) with decompression of nerve root(s) including partial facetectomyforaminotomy and/or excision of herniated intervertebral discSimple repair of superficial wounds of scalp neck axillae external genitalia trunk and/or extremities(including hands and feet); 2.5 cm or less8
NEW HAMPSHIREChart 7 also displays the top 10 surgery codes reported by physicians. However, the total countsof transactions by procedure code are ranked from highest to lowest. The procedure code withthe highest total transaction counts is ranked first. The procedure code with the second highesttotal transaction counts is ranked second, and so on. This method reveals the most frequentlyused procedures. A brief description of each procedure code is displayed in the table below.Chart 7Top 10 Surgery Procedure Codes by Transaction Counts for New HampshirePercent of Surgery Category 1200229826364152055220605Procedure CodeSource: NCCI Medical Data Call, Service Year 055220605DescriptionArthrocentesis aspiration and/or injection; major joint or bursa (e.g., shoulder hip knee jointsubacromial bursa)Simple repair of superficial wounds of scalp neck axillae external genitalia trunk and/or extremities(including hands and feet); 2.5 cm or lessInjection(s) of diagnostic or therapeutic substance(s) (including anesthetic antispasmodic opioid steroidother solution) not including neurolytic substances including needle or catheter placement includescontrast for localization when performed epidural or subarachnoidApplication of short arm splint (forearm to hand); staticInjection(s) anesthetic agent and/or steroid transforaminal epidural with imaging guidance (fluoroscopyor computed tomography (CT)); lumbar or sacral single levelSimple repair of superficial wounds of scalp neck axillae external genitalia trunk and/or extremities(including hands and feet); 2.6 cm to 7.5 cmArthroscopy shoulder surgical; decompression of subacromial space with partial acromioplasty withcoracoacromial ligament (i.e., arch) release when performedCollection of venous blood by venipunctureInjection(s); single or multiple trigger point(s) 1 or 2 muscle(s)Arthrocentesis aspiration and/or injection; intermediate joint or bursa (e.g., temporomandibularacromioclavicular wrist elbow or ankle olecranon bursa)9
NEW HAMPSHIREChart 8 displays the top 10 radiology codes reported by physicians. The total payments byprocedure code are ranked from highest to lowest. The procedure code with the highestamount paid is ranked first. The procedure code with the second highest amount paid isranked second, and so on. This method of ranking shows which procedures have the highestpercent share of payments. A brief description of each procedure code is displayed in thetable below.Chart 8Top 10 Radiology Procedure Codes by Amount Paid for New HampshirePercent of Radiology Category 732227215877003730307045072100Procedure CodeSource: NCCI Medical Data Call, Service Year 045072100DescriptionMagnetic resonance (e.g., proton) imaging any joint of upper extremity; without contrast material(s)Magnetic resonance (e.g., proton) imaging any joint of lower extremity; without contrast materialMagnetic resonance (e.g., proton) imaging spinal canal and contents lumbar; without contrast materialMagnetic resonance (e.g., proton) imaging spinal canal and contents cervical; without contrast materialMagnetic resonance (e.g., proton) imaging any joint of upper extremity; with contrast material(s)Magnetic resonance (e.g., proton) imaging spinal canal and contents without contrast material followedby contrast material(s) and further sequencesFluoroscopic guidance and localization of needle or catheter tip for spine or paraspinous diagnostic ortherapeutic injection procedures (epidural or subarachnoid)Radiologic examination shoulder; complete minimum of 2 viewsComputed tomography (CT) head or brain; without contrast materialRadiologic examination spine lumbosacral; 2 or 3 views10
NEW HAMPSHIREChart 9 also displays the top 10 radiology codes reported by physicians. However, the totalcounts of transactions by procedure code are ranked from highest to lowest. The procedure codewith the highest total transaction counts is ranked first. The procedure code with the secondhighest total transaction counts is ranked second, and so on. This method reveals the mostfrequently used procedures. A brief description of each procedure code is displayed in the tablebelow.Chart 9Top 10 Radiology Procedure Codes by Transaction Counts for New HampshirePercent of Radiology Category 73610737217363073221Procedure CodeSource: NCCI Medical Data Call, Service Year 363073221DescriptionRadiologic examination shoulder; complete minimum of 2 viewsRadiologic examination finger(s) minimum of 2 viewsRadiologic examination spine lumbosacral; 2 or 3 viewsRadiologic examination hand; minimum of 3 viewsFluoroscopic guidance and localization of needle or catheter tip for spine or paraspinous diagnostic ortherapeutic injection procedures (epidural or subarachnoid)Radiologic examination wrist; complete minimum of 3 viewsRadiologic examination ankle; complete minimum of 3 viewsMagnetic resonance (e.g., proton) imaging any joint of lower extremity; without contrast materialRadiologic examination foot; complete minimum of 3 viewsMagnetic resonance (e.g., proton) imaging any joint of upper extremity; without contrast material(s)11
NEW HAMPSHIREChart 10 displays the top 10 medicine codes reported by physicians. The total payments byprocedure code are ranked from highest to lowest. The procedure code with the highestamount paid is ranked first. The procedure code with the second highest amount paid isranked second, and so on. This method of ranking shows which procedures have the highestpercent share of payments. A brief description of each procedure code is displayed in thetable below.Chart 10Top 10 Medicine Procedure Codes by Amount Paid for New HampshirePercent of Medicine Category 970109701497035975309703399199Procedure CodeSource: NCCI Medical Data Call, Service Year 703399199DescriptionTherapeutic procedure 1 or more areas each 15 minutes; therapeutic exercises to develop strength andendurance range of motion and flexibilityManual therapy techniques (e.g., mobilization/manipulation manual lymphatic drainage manual traction)1 or more regions each 15 minutesTherapeutic procedure 1 or more areas each 15 minutes; neuromuscular reeducation of movementbalance coordination kinesthetic sense posture and/or proprioception for sitting and/or standingactivitiesPhysical therapy evaluationApplication of a modality to 1 or more areas; hot or cold packsApplication of a modality to 1 or more areas; electrical stimulation (unattended)Application of a modality to 1 or more areas; ultrasound each 15 minutesTherapeutic activities direct (one-on-one) patient contact by the provider (use of dynamic activities toimprove functional performance) each 15 minutesApplication of a modality to 1 or more areas; iontophoresis each 15 minutesUnlisted special service procedure or report12
NEW HAMPSHIREChart 11 also displays the top 10 medicine codes reported by physicians. However, the totalcounts of transactions by procedure code are ranked from highest to lowest. The procedurecode with the highest total transaction counts is ranked first. The procedure code with thesecond highest total transaction counts is ranked second, and so on. This method reveals themost frequently used procedures. A brief description of each procedure code is displayed inthe table below.Chart 11Top 10 Medicine Procedure Codes by Transaction Counts for New HampshirePercent of Medicine Category 4971129703597530989419703397001Procedure CodeSource: NCCI Medical Data Call, Service Year 703397001DescriptionTherapeutic procedure 1 or more areas each 15 minutes; therapeutic exercises to develop strength andendurance range of motion and flexibilityManual therapy techniques (e.g., mobilization/manipulation manual lymphatic drainage manualtraction) 1 or more regions each 15 minutesApplication of a modality to 1 or more areas; hot or cold packsApplication of a modality to 1 or more areas; electrical stimulation (unattended)Therapeutic procedure 1 or more areas each 15 minutes; neuromuscular reeducation of movementbalance coordination kinesthetic sense posture and/or proprioception for sitting and/or standingactivitiesApplication of a modality to 1 or more areas; ultrasound each 15 minutesTherapeutic activities direct (one-on-one) patient contact by the provider (use of dynamic activities toimprove functional performance) each 15 minutesChiropractic manipulative treatment (CMT); spinal 3-4 regionsApplication of a modality to 1 or more areas; iontophoresis each 15 minutesPhysical therapy evaluation13
NEW HAMPSHIREChart 12 displays the top 10 evaluation and management codes reported by physicians. Thetotal payments by procedure code are ranked from highest to lowest. The procedure codewith the highest amount paid is ranked first. The procedure code with the second highestamount paid is ranked second, and so on. This method of ranking shows which procedureshave the highest percent share of payments. A brief description of each procedure code isdisplayed in the table below.Chart 12Top 10 Evaluation and Management Procedure Codes by Amount Paid for New HampshirePercent of E & M Category 992839924399212992849924499215Procedure CodeSource: NCCI Medical Data Call, Service Year 2011.Code99213DescriptionOffice or other outpatient visit for the evaluation and management of an established patient. Usually thepresenting problem(s) are of low to moderate severity. Physicians typically spend 15 minutes face-to-facewith the patient and/or family.99214Office or other outpatient visit for the evaluation and management of an established patient. Usually thepresenting problem(s) are of moderate to high severity. Physicians typically spend 25 minutes face-toface with the patient and/or family.Office or other outpatient visit for the evaluation and management of a new patient. Usually thepresenting problem(s) are of moderate severity. Physicians typically spend 30 minutes face-to-face withthe patient and/or family.Office or other outpatient visit for the evaluation and management of a new patient. Usually thepresenting problem(s) are of moderate to high severity. Physicians typically spend 45 minutes face-toface with the patient and/or family.Emergency department visit. Usually the presenting problem(s) are of moderate severity.Office consultation for a new or established patient. Usually the presenting problem(s) are of moderateseverity. Physicians typically spend 40 minutes face-to-face with the patient and/or family.Office or other outpatient visit for the evaluation and management of an established patient. Usually thepresenting problem(s) are self limited or minor. Physicians typically spend 10 minutes face-to-face withthe patient and/or family.992039920499283992439921214
NEW HAMPSHIRE992849924499215Emergency department visit. Usually the presenting problem(s) are of high severity and require urgentevaluation by the physician but do not pose an immediate significant threat to life or physiologic function.Office consultation for a new or established patient. Usually the presenting problem(s) are of moderate tohigh severity. Physicians typically spend 60 minutes face-to-face with the patient and/or family.Office or other outpatient visit for the evaluation and management of an established patient. Usually thepresenting problem(s) are of moderate to high severity. Physicians typically spend 40 minutes face-toface with the patient and/or family.15
NEW HAMPSHIREChart 13 displays the top 10 evaluation and management codes reported by physicians.However, the total counts of transactions by procedure code are ranked from highest tolowest. The procedure code with the highest total transaction counts is ranked first. Theprocedure code with the second highest total transaction counts is ranked second, and soon. This method reveals the most frequently used procedures. A brief description of eachprocedure code is displayed in the table below.Chart 13Top 10 Evaluation and Management Procedure Codes by Transaction Counts for New HampshirePercent of E & M Category 9921299203992839920499243992829928499202Procedure CodeSource: NCCI Medical Data Call, Service Year ptionOffice or other outpatient visit for the evaluation and management of an established patient. Usually thepresenting problem(s) are of low to moderate severity. Physicians typically spend 15 minutes face-toface with the patient and/or family.Office or other outpatient visit for the evaluation and management of an established patient. Usually thepresenting problem(s) are of moderate to high severity. Physicians typically spend 25 minutes face-toface with the patient and/or family.Office or other outpatient visit for the evaluation and management of an established patient. Usually thepresenting problem(s) are self limited or minor. Physicians typically spend 10 minutes face-to-face withthe patient and/or family.Office or other outpatient visit for the evaluation and management of a new patient. Usually thepresenting problem(s) are of moderate severity. Physicians typically spend 30 minutes face-to-face withthe patient and/or family.Emergency department visit. Usually the presenting problem(s) are of moderate severity.Office or other outpatient visit for the evaluation and management of a new patient. Usually thepresenting problem(s) are of moderate to high severity. Physicians typically spend 45 minutes face-toface with the patient and/or family.Office consultation for a new or established patient. Usually the presenting problem(s) are of moderateseverity. Physicians typically spend 40 minutes face-to-face with the patient and/or family.16
NEW HAMPSHIRE992829928499202Emergency department visit. Usually the presenting problem(s) are of low to moderate severity.Emergency department visit. Usually the presenting problem(s) are of high severity and require urgentevaluation by the physician but do not pose an immediate significant threat to life or physiologicfunction.Office or other outpatient visit for the evaluation and management of a new patient. Usually thepresenting problem(s) are of low to moderate severity. Physicians typically spend 20 minutes face-toface with the patient and/or family.17
NEW HAMPSHIREPayments attributed to facilities represent inpatient hospital services, outpatient hospitalservices, and ambulatory surgical center services. Payments are mapped to these categoriesbased on a combination of data elements reported for each transaction such as thetaxonomy code (identifies the provider type), procedure code (identifies what type of servicewas performed), and the place of service (identifies where the service was performed).Charts 14 through 17 go into greater detail on facility payments. Chart 14 displays thedistribution of payments by type of facility.Chart 14Distribution of Payments by Facility TypeNew HampshireAmbulatorySurgical Center12%Inpatient24%Outpatient64%18 pa
Chart 15 displays the top 10 procedure codes for inpatient hospital services. The total payments by procedure code are ranked from highest to lowest. The procedure code with the highest amount paid is ranked first. The procedure code with the second highest amount paid is ranked second, and so on. This method of ranking shows which procedures ha.